Difference between revisions of "Broadband CyberShake Validation"
| Line 1: | Line 1: | ||
This page follows on [[CyberShake BBP Verification]], moving from 1D comparisons to 3D CyberShake comparisons with both the BBP and observations. | This page follows on [[CyberShake BBP Verification]], moving from 1D comparisons to 3D CyberShake comparisons with both the BBP and observations. | ||
| + | == Northridge == | ||
| − | == 1D BBP comparisons == | + | === 1D BBP comparisons === |
We calculated 64 realizations for Northridge for these [[Media:northridge_stations.kml | 38 stations]]. | We calculated 64 realizations for Northridge for these [[Media:northridge_stations.kml | 38 stations]]. | ||
| Line 8: | Line 9: | ||
Some of the differences between the 1D BBP and 3D CyberShake results can be attributed to differences in site response, which is calculated based on the reference velocity ('vref') and the vs30 of the site. A spreadsheet with vref and Vs30 for both the BBP and CyberShake is available [[File:BBP_v_CyberShake_Northridge_vs30.xls | here.]] | Some of the differences between the 1D BBP and 3D CyberShake results can be attributed to differences in site response, which is calculated based on the reference velocity ('vref') and the vs30 of the site. A spreadsheet with vref and Vs30 for both the BBP and CyberShake is available [[File:BBP_v_CyberShake_Northridge_vs30.xls | here.]] | ||
| − | === V1 (2/14/22) === | + | ==== V1 (2/14/22) ==== |
Initially, we used vref=500 for both the high-frequency and low-frequency site response. However, this is incorrect; vref for the low-frequency should vary depending on the properties of the 3D velocity mesh. | Initially, we used vref=500 for both the high-frequency and low-frequency site response. However, this is incorrect; vref for the low-frequency should vary depending on the properties of the 3D velocity mesh. | ||
| − | === V2 (2/25/22) === | + | ==== V2 (2/25/22) ==== |
We continued to use vref=500 for the high-frequency site response. For the low-frequency site response, we are now using the same vref we used in Study 15.12: | We continued to use vref=500 for the high-frequency site response. For the low-frequency site response, we are now using the same vref we used in Study 15.12: | ||
| Line 60: | Line 61: | ||
|} | |} | ||
| − | === V3 (3/2/22) === | + | ==== V3 (3/2/22) ==== |
Next, we recalculated the CyberShake results for 10 sites, using the BBP vs30 values for both the low-frequency and high-frequency elements. Note that the vref low-frequency value for CyberShake is still being derived from the velocity model. | Next, we recalculated the CyberShake results for 10 sites, using the BBP vs30 values for both the low-frequency and high-frequency elements. Note that the vref low-frequency value for CyberShake is still being derived from the velocity model. | ||
| Line 94: | Line 95: | ||
|} //--> | |} //--> | ||
| − | == Observational Comparisons == | + | === Observational Comparisons === |
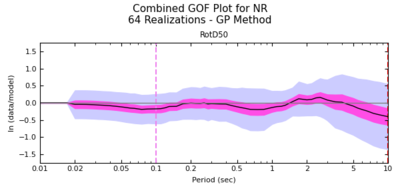
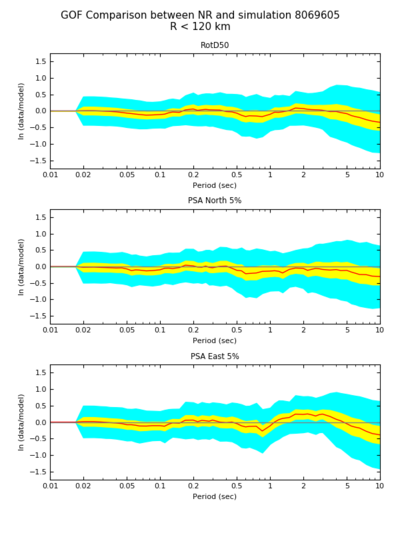
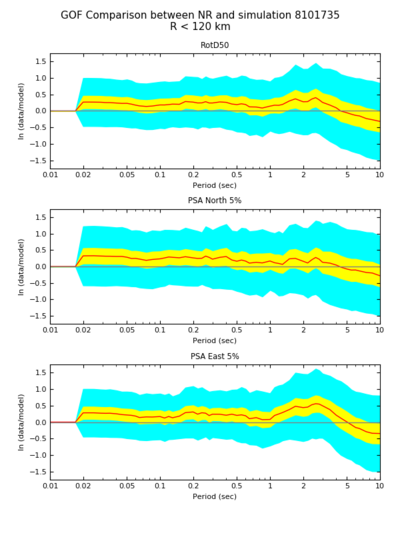
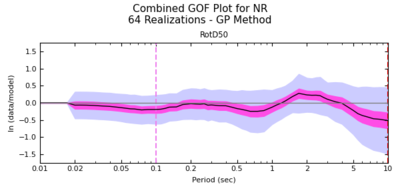
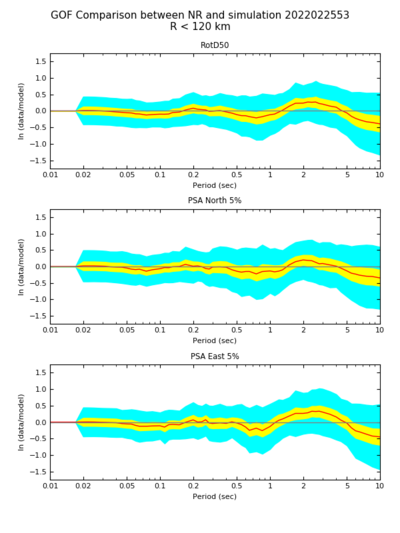
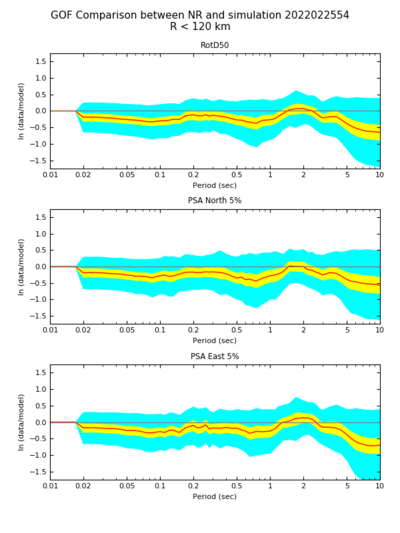
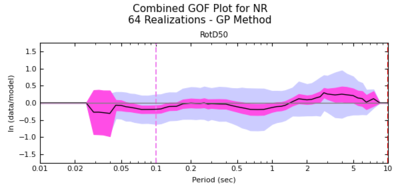
We calculated goodness-of-fit results for both Broadband CyberShake and the BBP against observations for Northridge, using the 64 realizations and 38 stations. | We calculated goodness-of-fit results for both Broadband CyberShake and the BBP against observations for Northridge, using the 64 realizations and 38 stations. | ||
| Line 100: | Line 101: | ||
TS process plots comparing the 3 results are available here: [https://g-c662a6.a78b8.36fe.data.globus.org/cybershake/Broadband_CyberShake/validation/Northridge/ts_process_nr.tgz v1 ts process plots]. | TS process plots comparing the 3 results are available here: [https://g-c662a6.a78b8.36fe.data.globus.org/cybershake/Broadband_CyberShake/validation/Northridge/ts_process_nr.tgz v1 ts process plots]. | ||
| − | === Broadband Platform === | + | ==== Broadband Platform ==== |
{| | {| | ||
| Line 110: | Line 111: | ||
|} | |} | ||
| − | === CyberShake v4_8 === | + | ==== CyberShake v4_8 ==== |
{| | {| | ||
| Line 120: | Line 121: | ||
|} | |} | ||
| − | === Broadband Platform, updated frequency bands === | + | ==== Broadband Platform, updated frequency bands ==== |
We realized that our GoF comparisons were run using hard-coded frequency bands of [0.05, 50] Hz. This was correct when doing CS-to-BBP comparisons, but not correct when using observations. We updated the frequency bands and reran the GoF. | We realized that our GoF comparisons were run using hard-coded frequency bands of [0.05, 50] Hz. This was correct when doing CS-to-BBP comparisons, but not correct when using observations. We updated the frequency bands and reran the GoF. | ||
| Line 135: | Line 136: | ||
| − | === CyberShake v4_8, updated frequency bands === | + | ==== CyberShake v4_8, updated frequency bands ==== |
As above, reran the GoF. | As above, reran the GoF. | ||
Revision as of 21:14, 26 April 2022
This page follows on CyberShake BBP Verification, moving from 1D comparisons to 3D CyberShake comparisons with both the BBP and observations.
Contents
Northridge
1D BBP comparisons
We calculated 64 realizations for Northridge for these 38 stations.
Some of the differences between the 1D BBP and 3D CyberShake results can be attributed to differences in site response, which is calculated based on the reference velocity ('vref') and the vs30 of the site. A spreadsheet with vref and Vs30 for both the BBP and CyberShake is available File:BBP v CyberShake Northridge vs30.xls
V1 (2/14/22)
Initially, we used vref=500 for both the high-frequency and low-frequency site response. However, this is incorrect; vref for the low-frequency should vary depending on the properties of the 3D velocity mesh.
V2 (2/25/22)
We continued to use vref=500 for the high-frequency site response. For the low-frequency site response, we are now using the same vref we used in Study 15.12:
vref_LF_eff = Vs30 * [ VsD5H / Vs5H ]
Vs30 = 30 / Sum (1/(Vs sampled from [0.5,29.5] in 1 meter increments))
H = grid spacing
Vs5H = travel time averaged Vs, computed from the CVM in 1 meter increments down to a depth of 5*H
VsD5H = discrete travel time averaged Vs computed from 3D velocity mesh used in the SGT calculation over the upper 5 grid points
So, for H=100m Vs5H would be:
Vs500 = 500 / ( Sum ( 1 / Vs sampled from [0.5,499.5] in 1 meter increments ))
And then VsD5H is given by:
VsD500 = 5/{ 0.5/Vs(Z=0m) + 1/Vs(Z=100m) + 1/Vs(Z=200m) + 1/Vs(Z=300m) + 1/Vs(Z=400m) + 0.5/Vs(Z=500m) }
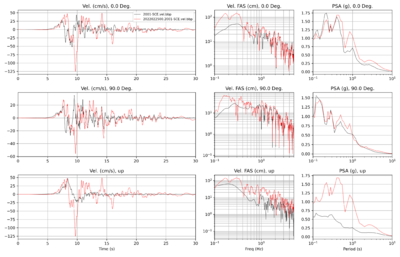
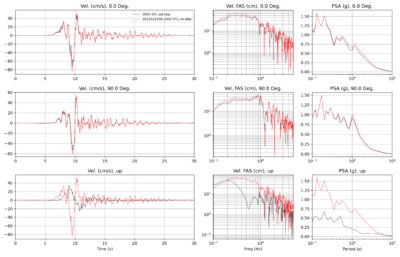
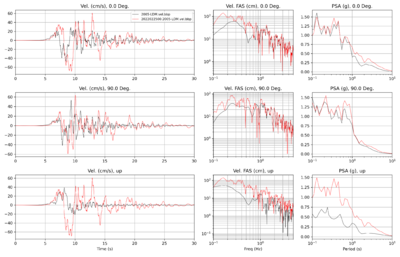
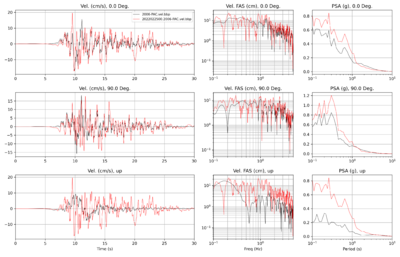
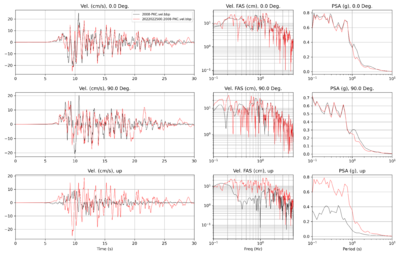
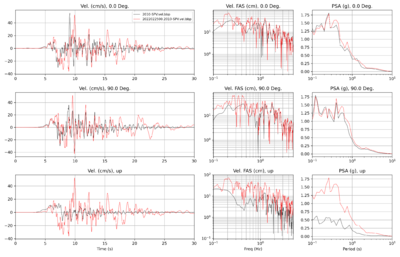
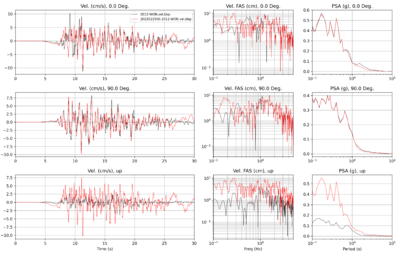
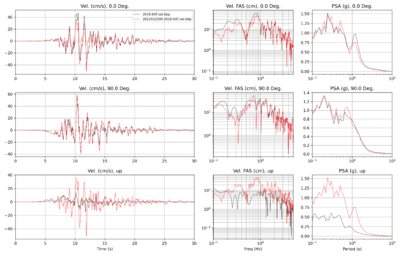
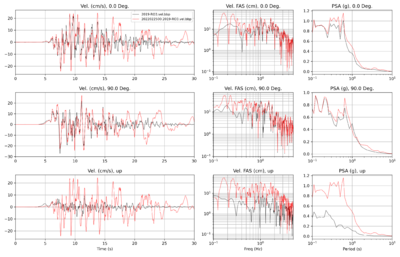
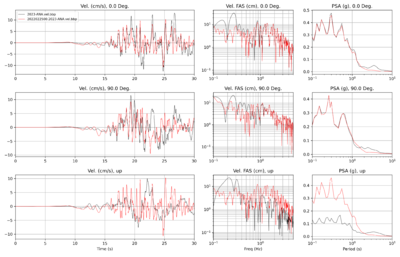
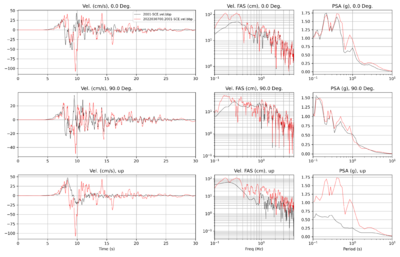
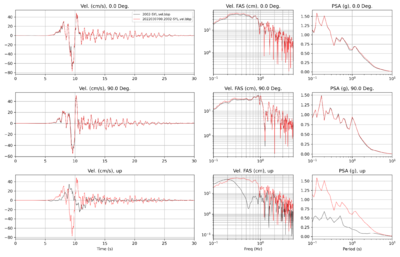
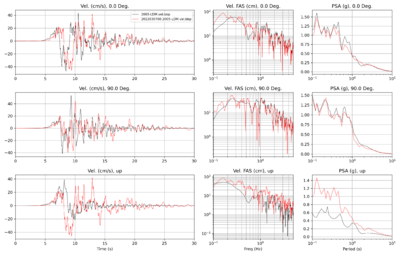
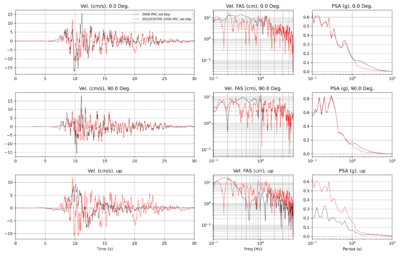
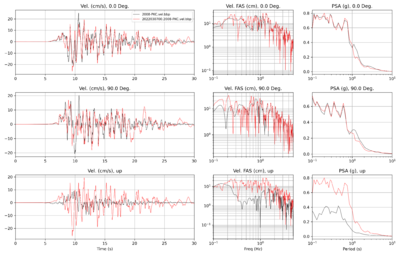
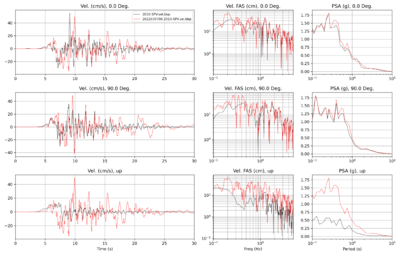
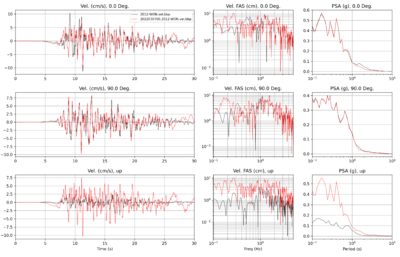
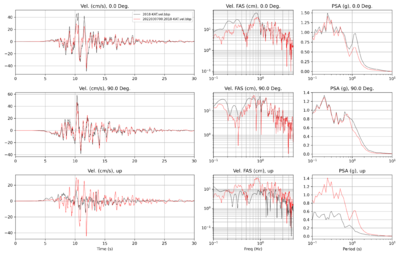
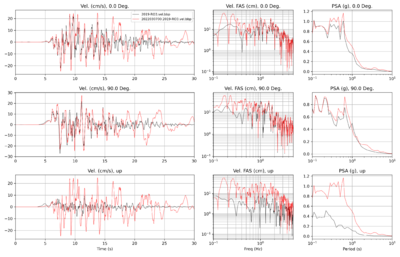
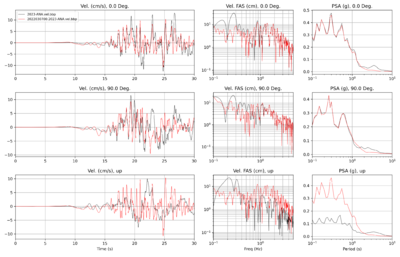
Below are the ts_process plots for a subset of 10 stations, comparing the 3D CyberShake with 1D BBP results.
| Site | TS Process plot |
|---|---|
| SCE | |
| SYL | |
| LDM | |
| PAC | |
| PKC | |
| SPV | |
| WON | |
| KAT | |
| RO3 | |
| ANA |
V3 (3/2/22)
Next, we recalculated the CyberShake results for 10 sites, using the BBP vs30 values for both the low-frequency and high-frequency elements. Note that the vref low-frequency value for CyberShake is still being derived from the velocity model.
| Site | TS Process plot |
|---|---|
| SCE | |
| SYL | |
| LDM | |
| PAC | |
| PKC | |
| SPV | |
| WON | |
| KAT | |
| RO3 | |
| ANA |
Observational Comparisons
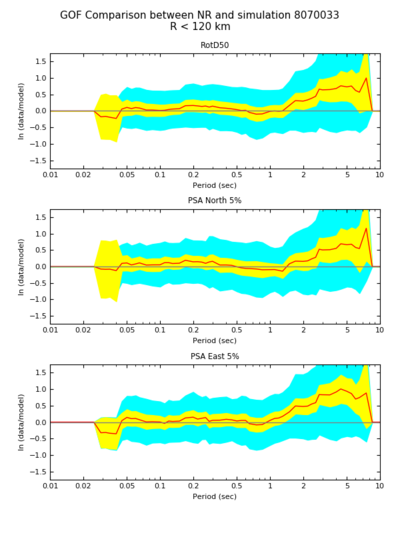
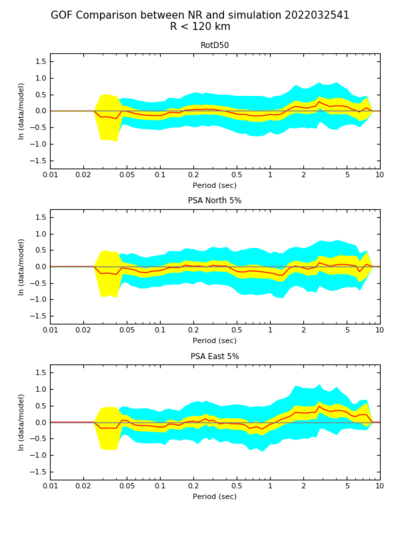
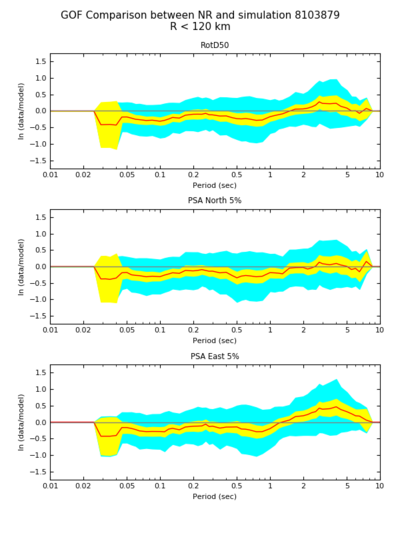
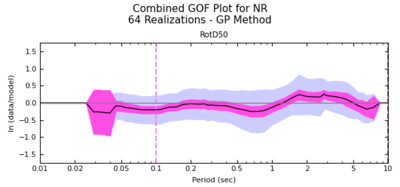
We calculated goodness-of-fit results for both Broadband CyberShake and the BBP against observations for Northridge, using the 64 realizations and 38 stations.
TS process plots comparing the 3 results are available here: v1 ts process plots.
Broadband Platform
| Overall GoF | GoF, best realization (#7) | GoF, worse realization (#15) |
|---|---|---|
CyberShake v4_8
| Overall GoF | GoF, best realization (#53) | GoF, worse realization (#54) |
|---|---|---|
Broadband Platform, updated frequency bands
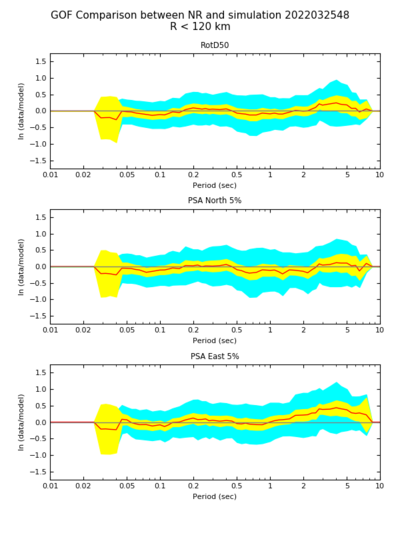
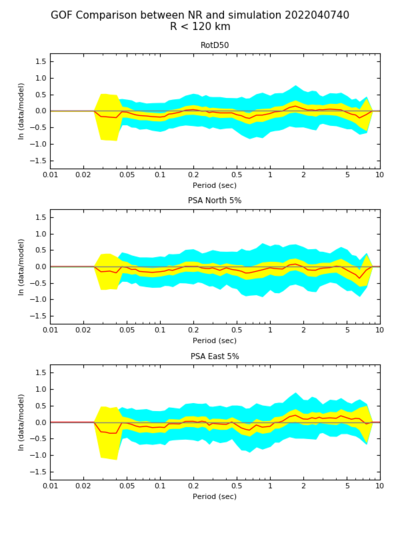
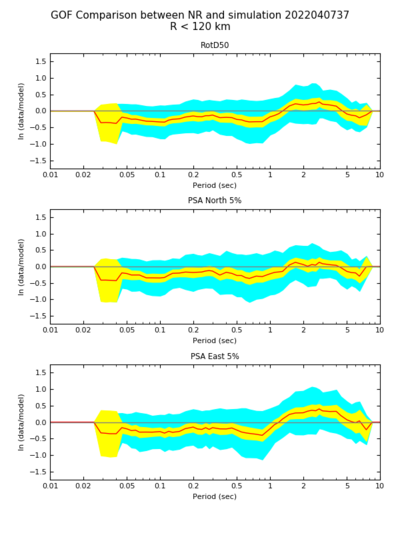
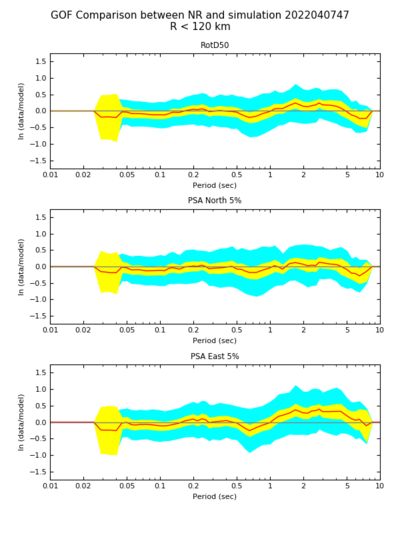
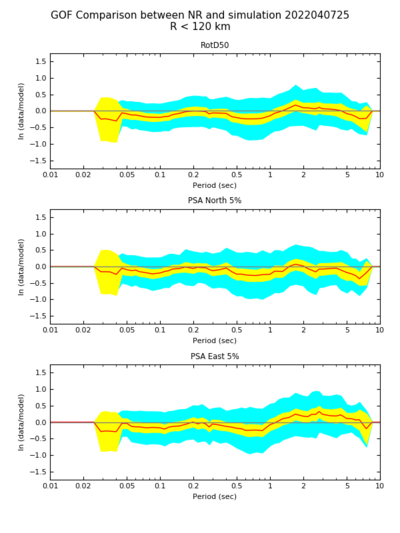
We realized that our GoF comparisons were run using hard-coded frequency bands of [0.05, 50] Hz. This was correct when doing CS-to-BBP comparisons, but not correct when using observations. We updated the frequency bands and reran the GoF.
| Overall GoF | GoF, best BBP realization (#47) | GoF, worst BBP realization (#25) | GoF, best CS realization (#40) | GoF, worst CS realization (#37) |
|---|---|---|---|---|
CyberShake v4_8, updated frequency bands
As above, reran the GoF.
| Overall GoF | GoF, best CS realization (#40) | GoF, worst CS realization (#37) | GoF, best BBP realization (#47) | GoF, worst BBP realization (#25) |
|---|---|---|---|---|
