Difference between revisions of "CVM Toolkit"
| (4 intermediate revisions by 2 users not shown) | |||
| Line 17: | Line 17: | ||
The Automated Test Framework (ATF) is a system for quantitatively evaluating new versions of CVM-H and ensuring that the model improves against prior versions. The ATF employs the CruiseControl build and test framework to run an AWP-ODC simulation for the 2008 Chino Hills event (Mw = 5.39) and perform a goodness of fit statistics calculation on the generated synthetic and recorded observed seismograms using the GoF algorithm, based on comparison of synthetic peak amplitudes to observed peak amplitudes, used in the SCEC Broadband platform. CVM-T produced plots include comparisons of synthetic and observed seismograms, plots of bias versus period, and spatial plots of the pseudo-AA bias over the entire region. | The Automated Test Framework (ATF) is a system for quantitatively evaluating new versions of CVM-H and ensuring that the model improves against prior versions. The ATF employs the CruiseControl build and test framework to run an AWP-ODC simulation for the 2008 Chino Hills event (Mw = 5.39) and perform a goodness of fit statistics calculation on the generated synthetic and recorded observed seismograms using the GoF algorithm, based on comparison of synthetic peak amplitudes to observed peak amplitudes, used in the SCEC Broadband platform. CVM-T produced plots include comparisons of synthetic and observed seismograms, plots of bias versus period, and spatial plots of the pseudo-AA bias over the entire region. | ||
| − | |||
| − | |||
| − | |||
| − | |||
| − | |||
| − | |||
| − | |||
| − | |||
| − | |||
| − | |||
| − | |||
| − | |||
| − | |||
| − | |||
| − | |||
| − | |||
| − | |||
| − | |||
| − | |||
| − | |||
| − | |||
== Documentation == | == Documentation == | ||
| Line 43: | Line 22: | ||
*[[CVM-T User Guide]] | *[[CVM-T User Guide]] | ||
*[[CVM-T Release Process]] | *[[CVM-T Release Process]] | ||
| − | |||
== Posters, Publications, and Presentations == | == Posters, Publications, and Presentations == | ||
| Line 49: | Line 27: | ||
*[http://earth.usc.edu/~patrices/scec_am_2010.html 2010 SCEC Annual Meeting CVM-T poster ] | *[http://earth.usc.edu/~patrices/scec_am_2010.html 2010 SCEC Annual Meeting CVM-T poster ] | ||
*[http://earth.usc.edu/~patrices/scec_cvmt_walkthrough.ppt CVM-T Walkthrough powerpoint ] | *[http://earth.usc.edu/~patrices/scec_cvmt_walkthrough.ppt CVM-T Walkthrough powerpoint ] | ||
| − | |||
==Issue Tracking== | ==Issue Tracking== | ||
| − | * CVM-H https:// | + | * CVM-H https://northridge.usc.edu/trac/cvmh/ |
| − | * cvmtest https:// | + | * cvmtest https://northridge.usc.edu/trac/cvmtest/ |
* cvm2mesh | * cvm2mesh | ||
* viz-cvm | * viz-cvm | ||
| − | |||
== Software Architecture == | == Software Architecture == | ||
| Line 80: | Line 56: | ||
| + | {| class="wikitable" | border="0" | ||
| + | |- | ||
| + | |- | ||
| + | | [[Image:CVM H vx interface.PNG|256px|thumb|left|Fig 7: CVM-H Vx User Interfaces]] | ||
| + | | [[Image:CVM H vx lite interface.PNG|256px|thumb|left|Fig 8: CVM-H Vx_Lite User Interfaces]] | ||
| + | |} | ||
== Code Repositories == | == Code Repositories == | ||
| Line 87: | Line 69: | ||
* viz-cvm https://source.usc.edu/svn/viz-cvm/ | * viz-cvm https://source.usc.edu/svn/viz-cvm/ | ||
* cvmtest https://source.usc.edu/svn/cvmtest/ | * cvmtest https://source.usc.edu/svn/cvmtest/ | ||
| − | |||
== Software Distributions == | == Software Distributions == | ||
| − | + | CVM software used in CVM-H 11.1.0_RC evaluation: | |
| + | http://hypocenter.usc.edu/research/cvmtest/11.1.0_RC/ | ||
== Contributors == | == Contributors == | ||
| Line 105: | Line 87: | ||
*A. Plesch | *A. Plesch | ||
*J. Shaw | *J. Shaw | ||
| − | |||
== References == | == References == | ||
Latest revision as of 03:57, 25 February 2011
SCEC CVM-Toolkit (CVM-T) – High Performance Meshing Tools for SCEC Community Velocity Models
The SCEC Community Velocity Model Toolkit (CVM-T) enables earthquake modelers to quickly build, visualize, and validate large-scale meshes using SCEC CVM-H or CVM-4. CVM-T is comprised of three main components:
- An updated community velocity model for Southern California based on SCEC CVM-H
- Tools for extracting 3D regular meshes from this model and visualizing them
- An automated test framework for evaluating new releases of CVMs using SCEC’s AWP-ODC forward wave propagation software and one, or more, ground motion goodness of fit (GoF) algorithms.
Contents
Summary
The SCEC Community Velocity Model Toolkit (CVM-T) enables earthquake modelers to quickly build, visualize, and validate large-scale meshes using SCEC CVM-H or CVM-4. CVM-T is comprised of three main components: (1) an updated community velocity model for Southern California, (2) tools for extracting meshes from this model and visualizing them, and (3) an automated test framework for evaluating new releases of CVM’s using SCEC’s AWP-ODC forward wave propagation software and one, or more, ground motion goodness of fit (GoF) algorithms.
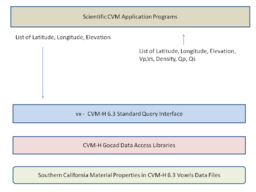
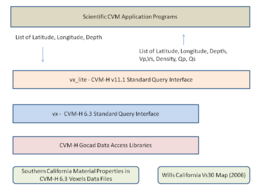
CVM-T is designed to help SCEC modelers build large-scale velocity meshes by extracting material properties from an extended version of Harvard University's Community Velocity Model (CVM-H). The CVM-T software provides a highly-scalable interface to CVM-H 6.2 (and later) voxets. Along with an improved interface to CVM-H material properties, the CVM-T software adds a geotechnical layer (GTL) to CVM-H 6.2+ based on Ely’s Vs30-derived GTL. The initial release of CVM-T also extends the coverage region for CVM-H 6.2 with a Hadley-Kanamori 1D background. Smoothing is performed within the transition boundary between the core model and the 1D background. The user interface now includes a C API that allows applications to query the model either by elevation or depth.
The Extraction and Visualization Tools (EVT) include a parallelized 3D mesh generator which can quickly generate meshes (consisting of Vp, Vs, and density) from either CVM-H or CVM-4 with over 100 billion points. Python plotting scripts can be employed to plot horizontal or profile slices from existing meshes or directly from either CVM.
The Automated Test Framework (ATF) is a system for quantitatively evaluating new versions of CVM-H and ensuring that the model improves against prior versions. The ATF employs the CruiseControl build and test framework to run an AWP-ODC simulation for the 2008 Chino Hills event (Mw = 5.39) and perform a goodness of fit statistics calculation on the generated synthetic and recorded observed seismograms using the GoF algorithm, based on comparison of synthetic peak amplitudes to observed peak amplitudes, used in the SCEC Broadband platform. CVM-T produced plots include comparisons of synthetic and observed seismograms, plots of bias versus period, and spatial plots of the pseudo-AA bias over the entire region.
Documentation
Posters, Publications, and Presentations
Issue Tracking
- CVM-H https://northridge.usc.edu/trac/cvmh/
- cvmtest https://northridge.usc.edu/trac/cvmtest/
- cvm2mesh
- viz-cvm
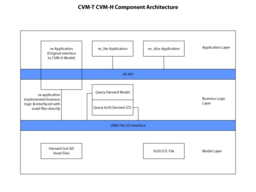
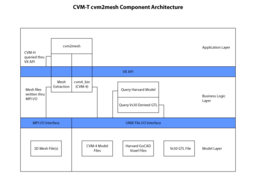
Software Architecture
- Dependency Diagram
- Architecture Diagrams
Code Repositories
- CVM-H https://source.usc.edu/svn/cvmh/
- cvm2mesh https://source.usc.edu/svn/cvm2mesh/
- viz-cvm https://source.usc.edu/svn/viz-cvm/
- cvmtest https://source.usc.edu/svn/cvmtest/
Software Distributions
CVM software used in CVM-H 11.1.0_RC evaluation:
http://hypocenter.usc.edu/research/cvmtest/11.1.0_RC/
Contributors
References
- Suess, M. P., and J. H. Shaw, 2003: P-wave seismic velocity structure derived from sonic logs and industry reflection data in the Los Angeles basin, California, Journal of Geophysical Research, 108/B3.
- Plesch, A., C. Tape, J. H. Shaw, and members of the USR working group, 2009, CVM-H 6.0: Inversion integration, the San Joaquin Valley and other advances in the community velocity model, in 2009 Southern California Earthquake Center Annual Meeting, Proceedings and Abstracts, vol. 19, pp. 260–261.
- Tape, C., Q. Liu, A. Maggi, and J. Tromp, 2009: Adjoint tomography of the southern California crust, Science, v. 325, p. 988-992.
- Magistrale, H., S. Day, R. W. Clayton, and R. Graves, 2000: The SCEC southern California reference 3D seismic velocity model Version 2, Bull. Seismol. Soc. Am., v. 90, no. 6B, p. S65-S76
- Ely, G., 2010: Vs30 Derived GTL


