CyberShake Study 15.4
CyberShake Study 15.4 is a computational study to calculate one physics-based probabilistic seismic hazard model for Southern California at 1 Hz, using CVM-S4.26, the GPU implementation of AWP-ODC-SGT, the Graves and Pitarka (2015) rupture variations with uniform hypocenters, and the UCERF2 ERF. The SGT calculations will be split between NCSA Blue Waters and OLCF Titan, and the post-processing will be done entirely on Blue Waters. The goal is to calculate the standard Southern California site list (286 sites) used in previous CyberShake studies so we can produce comparison curves and maps, and data products for the UGMS Committee.
Contents
- 1 Status
- 2 Data Products
- 3 CyberShake PSHA Curves for UGMS sites
- 4 Science Goals
- 5 Technical Goals
- 6 Verification
- 7 Sites
- 8 Performance Enhancements (over Study 14.2)
- 9 Codes
- 10 Lessons Learned
- 11 Computational and Data Estimates
- 12 Performance Metrics
- 13 Presentations and Papers
- 14 Production Checklist
- 15 Preparation for production runs
- 16 See Also
Status
Study 15.4 began execution at 10:44:11 PDT on April 16, 2015.
Progress can be monitored here (requires SCEC login).
Study 15.4 completed at 12:56:26 PDT on May 24, 2015.
Data Products
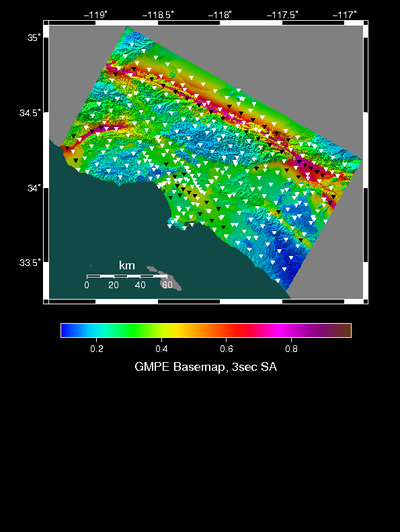
Hazard maps from Study 15.4 are posted:
CyberShake PSHA Curves for UGMS sites
- LADT 34.05204,-118.25713,390,2.08,0.31,358.648529052734
- WNGC 34.04182,-118.0653,280,2.44,0.51,295.943481445312
- PAS 34.14843,-118.17119,748,0.31,0.01,820.917602539062
- SBSM 34.06499,-117.29201,280,1.77,0.33,354.840637207031
- STNI 33.93088,-118.17881,280,5.57,0.88,268.520843505859
- SMCA 34.00909,-118.48939,387,2.47,0.59,386.607238769531
- CCP 34.05489,-118.41302,387,2.96,0.39,361.695495605469
- COO 33.89604,-118.21639,280,4.28,0.73,266.592071533203
- LAPD 34.557,-118.125,515,0,0,2570.64306640625
- P22 34.18277,-118.56609,280,2.27,0.22,303.287017822266
- s429 33.80858,-118.23333,280,2.83,0.71,331.851654052734
- s684 33.93515,-117.40266,387,0.31,0.15,363.601440429688
- s603 34.10275,-117.53735,354,0.43,0.19,363.601440429688
- s758 33.37562,-117.53532,390,1.19,0,2414.40844726562
Science Goals
- Calculate a 1 Hz hazard map of Southern California.
- Produce a contour map at 1 Hz for the UGMS committee.
- Compare the hazard maps at 0.5 Hz and 1 Hz.
- Produce a hazard map with the Graves & Pitarka (2014) rupture generator.
Technical Goals
- Show that Titan can be integrated into our CyberShake workflows.
- Demonstrate scalability for 1 Hz calculations.
- Show that we can split the SGT calculations across sites.
Verification
Forward Comparison
More information on a comparison of forward and reciprocity results is available here.
DirectSynth
To reduce the I/O requirements of the post-processing, we have moved to a new post-processing code, DirectSynth.
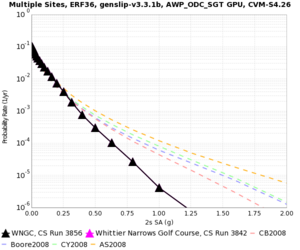
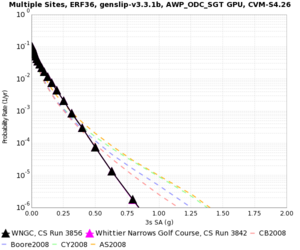
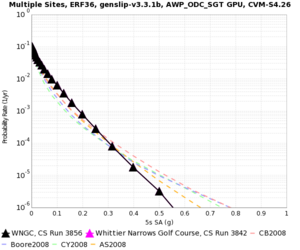
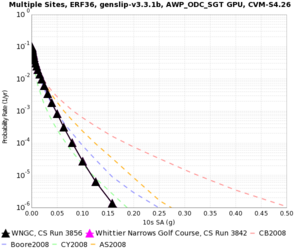
A comparison of 1 Hz results with SeisPSA to results with DirectSynth for WNGC. SeisPSA results are in magenta, DirectSynth results are in black. They're so close it's difficult to make out the magenta.
| 2s | 3s | 5s | 10s |
|---|---|---|---|
2 Hz source
Before beginning Study 15.4, we wanted to investigate our source filtering parameters, to see if it was possible to improve the accuracy of hazard curves at frequencies closer to the CyberShake study frequency.
In describing our results, we will refer to the "simulation frequency" and the "source frequency". The simulation frequency refers to the choice of mesh spacing and dt. The source frequency is the frequency the impulse used in the SGT simulation was low-pass filtered (using a 4th order Butterworth filter) at.
All of these calculations were done for WNGC, ERF 36, with uniform ruptures and the AWP-ODC-GPU SGT code.
Comparisons were done using the following runs:
- 0.5 Hz simulation, 0.5 Hz filtered source (run 3837)
- 0.5 Hz simulation, 1 Hz filtered source (run 3853)
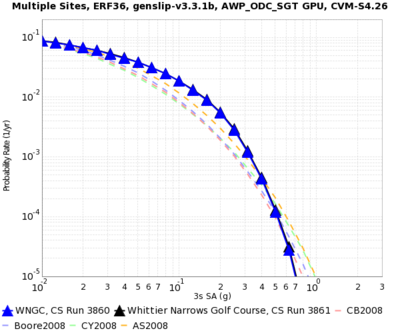
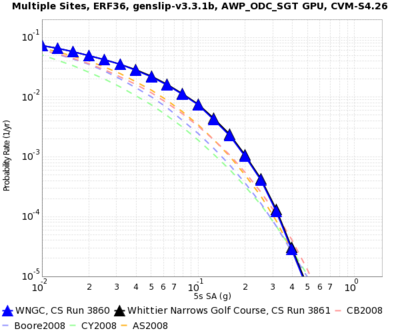
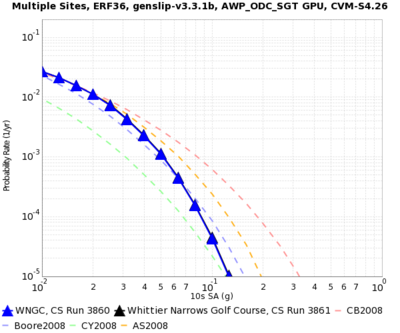
- 1 Hz simulation, 2 Hz filtered source (run 3860)
- 1 Hz simulation, 1 Hz filtered source (run 3861)
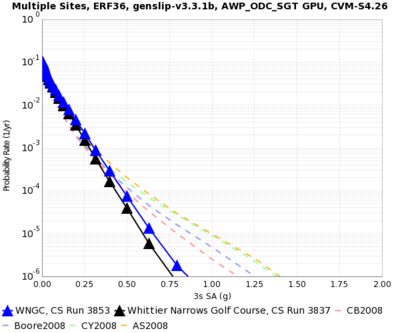
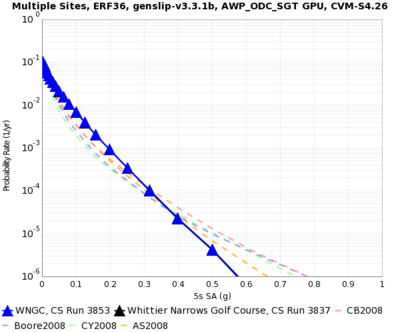
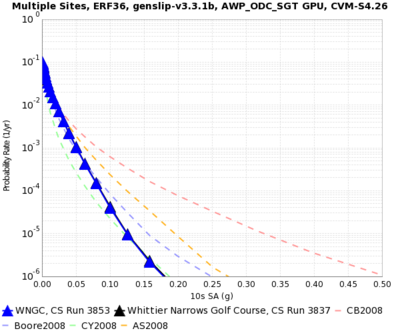
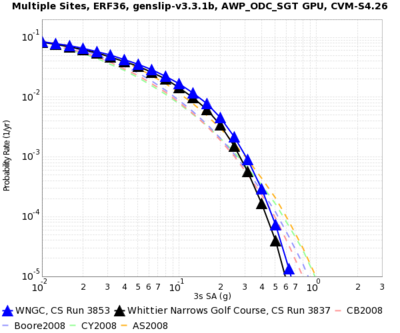
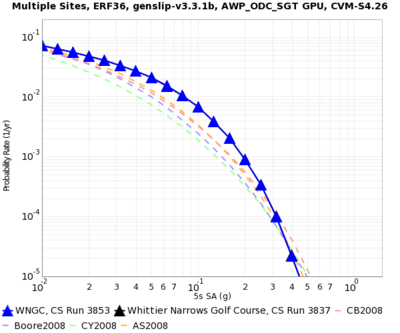
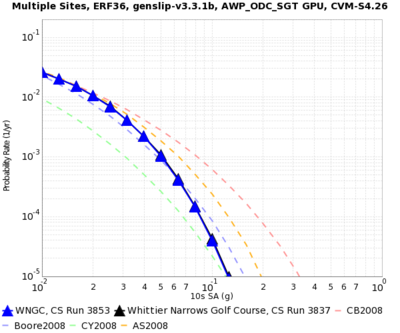
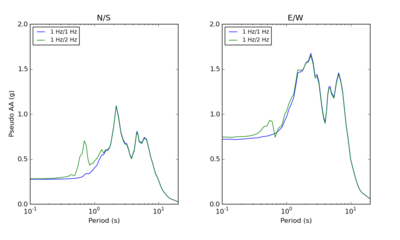
First, we performed a run with a 0.5 Hz simulation frequency and a 1.0 Hz source frequency, and compared it to the runs we had been doing in the past, which are 0.5 Hz simulation / 0.5 Hz source. The 1.0 Hz source frequency has an impact on the hazard curves, even at 3 seconds. Semilog curves are on the top row, log/log curves on the bottom.
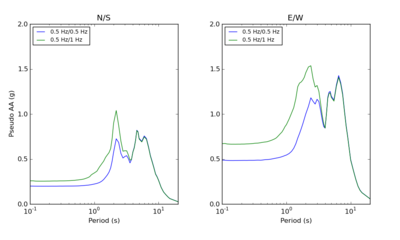
From spectral plots of the largest 3 sec PSA seismograms, we can see that the PseudoAA response is affected, even at periods much higher than the filter frequency:
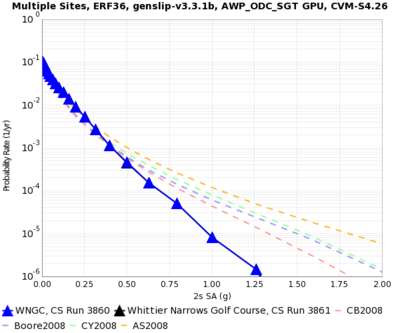
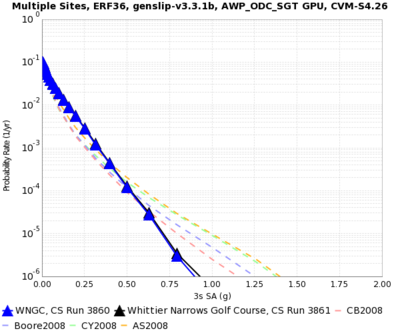
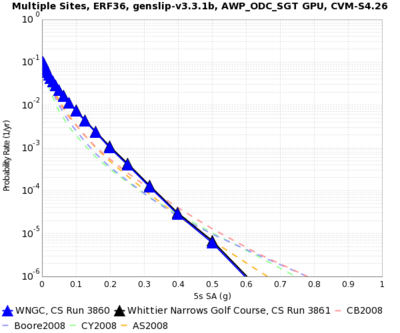
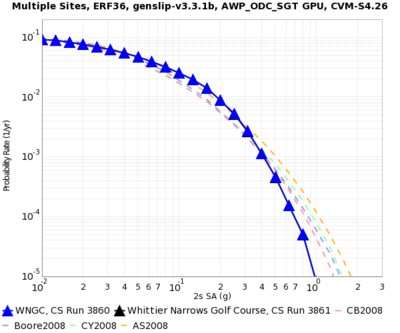
Next, we repeated the same experiment for a 1.0 Hz simulation frequency and a 1.0 Hz and 2.0 Hz source frequency:
The hazard curves are practically the same. To try to understand why the hazard curves from the 1.0 Hz experiment don't show the same kind of differences we saw at 0.5 Hz, we first looked at the SGTs.
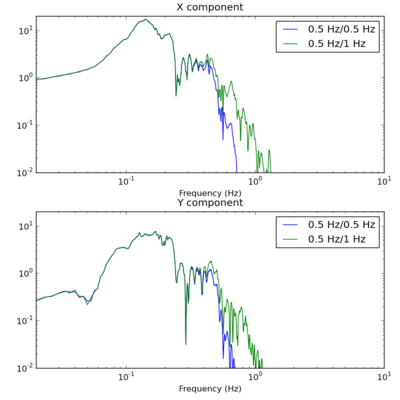
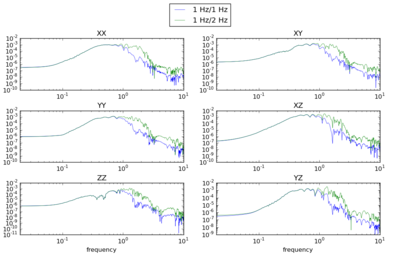
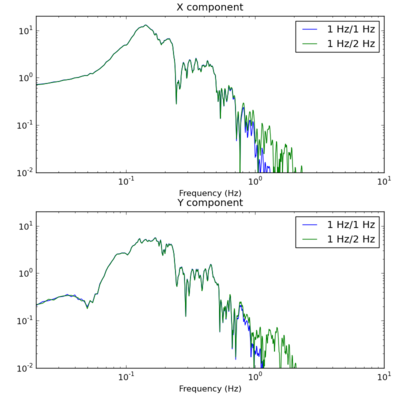
There is a clear difference in the spectral content of SGTs generated with different frequency content - you can see the different in these Fourier spectra plots, starting at about 1.0 Hz:
The differences are also clear when examining the frequency content of a large-amplitude seismogram, starting around 0.7 or 0.8 Hz:
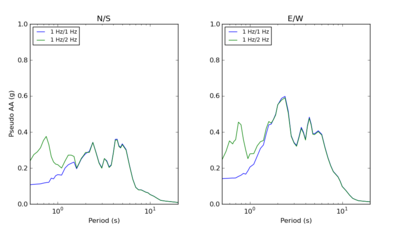
However, these differences are about 2 orders of magnitude smaller in amplitude than the largest amplitudes, around 0.1 Hz. This is unlike the 0.5 Hz results, in which we see only about 1 order of magnitude difference. Additionally, we see these differences starting at about 0.7 or 0.8 Hz, so they are not picked up by the 2 second hazard curves. Part of the reason for this is because the source doesn't have a lot of high frequency content. Rob is investigating this for future updates to the rupture generator.
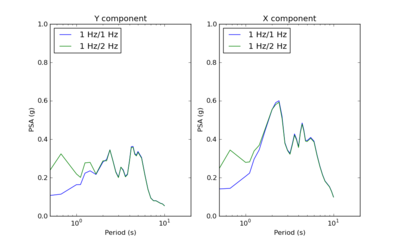
We also compared Respect and PSA results to verify the spectral response codes; there are some small differences at high frequency, but overall they are very similar:
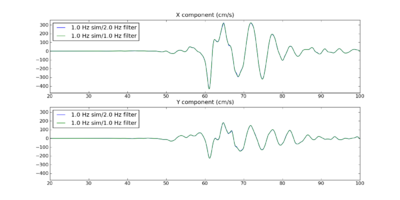
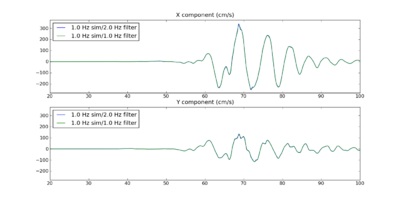
Using a 2 Hz filter does have small impacts on the seismograms; for example, here are plots of two of the largest seismograms for WNGC with a 1 Hz and 2 Hz source filter. The seismograms generated with the 2 Hz source filter have sharper peaks which are a results of their higher frequency content, but it should not be trusted, as the mesh spacing and dt of the simulation do not justify accuracy above 1 Hz:
So for non-frequency-dependent applications of seismograms generated with a 2 Hz source, they should be filtered.
Based on this analysis, we plan to perform Study 15.4 using a filter of 2 Hz, to capture additional frequency information between 0.7 and 1 Hz. We have updated the database schema so that we can capture the filter frequency used for various runs.
Blue Waters vs Titan for SGT calculation
SGT duration
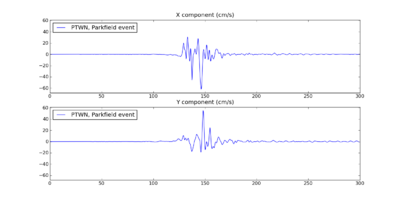
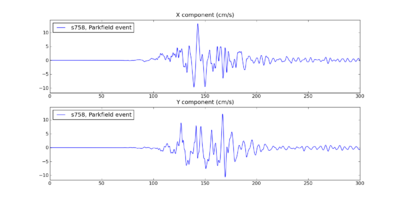
The SGTs are generated for 200 seconds. However, the reciprocity calculations are performed for 300 seconds.
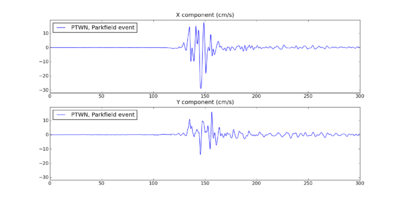
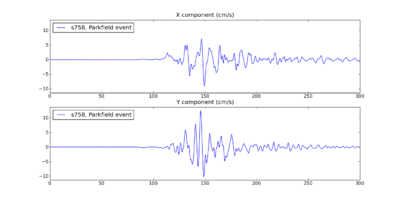
For Parkfield San Andreas events, the farthest sites are PTWN (420 km) and s758 (400 km). The seismograms for the northernmost events at those stations are below.
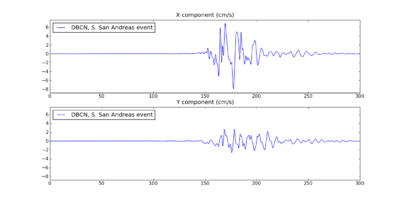
For Bombay Beach San Andreas events, the farthest site is DBCN (510 km).
Sites
We are proposing to run 336 sites around Southern California. Those sites include 46 points of interest, 27 precarious rock sites, 23 broadband station locations, 43 20 km gridded sites, and 147 10 km gridded sites. All of them fall within the Southern California box except for Diablo Canyon and Pioneer Town. You can get a CSV file listing the sites here.
Performance Enhancements (over Study 14.2)
Responses to Study 14.2 Lessons Learned
- AWP_ODC_GPU code, under certain situations, produced incorrect filenames.
This was fixed during the Study 14.2 run.
- Incorrect dependency in DAX generator - NanCheckY was a child of AWP_SGTx.
This was fixed during the Study 14.2 run.
- Try out Pegasus cleanup - accidentally blew away running directory using find, and later accidentally deleted about 400 sets of SGTs.
We have added cleanup to the SGT workflow, since that's where most of the extra data is generated, especially with two copies of the SGTs (the ones generated by AWP-ODC-GPU, and then the reformatted ones).
- 50 connections per IP is too many for hpc-login2 gridftp server; brings it down. Try using a dedicated server next time with more aggregated files.
We have moved our USC gridftp transfer endpoint to hpc-scec.usc.edu, which does very little other than GridFTP transfers.
SGT codes
- We have moved to a parallel version of reformat_awp. With this parallel version, we can reduce the runtime by 65%.
PP codes
- We have switched from using extract_sgt for the SGT extraction and SeisPSA for the seismogram synthesis to DirectSynth, a code which reads in the SGTs across multiple cores and then uses MPI to send them directly to workers, which perform the seismogram synthesis. We anticipate this code will give us an efficiency improvement of at least 50% over the old approach, since it does not require the writing and reading of the extracted SGT files.
Workflow management
- We are using a pilot job daemon on Titan to monitor the shock queue and submit pilot jobs to Titan accordingly.
- The MD5sums calculated on the SGTs at the start of the post-processing now run in parallel with the actual post-processing calculations. If the MD5 sum job fails, the entire workflow will be aborted, but since that is rare, the majority of the time the rest of the post-processing workflow can continue without having the MD5 sums in the critical path.
Codes
The CyberShake codebase used for this study was tagged "study_15_4" in the CyberShake SVN repository on source.
Additional dependencies not in the SVN repository include:
Blue Waters
- UCVM 14.3.0
- Euclid 1.3
- Proj 4.8.0
- CVM-S 4.26
- Memcached 1.4.15
- Libmemcached 1.0.18
- Libevent 2.0.21
- Pegasus 4.5.0, updated from the Pegasus git repository. pegasus-version reports version 4.5.0cvs-x86_64_sles_11-20150224175937Z .
Titan
- UCVM 14.3.0
- Euclid 1.3
- Proj 4.8.0
- CVM-S 4.26
- Pegasus 4.5.0, updated from the Pegasus git repository.
- pegasus-version for the login and service nodes reports 4.5.0cvs-x86_64_sles_11-20140807210927Z
- pegasus-version for the compute nodes reports 4.5.0cvs-x86_64_sles_11-20140807211355Z
- HTCondor version: 8.2.1 Jun 27 2014 BuildID: 256063
shock.usc.edu
- Pegasus 4.5.0 RC1. pegasus-version reports 4.5.0rc1-x86_64_rhel_6-20150410215343Z .
- HTCondor 8.2.8 Apr 07 2015 BuildID: 312769
- Globus Toolkit 5.2.5
Lessons Learned
- Some of the DirectSynth jobs couldn't fit their SGTs into the number of SGT handlers, nor finish in the wallclock time. In the future, test against a larger range of volumes and sites.
- Some of the cleanup jobs aren't fully cleaning up.
- On Titan, when a pilot job doesn't complete successfully, the dependent pilot jobs remain in a held state. This isn't reflected in qstat, so a quick look doesn't show that some of these jobs are being held and will never run. Additionally, I suspect that pilot jobs exit with a non-zero exit code when there's a pile-up of workflow jobs, and some try to sneak in after the first set of workflow jobs runs on the pilot jobs, meaning that the job gets kicked out for exceeding wallclock time. We should address this next time.
- On Titan, a few of the PostSGT and MD5 jobs didn't finish in the 2 hours, so they had to be run on Rhea by hand, which has a longer permitted wallclock time. We should think about moving these kind of processing jobs to Rhea in the future.
Computational and Data Estimates
Computational Time
Titan
SGTs (GPU): 1800 node-hrs/site x 143 sites = 258K node-hours = 7.7M SUs
Add 25% margin: 9.6M SUs
Blue Waters
SGTs (GPU): 1300 node-hrs/site x 143 sites = 186K node-hours (3.0M SUs), XK nodes
SGTs (CPU): 100 node-hrs/site x 143 sites = 14K node-hours (458K SUs), XE nodes
PP: 1500 node-hrs/site x 286 sites = 429K node-hours (13.7M SUs), XE nodes
Add 25% margin: 768K node-hours
Storage Requirements
Titan
Purged space to store SGTs while generating: (1.5 TB SGTs + 120 GB mesh + 1.5 TB reformatted SGTs)/site x 143 sites = 446 TB
Blue Waters
Space to store SGTs (delayed purge): 1.5 TB/site x 286 sites = 429 TB
Purged disk usage: (1.5 TB SGTs + 120 GB mesh + 1.5 TB reformatted SGTs)/site x 143 sites + (27 GB/site seismograms + 0.2 GB/site PSA + 0.2 GB/site RotD) x 286 sites = 453 TB
SCEC
Archival disk usage: 7.5 TB seismograms + 0.1 TB PSA files + 0.1 TB RotD files on scec-04 (has 171 TB free) & 24 GB curves, disaggregations, reports, etc. on scec-00 (171 TB free)
Database usage: (5 rows PSA + 7 rows RotD)/rupture variation x 450K rupture variations/site x 286 sites = 1.5 billion rows x 151 bytes/row = 227 GB (4.3 TB free on focal.usc.edu disk)
Temporary disk usage: 515 GB workflow logs. scec-02 has 171 TB free.
Performance Metrics
At 8:20 pm PDT on launch day, 102,585,945 SUs available on Titan. 831,995 used in April under username callag.
At 8:30 pm PDT on launch day, 257975.45 node-hours burned under scottcal on Blue Waters. 48571 jobs launched under the project on Blue Waters summary page.
After the runs completed:
- Blue Waters reports 900,487.36 node-hours burned under user scottcal. 52493 jobs launched under the project on the Blue Waters summary page. In early August, Blue Waters reports 913,596 node-hours burned under scottcal, with nothing after late May. From 4/17 to 5/15, Blue Waters had a discount (50%) charging period in effect.
- Titan reports 81,720,256 SUs available, with 8,482,872 used in April and 14,337,692 used in May across the project. User callag used 5,167,198 in April and 8,515,302 in May.
Reservations
We launched 2 XK reservations on Blue Waters for 852 nodes each starting at 9 pm PDT on April 17th, and 2 XE reservations for 564 nodes each starting on 10 pm PDT on April 17th. Due to XK jobs having slower throughput than we expected, blocking the XE jobs, and Titan SGTs slowing down greatly, we gave back one of the XE reservations at 8:50 am PDT on April 18th.
In preparation for downtimes, we stopped submitting new workflows at 9:03 pm PDT on April 19th.
A set of jobs resumed on Blue Waters when it came back on April 20th; not sure why, since SCEC disks were still down. This burned an additional 19560 XE node-hours not recorded by the cronjob.
We resumed SGT calculations on Titan at 12:59 pm PDT on April 24th, and PP calculations at 4:34 pm PDT on April 24th.
We had Blue Waters reservations on the XK nodes from 4 pm on April 25th and on the XE nodes from 5 pm on April 25th until 2:30 pm on April 26th.
The Blue Waters certificate expired on April 27th at 12 pm PDT. The XSEDE cert expired on April 26th at 7 pm PDT. We turned off Condor on shock at 8 pm PDT on April 27th.
We turned Condor back on at 2:10 pm PDT on May 5th.
A reservation for 848 XK nodes on Blue Waters resumed at 12 pm PDT on May 7th, 564 XE nodes at 6 pm PDT on May 7th, and another 564 XE nodes at 7 pm.
We got another 848 XK nodes on May 16th at 8 am.
After the May 18 downtime (started at 4 am PDT), a reservation for 1128 XE nodes resumed at 9 am PDT on May 19th, and 1700 XK nodes at 8 am PDT on May 19th. We gave the XK reservations back at 6:30 pm PDT on May 20th.
I released 568 XE nodes at 2:42 pm PDT on May 21st. The other 560 XE nodes were released at 1 pm PDT on May 22nd.
Application-level Metrics
- Makespan: 914.2 hours
- Uptime (not including downtimes): 731.4 hours (87.9 overlapping, 88.9 SCEC downtime, 6 resource)
Note: Uptime is what is used when calculating the averages for jobs, nodes, etc.
- 336 sites
- 336 pairs of SGTs
- 131 generated on Titan (39%), 202 generated on Blue Waters (60%), 3 run on both sites for verification (1%)
- 4372 jobs submitted
- On average, 10.8 jobs running, with a max of 58
- 1.38M node hours used (37.6M core hours)
- 4.1K node-hrs per site (111.9K core-hrs)
- Average of 1962 nodes used, with a max of 17986
- Delay per job (using a 14-day, no restarts cutoff: 287 workflows, 5052 jobs) was mean: 4145 sec, median: 0.000000, min: 0.000000, max: 214910.000000, sd: 17758.094777
- Application parallel node speedup (node-hours divided by makespan) was 1510x. (Divided by uptime: 1887x)
- Application parallel workflow speedup (number of workflows times average workflow makespan divided by application makespan) was <?>x. (Divided by uptime: <?>x)
Blue Waters
- Wallclock time: 914.2 hours
- Uptime (not including downtimes): 641.6 hours (239.8 SCEC downtime, 32.8 Blue Waters downtime). 688.75 hrs used to calculate all the following averages (that's wallclock time minus <gaps of more than 1 hour in the logs> minus <downtimes of more than 12 hours>).
- 205 sites
- 3933 jobs submitted to the Blue Waters queue (based on Blue Waters jobs report)
- Running jobs: average 10.8, max of 58
- On average, 10.2 XE jobs running, with a max of 57
- On average, 0.7 XK jobs running, with a max of 3
- Idle jobs: average 13.6, max of 53
- On average, 2.6 XE jobs idle, with a max of 49
- On average, 11.1 XK jobs idle, with a max of 40
- Nodes: average 1346 (43072 cores), max 5351 (171232 cores, 20% of Blue Waters)
- On average, 795 XE nodes used, max 38957
- On average, 551 XK nodes used, max 2400
- Based on the Blue Waters jobs report, 955,900 node-hours used (24.7M core-hrs), but 648,577 node-hours (16.9M core-hrs) charged (50% charging period in effect from 4/17 to 5/15).
- XE: 589,568 node-hours (18.9M core-hrs) used, but 410,774 node-hours (13.1M core-hrs) charged
- XK: 366,331 node-hours (5.86M core-hrs) used, but 237,802 node-hours (3.80M core-hrs) charged
- Delay per job:
Titan
- Wallclock time: 896.2 hrs (from 10:44 PDT on 4/16/15 to 18:58 PDT on 5/23/15)
- Uptime (not including downtimes): 637.1 hours (110.5 overlapping, 142.1 SCEC downtime, 6.5 Titan downtime). 637.2 hrs used to calculate all the following averages (that's wallclock time minus <gaps of more than 1 hour in the logs> minus <downtimes of more than 12 hours>).
- 134 sites
Titan pilot jobs were initially submitted to run 1 site at a time. This was increased to 5 sites at a time, then back down to 3 sites when waiting for the 5-site GPU jobs was taking too long.
- 439 pilot jobs run on Titan (91% automatic) (based on Titan pilot logs):
- 128 PreSGT jobs (119 automatic, 9 manual) (150 nodes/site, 2:00)
- 103 SGT jobs (97 automatic, 6 manual) (800 nodes/site, 1:15)
- 108 PostSGT jobs (92 automatic, 16 manual) (8 nodes/site, 2:00)
- 100 MD5 jobs (91 automatic, 9 manual) (2 nodes/site, 2:00)
- Running jobs: average 0.8, max of 10
- Idle jobs: average 23.6, max of 65
- Nodes: average 766 (12256 cores), max 14874 (237984 cores, 79.6% of Titan)
- Based on the Titan portal, 12.9M SUs used (428,350 node-hours).
- Delay per job:
The Titan pilot job submission daemon was down from 5/7 8:50 EDT to 5/9 23:47 EDT, so we had to reconstruct its contents from the pilot job output files.
Workflow-level Metrics
In calculating the workflow metrics, we used much longer cutoff times than for past studies. Between the downtimes and the sometimes extended queue times on Titan for the large jobs,
- The average runtime of a workflow (1-day cutoff, workflows with retries ignored, so <?> workflows considered) was <?> sec, with median: <?>, min: <?>, max: <?>, sd: <?>.
- If the cutoff is expanded to 2 days (<?> workflows), mean: <?> sec, median: <?>, min: <?>, max: <?>, sd: <?>
- If the cutoff is expanded to 7 days (<?> workflows), mean: <?>, median: <?>, min: <?>, max: <?>, sd: <?>
- On average, each workflow was executed <?> times, with median: <?>, min: <?>, max: <?>, sd: <?>.
With the 1-day cutoff, no retries (<?> workflows, since <?> had retries and <?> ran longer than a day):
   Workflow parallel core speedup was mean: <?>, median: <?>, min: <?>, max: <?>, sd: <?>
   Workflow parallel node speedup was mean: <?>, median: <?>, min: <?>, max: <?>, sd: <?>
Job-level Metrics
We can get job-level metrics from two sources: pegasus-statistics, and parsing the workflow logs ourselves, each of which provides slightly different info. The pegasus-statistics include failed jobs and failed workflows; the parser omits workflows which failed or took over the cutoff time.
First, the pegasus-statistics results. The Min/Max/Mean/Total columns refer to the product of the walltime and the pegasus_cores value. Note that this is not directly comparable to the SUs burned, because pegasus_cores was inconsistently used between jobs. pegasus_cores was set to 1 for all jobs except those indicated by asterisks.
| Transformation | Count | Succeeded | Failed | Min (sec) | Max (sec) | Mean (sec) | Total (cores x seconds) |
|---|---|---|---|---|---|---|---|
| condor::dagman | 1880 | 1664 | 216 | 0.0 | 716740.0 | 42898.241 | 80648694.0 |
| dagman::post | 19401 | 17928 | 1473 | 0.0 | 7680.0 | 131.221 | 2545819.0 |
| dagman::pre | 2106 | 2103 | 3 | 1.0 | 29.0 | 4.875 | 10266.0 |
| pegasus::cleanup | 792 | 792 | 0 | 0.0 | 1485.014 | 7.037 | 5573.477 |
| pegasus::dirmanager | 4550 | 3895 | 655 | 0.0 | 120.102 | 2.102 | 9565.689 |
| pegasus::rc-client | 832 | 832 | 0 | 0.0 | 2396.492 | 351.024 | 292051.758 |
| pegasus::transfer | 3441 | 3148 | 293 | 2.081 | 108143.149 | 2521.042 | 8674907.163 |
| Supporting Jobs Total | 33002 | 30362 | 2640 | 92186877.09 | |||
| scec::AWP_GPU:1.0 | 589 | 584 | 5 | 141279.2** | 3448800.0** | 2678443.675** | 1577603324.8** |
| scec::AWP_NaN_Check:1.0 | 600 | 573 | 27 | 178.0 | 6897.751 | 2684.849 | 1610909.506 |
| scec::CheckSgt:1.0 | 668 | 665 | 3 | 0.0 | 17643.0 | 5314.316 | 3549963.002 |
| scec::Check_DB_Site:1.0 | 334 | 334 | 0 | 23.85 | 395.623 | 62.815 | 20980.172 |
| scec::Curve_Calc:1.0 | 689 | 668 | 21 | 10.972 | 1341.022 | 281.396 | 193881.757 |
| scec::CyberShakeNotify:1.0 | 334 | 334 | 0 | 0.077 | 1.012 | 0.109 | 36.496 |
| scec::DB_Report:1.0 | 334 | 334 | 0 | 45.659 | 446.955 | 125.408 | 41886.193 |
| scec::DirectSynth:1.0 | 386 | 344 | 42 | 0.0 | 58374.0 | 38018.853 | 14675277.374 |
| scec::Disaggregate:1.0 | 334 | 334 | 0 | 42.917 | 369.146 | 71.298 | 23813.435 |
| scec::Extract_SGT_MPI_AWP:3.3.1 | 1 | 1 | 0 | 41169408.0 | 41169408.0 | 41169408.0 | 41169408.0 |
| scec::GenSGTDax:1.0 | 374 | 337 | 37 | 0.0 | 157.129 | 5.301 | 1982.47 |
| scec::Load_Amps:1.0 | 828 | 666 | 162 | 2.123 | 10447.952 | 1185.514 | 981605.742 |
| scec::MD5:1.0 | 172 | 172 | 0 | 2751.726 | 4760.514 | 4083.862 | 702424.245 |
| scec::PostAWP:1.0 | 571 | 571 | 0 | 1343.078 | 12220.471 | 4929.117 | 2814525.678 |
| scec::PreAWP_GPU:1.0 | 395 | 352 | 43 | 0.11 | 2195.0 | 916.988 | 362210.077 |
| scec::PreCVM:1.0 | 363 | 350 | 13 | 0.0 | 1340.0 | 346.043 | 125613.482 |
| scec::PreSGT:1.0 | 349 | 346 | 3 | 0.0* | 70944.0* | 10111.668* | 3528972.251* |
| scec::SetJobID:1.0 | 334 | 334 | 0 | 0.073 | 159.28 | 0.705 | 235.571 |
| scec::SetPPHost:1.0 | 302 | 302 | 0 | 0.064 | 9.834 | 0.113 | 34.061 |
| scec::UCVMMesh:1.0 | 355 | 354 | 1 | 0.0 | 5062.164 | 561.507 | 199334.887 |
| scec::UpdateRun:1.0 | 1474 | 1426 | 48 | 0.0 | 227.526 | 1.022 | 1505.962 |
| Workflow Jobs Total | 9786 | 9381 | 405 (4.1%) | 1647607925 |
- These values had pegasus_cores inconsistently applied: 1 for some workflows, 32 for others.
- These values include pegasus_cores=800.
Presentations and Papers
Production Checklist
Preparation for production runs
Check list of Mayssa's concernsUpdate DAX to support separate MD5 sumsAdd MD5 sum job to TCEvaluate topology-aware schedulingGet DirectSynth working at full run scale, verify resultsModify workflow to have md5sums be in parallelTest of 1 Hz simulation with 2 Hz source - 2/27Add a third pilot job type to Titan pilots - 2/27Run test of full 1 Hz SGT workflow on Blue Waters - 3/4Add cleanup to workflow and test - 3/4Test interface between Titan workflows and Blue Waters workflows - 3/4Add capability to have files on Blue Waters correctly striped - 3/6Add restart capability to DirectSynth - 3/6File ticket for extended walltime for small jobs on Titan - 3/6Add DirectSynth to workflow tools - 3/6Implement and test parallel version of reformat_awp - 3/6Set up usage monitoring on Blue Waters and TitanAdd ability to determine if SGTs are being run on Blue Waters or TitanModify auto-submit system to distinguish between full runs and PP runsScience readiness review - 3/18Technical readiness review - 3/18Create study description file for Run Manager - 3/13- Simulate curves for 3 sites with final configuration; compare curves and seismograms
- File ticket for 90-day purged space at Blue Waters
- Tag code on shock, Blue Waters, Titan
- Request reservation at Blue Waters
Follow up on high priority jobs at TitanMake changes to technical review slidesUpgrade UCVM on Blue Waters to match Titan versionEvaluate using a single workflow rather than split workflows
