Difference between revisions of "CyberShake Study 18.8 Data Products"
From SCECpedia
Jump to navigationJump to search| Line 1: | Line 1: | ||
Below are some selected data products from Study 18.8. | Below are some selected data products from Study 18.8. | ||
| + | |||
| + | == Selected Sites == | ||
| + | |||
| + | We have selected the following 9 sites for closer comparison: | ||
| + | |||
| + | {| | ||
| + | ! Long Name !! Short Name !! Lat !! Lon | ||
| + | |- | ||
| + | | San Francisco - Rincon Hill || SFRH || 37.786 || -122.391 | ||
| + | |- | ||
| + | | Oakland - Fire Station 23 || OKFS || 37.7696 || -122.1734 | ||
| + | |- | ||
| + | | Sacramento || SAC || 38.581573 || -121.4944 | ||
| + | |- | ||
| + | | Livermore || LVMR || 37.681873 || -121.768005 | ||
| + | |- | ||
| + | | Santa Rosa || SRSA || 38.440468 || -122.71443 | ||
| + | |- | ||
| + | | San Jose || SJO || 37.339386 || -121.89496 | ||
| + | |- | ||
| + | | Hayward || HAYW || 37.679 || -122.082 | ||
| + | |- | ||
| + | | Yerba Buena || CYB || 37.807873 || -122.3618 | ||
| + | |- | ||
| + | | Napa || NAPA || 38.29754 || -122.286865 | ||
| + | |} | ||
== Hazard Curves == | == Hazard Curves == | ||
| Line 8: | Line 34: | ||
! Site !! 2 sec !! 3 sec !! 5 sec !! 10 sec | ! Site !! 2 sec !! 3 sec !! 5 sec !! 10 sec | ||
|- | |- | ||
| − | ! | + | ! SFRH |
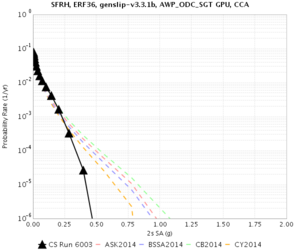
| [[File:Study_18_8_SFRH_2sec_RotD50.png|thumb|300px|SFRH, 2 sec RotD50]] | | [[File:Study_18_8_SFRH_2sec_RotD50.png|thumb|300px|SFRH, 2 sec RotD50]] | ||
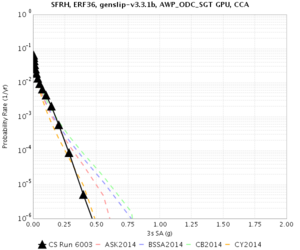
| [[File:Study_18_8_SFRH_3sec_RotD50.png|thumb|300px|SFRH, 3 sec RotD50]] | | [[File:Study_18_8_SFRH_3sec_RotD50.png|thumb|300px|SFRH, 3 sec RotD50]] | ||
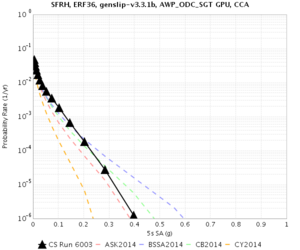
| Line 14: | Line 40: | ||
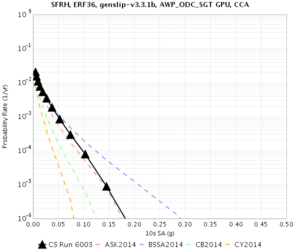
| [[File:Study_18_8_SFRH_10sec_RotD50.png|thumb|300px|SFRH, 10 sec RotD50]] | | [[File:Study_18_8_SFRH_10sec_RotD50.png|thumb|300px|SFRH, 10 sec RotD50]] | ||
|- | |- | ||
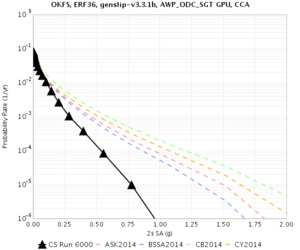
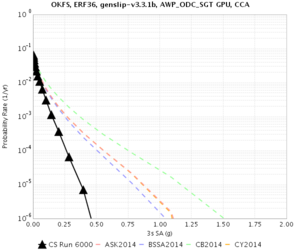
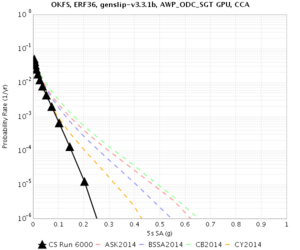
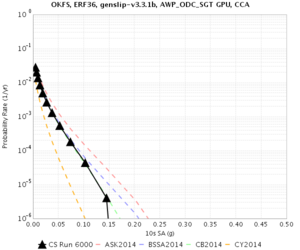
| − | ! | + | ! OKFS |
| [[File:Study_18_8_OKFS_2sec_RotD50.png|thumb|300px|OKFS, 2 sec RotD50]] | | [[File:Study_18_8_OKFS_2sec_RotD50.png|thumb|300px|OKFS, 2 sec RotD50]] | ||
| [[File:Study_18_8_OKFS_3sec_RotD50.png|thumb|300px|OKFS, 3 sec RotD50]] | | [[File:Study_18_8_OKFS_3sec_RotD50.png|thumb|300px|OKFS, 3 sec RotD50]] | ||
| Line 20: | Line 46: | ||
| [[File:Study_18_8_OKFS_10sec_RotD50.png|thumb|300px|OKFS, 10 sec RotD50]] | | [[File:Study_18_8_OKFS_10sec_RotD50.png|thumb|300px|OKFS, 10 sec RotD50]] | ||
|- | |- | ||
| − | ! | + | ! SAC |
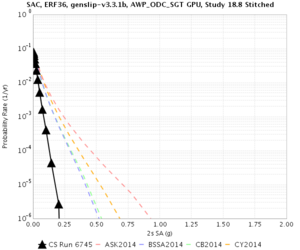
| [[File:Study_18_8_SAC_2sec_RotD50.png|thumb|300px|SAC, 2 sec RotD50]] | | [[File:Study_18_8_SAC_2sec_RotD50.png|thumb|300px|SAC, 2 sec RotD50]] | ||
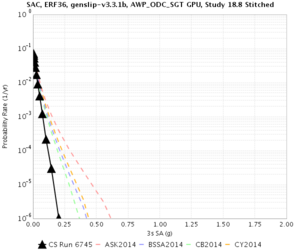
| [[File:Study_18_8_SAC_3sec_RotD50.png|thumb|300px|SAC, 3 sec RotD50]] | | [[File:Study_18_8_SAC_3sec_RotD50.png|thumb|300px|SAC, 3 sec RotD50]] | ||
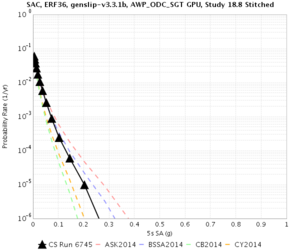
| Line 26: | Line 52: | ||
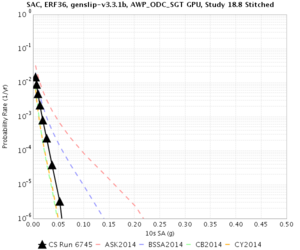
| [[File:Study_18_8_SAC_10sec_RotD50.png|thumb|300px|SAC, 10 sec RotD50]] | | [[File:Study_18_8_SAC_10sec_RotD50.png|thumb|300px|SAC, 10 sec RotD50]] | ||
|- | |- | ||
| − | ! | + | ! LVMR |
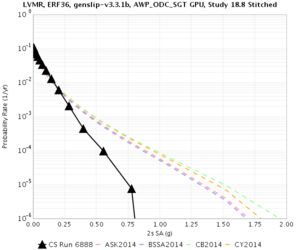
| [[File:Study_18_8_LVMR_2sec_RotD50.png|thumb|300px|LVMR, 2 sec RotD50]] | | [[File:Study_18_8_LVMR_2sec_RotD50.png|thumb|300px|LVMR, 2 sec RotD50]] | ||
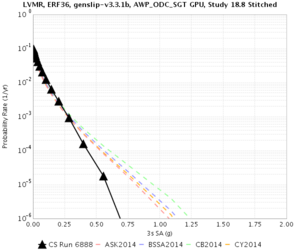
| [[File:Study_18_8_LVMR_3sec_RotD50.png|thumb|300px|LVMR, 3 sec RotD50]] | | [[File:Study_18_8_LVMR_3sec_RotD50.png|thumb|300px|LVMR, 3 sec RotD50]] | ||
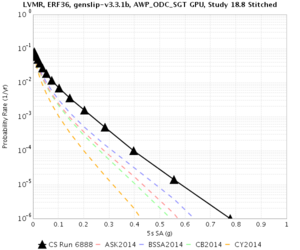
| Line 32: | Line 58: | ||
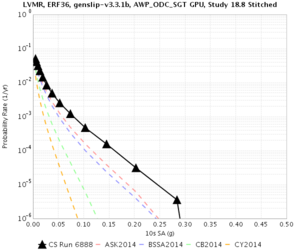
| [[File:Study_18_8_LVMR_10sec_RotD50.png|thumb|300px|LVMR, 10 sec RotD50]] | | [[File:Study_18_8_LVMR_10sec_RotD50.png|thumb|300px|LVMR, 10 sec RotD50]] | ||
|- | |- | ||
| − | ! | + | ! SRSA |
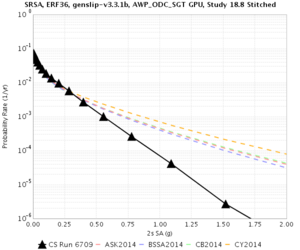
| [[File:Study_18_8_SRSA_2sec_RotD50.png|thumb|300px|SRSA, 2 sec RotD50]] | | [[File:Study_18_8_SRSA_2sec_RotD50.png|thumb|300px|SRSA, 2 sec RotD50]] | ||
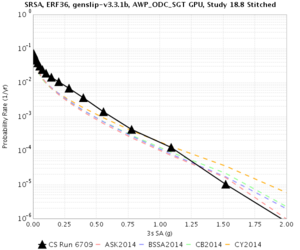
| [[File:Study_18_8_SRSA_3sec_RotD50.png|thumb|300px|SRSA, 3 sec RotD50]] | | [[File:Study_18_8_SRSA_3sec_RotD50.png|thumb|300px|SRSA, 3 sec RotD50]] | ||
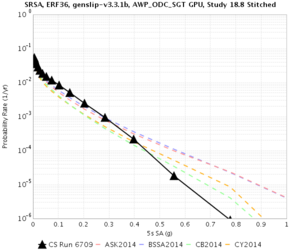
| Line 38: | Line 64: | ||
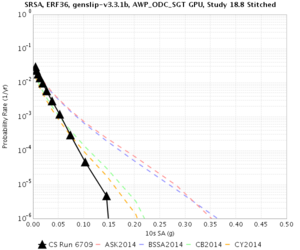
| [[File:Study_18_8_SRSA_10sec_RotD50.png|thumb|300px|SRSA, 10 sec RotD50]] | | [[File:Study_18_8_SRSA_10sec_RotD50.png|thumb|300px|SRSA, 10 sec RotD50]] | ||
|- | |- | ||
| − | ! | + | ! SJO |
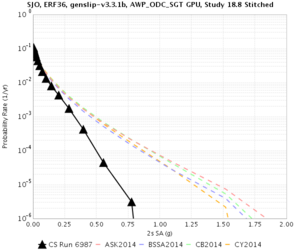
| [[File:Study_18_8_SJO_2sec_RotD50.png|thumb|300px|SJO, 2 sec RotD50]] | | [[File:Study_18_8_SJO_2sec_RotD50.png|thumb|300px|SJO, 2 sec RotD50]] | ||
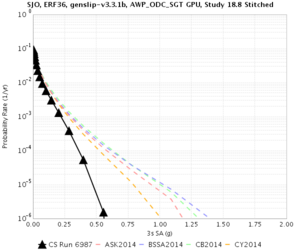
| [[File:Study_18_8_SJO_3sec_RotD50.png|thumb|300px|SJO, 3 sec RotD50]] | | [[File:Study_18_8_SJO_3sec_RotD50.png|thumb|300px|SJO, 3 sec RotD50]] | ||
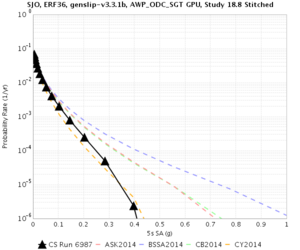
| Line 44: | Line 70: | ||
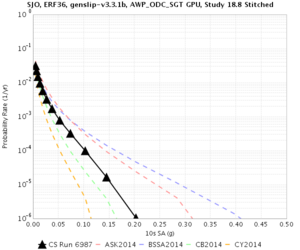
| [[File:Study_18_8_SJO_10sec_RotD50.png|thumb|300px|SJO, 10 sec RotD50]] | | [[File:Study_18_8_SJO_10sec_RotD50.png|thumb|300px|SJO, 10 sec RotD50]] | ||
|- | |- | ||
| − | ! | + | ! HAYW |
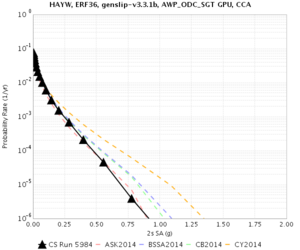
| [[File:Study_18_8_HAYW_2sec_RotD50.png|thumb|300px|HAYW, 2 sec RotD50]] | | [[File:Study_18_8_HAYW_2sec_RotD50.png|thumb|300px|HAYW, 2 sec RotD50]] | ||
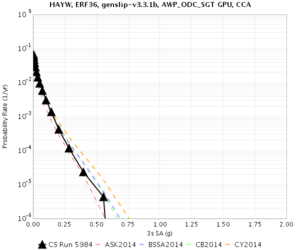
| [[File:Study_18_8_HAYW_3sec_RotD50.png|thumb|300px|HAYW, 3 sec RotD50]] | | [[File:Study_18_8_HAYW_3sec_RotD50.png|thumb|300px|HAYW, 3 sec RotD50]] | ||
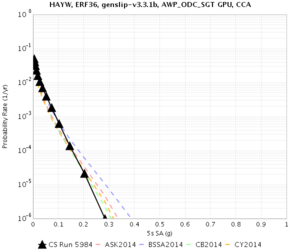
| Line 50: | Line 76: | ||
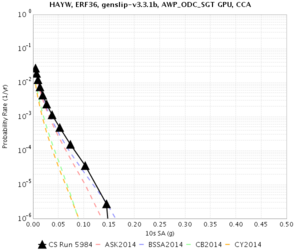
| [[File:Study_18_8_HAYW_10sec_RotD50.png|thumb|300px|HAYW, 10 sec RotD50]] | | [[File:Study_18_8_HAYW_10sec_RotD50.png|thumb|300px|HAYW, 10 sec RotD50]] | ||
|- | |- | ||
| − | ! | + | ! CYB |
| [[File:Study_18_8_CYB_2sec_RotD50.png|thumb|300px|CYB, 2 sec RotD50]] | | [[File:Study_18_8_CYB_2sec_RotD50.png|thumb|300px|CYB, 2 sec RotD50]] | ||
| [[File:Study_18_8_CYB_3sec_RotD50.png|thumb|300px|CYB, 3 sec RotD50]] | | [[File:Study_18_8_CYB_3sec_RotD50.png|thumb|300px|CYB, 3 sec RotD50]] | ||
| Line 56: | Line 82: | ||
| [[File:Study_18_8_CYB_10sec_RotD50.png|thumb|300px|CYB, 10 sec RotD50]] | | [[File:Study_18_8_CYB_10sec_RotD50.png|thumb|300px|CYB, 10 sec RotD50]] | ||
|- | |- | ||
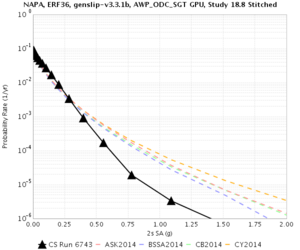
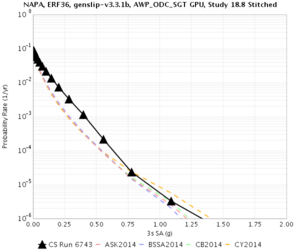
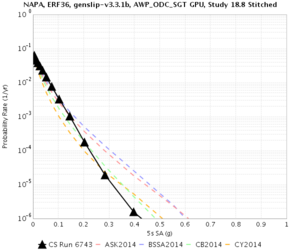
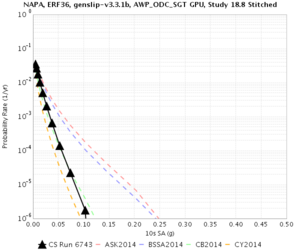
| − | ! | + | ! NAPA |
| [[File:Study_18_8_NAPA_2sec_RotD50.png|thumb|300px|NAPA, 2 sec RotD50]] | | [[File:Study_18_8_NAPA_2sec_RotD50.png|thumb|300px|NAPA, 2 sec RotD50]] | ||
| [[File:Study_18_8_NAPA_3sec_RotD50.png|thumb|300px|NAPA, 3 sec RotD50]] | | [[File:Study_18_8_NAPA_3sec_RotD50.png|thumb|300px|NAPA, 3 sec RotD50]] | ||
| Line 63: | Line 89: | ||
|} | |} | ||
| + | |||
| + | == Disaggregation == | ||
| + | |||
| + | == Velocity profiles == | ||
| + | |||
| + | == Overlapping sites == | ||
| + | |||
| + | === Hazard Curves ==== | ||
| + | |||
| + | === Waveforms === | ||
Revision as of 17:52, 12 April 2019
Below are some selected data products from Study 18.8.
Contents
Selected Sites
We have selected the following 9 sites for closer comparison:
| Long Name | Short Name | Lat | Lon |
|---|---|---|---|
| San Francisco - Rincon Hill | SFRH | 37.786 | -122.391 |
| Oakland - Fire Station 23 | OKFS | 37.7696 | -122.1734 |
| Sacramento | SAC | 38.581573 | -121.4944 |
| Livermore | LVMR | 37.681873 | -121.768005 |
| Santa Rosa | SRSA | 38.440468 | -122.71443 |
| San Jose | SJO | 37.339386 | -121.89496 |
| Hayward | HAYW | 37.679 | -122.082 |
| Yerba Buena | CYB | 37.807873 | -122.3618 |
| Napa | NAPA | 38.29754 | -122.286865 |
Hazard Curves
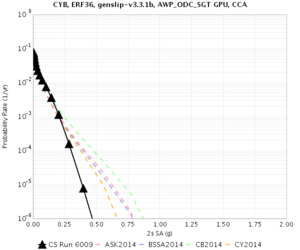
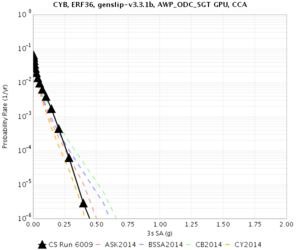
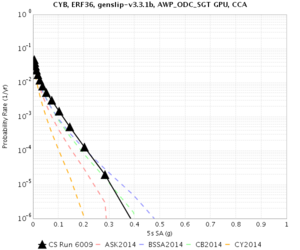
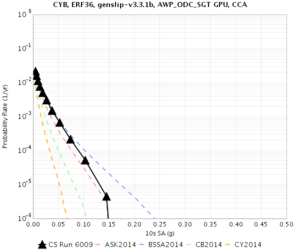
Following are hazard curves for a selected subset of sites.
| Site | 2 sec | 3 sec | 5 sec | 10 sec |
|---|---|---|---|---|
| SFRH | ||||
| OKFS | ||||
| SAC | ||||
| LVMR | ||||
| SRSA | ||||
| SJO | ||||
| HAYW | ||||
| CYB | ||||
| NAPA |
