Difference between revisions of "CyberShake Study 18.8 Data Products"

From SCECpedia
Jump to navigationJump to search
Line 414: Line 414:
 
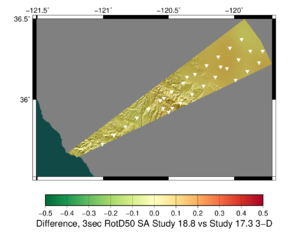
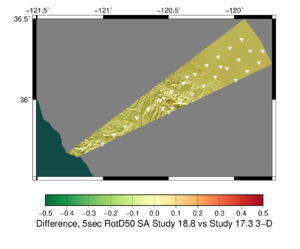
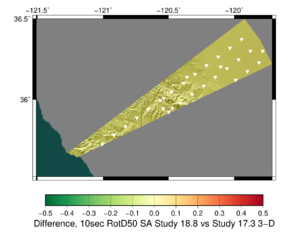
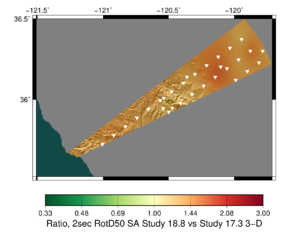
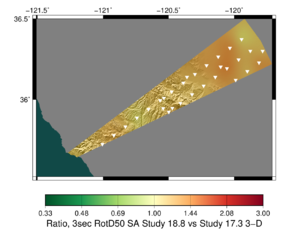
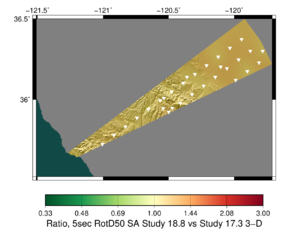
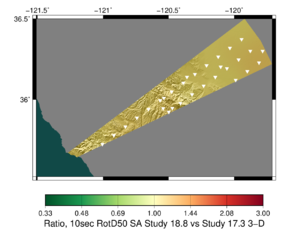
32 sites were used in both Study 18.8 and Study 17.3.  Below are difference and ratio maps for this region between the two studies.
 
32 sites were used in both Study 18.8 and Study 17.3.  Below are difference and ratio maps for this region between the two studies.
  
+
{|
 +
! Map Type !! 2 sec !! 3 sec !! 5 sec !! 10 sec
 +
|-
 +
! Diff (18.8 - 17.3)
 +
| [[File:diff_18_8_17_3_2sec.png|thumb|300px|Difference plot, Study 18.8 - Study 17.3 3D, 2 sec RotD50]]
 +
| [[File:diff_18_8_17_3_3sec.png|thumb|300px|Difference plot, Study 18.8 - Study 17.3 3D, 3 sec RotD50]]
 +
| [[File:diff_18_8_17_3_5sec.png|thumb|300px|Difference plot, Study 18.8 - Study 17.3 3D, 5 sec RotD50]]
 +
| [[File:diff_18_8_17_3_10sec.png|thumb|300px|Difference plot, Study 18.8 - Study 17.3 3D, 10 sec RotD50]]
 +
|-
 +
! Ratio (18.8/17.3)
 +
| [[File:ratio_18_8_17_3_2sec.png|thumb|300px|Ratio plot, Study 18.8 - Study 17.3 3D, 2 sec RotD50]]
 +
| [[File:ratio_18_8_17_3_3sec.png|thumb|300px|Ratio plot, Study 18.8 - Study 17.3 3D, 3 sec RotD50]]
 +
| [[File:ratio_18_8_17_3_5sec.png|thumb|300px|Ratio plot, Study 18.8 - Study 17.3 3D, 5 sec RotD50]]
 +
| [[File:ratio_18_8_17_3_10sec.png|thumb|300px|Ratio plot, Study 18.8 - Study 17.3 3D, 10 sec RotD50]]
 +
|}
 +
 
 +
Higher-res versions are available [https://github.com/kevinmilner/cybershake-analysis/tree/master/study_18_8/multi_study_hazard_maps/resources here].
  
 
=== Hazard Curves ===
 
=== Hazard Curves ===
  
 
=== Waveforms ===
 
=== Waveforms ===

Revision as of 13:22, 14 May 2019

Below are some selected data products from Study 18.8.

Selected Sites

We have selected the following 9 sites for closer comparison:

Long Name Short Name Lat Lon Run ID
San Francisco - Rincon Hill SFRH 37.786 -122.391 6003
Oakland - Fire Station 23 OKFS 37.7696 -122.1734 6000
Sacramento SAC 38.581573 -121.4944 6745
Livermore LVMR 37.681873 -121.768005 6888
Santa Rosa SRSA 38.440468 -122.71443 6709
San Jose SJO 37.339386 -121.89496 6987
Hayward HAYW 37.679 -122.082 5984
Yerba Buena CYB 37.807873 -122.3618 6009
Napa NAPA 38.29754 -122.286865 6743

Hazard Curves

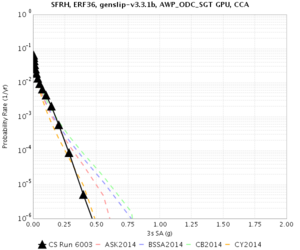
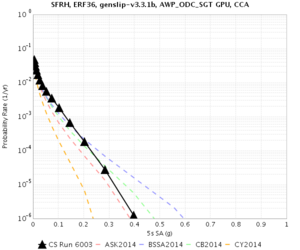
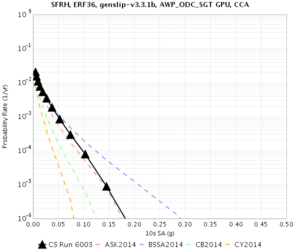
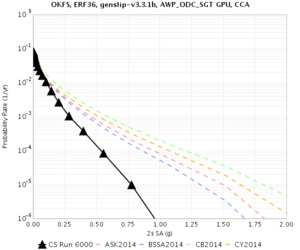
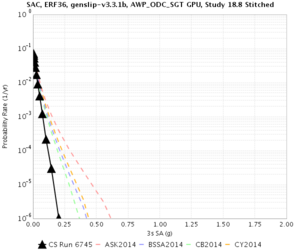
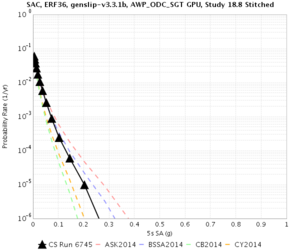
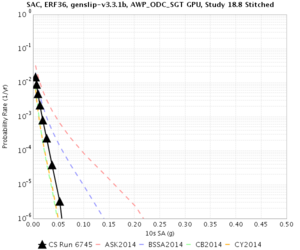
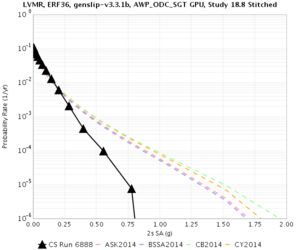
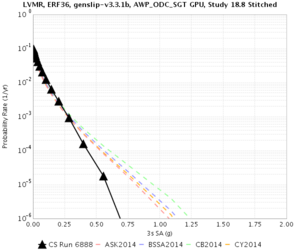
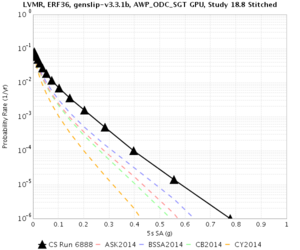
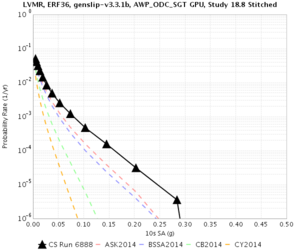
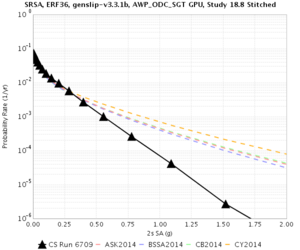
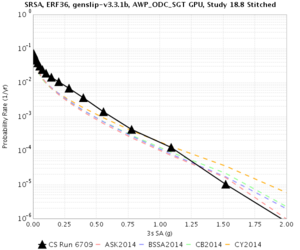
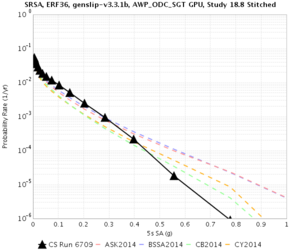
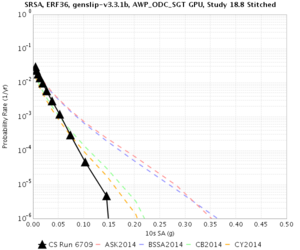
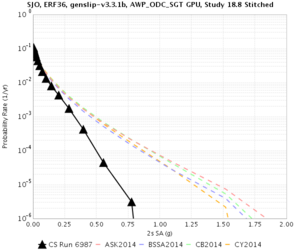
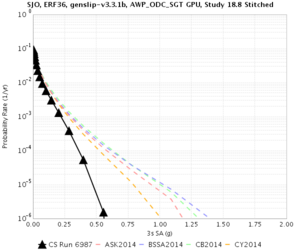
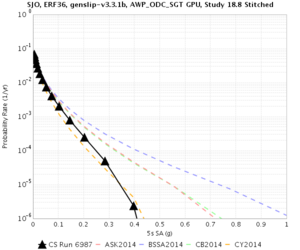
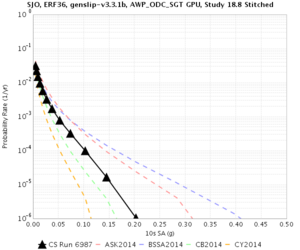
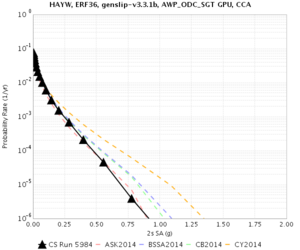
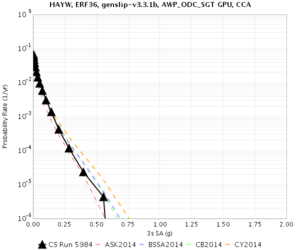
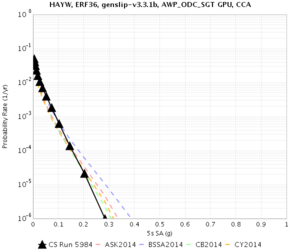
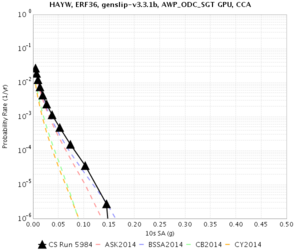
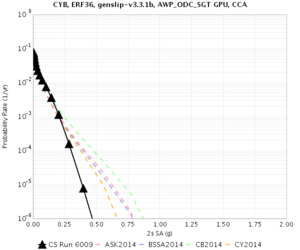
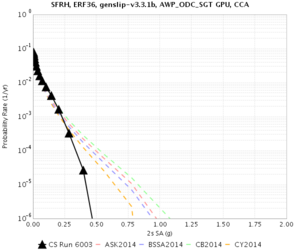
Following are hazard curves for a selected subset of sites.

Site 2 sec 3 sec 5 sec 10 sec
SFRH
SFRH, 2 sec RotD50
SFRH, 3 sec RotD50
SFRH, 5 sec RotD50
SFRH, 10 sec RotD50
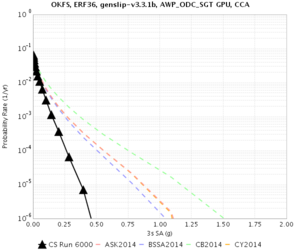
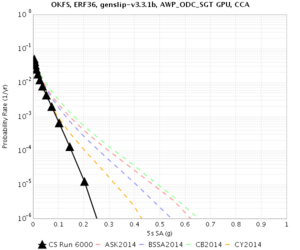
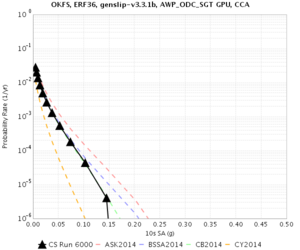
OKFS
OKFS, 2 sec RotD50
OKFS, 3 sec RotD50
OKFS, 5 sec RotD50
OKFS, 10 sec RotD50
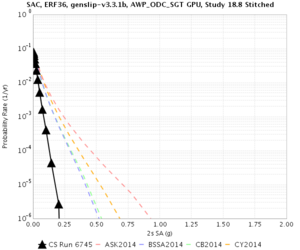
SAC
SAC, 2 sec RotD50
SAC, 3 sec RotD50
SAC, 5 sec RotD50
SAC, 10 sec RotD50
LVMR
LVMR, 2 sec RotD50
LVMR, 3 sec RotD50
LVMR, 5 sec RotD50
LVMR, 10 sec RotD50
SRSA
SRSA, 2 sec RotD50
SRSA, 3 sec RotD50
SRSA, 5 sec RotD50
SRSA, 10 sec RotD50
SJO
SJO, 2 sec RotD50
SJO, 3 sec RotD50
SJO, 5 sec RotD50
SJO, 10 sec RotD50
HAYW
HAYW, 2 sec RotD50
HAYW, 3 sec RotD50
HAYW, 5 sec RotD50
HAYW, 10 sec RotD50
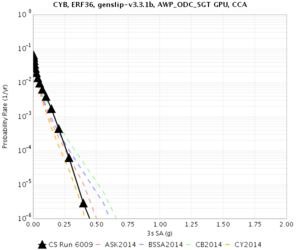
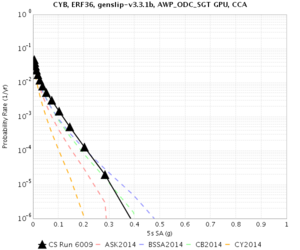
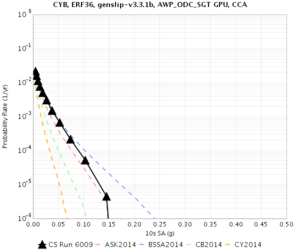
CYB
CYB, 2 sec RotD50
CYB, 3 sec RotD50
CYB, 5 sec RotD50
CYB, 10 sec RotD50
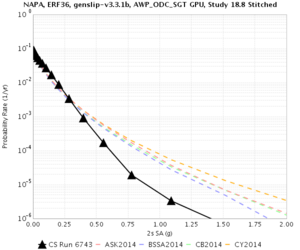
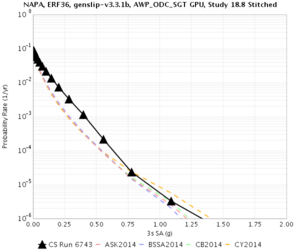
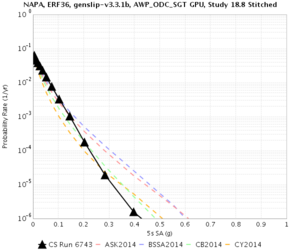
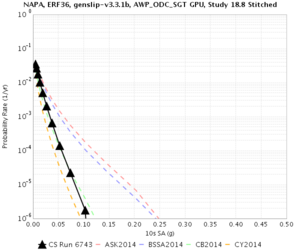
NAPA
NAPA, 2 sec RotD50
NAPA, 3 sec RotD50
NAPA, 5 sec RotD50
NAPA, 10 sec RotD50

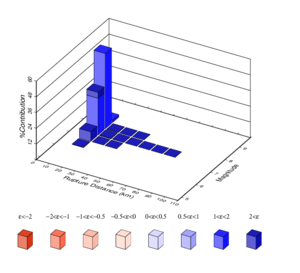
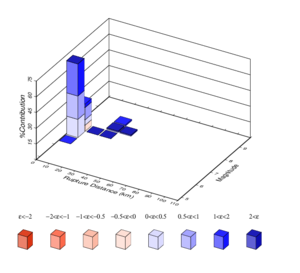
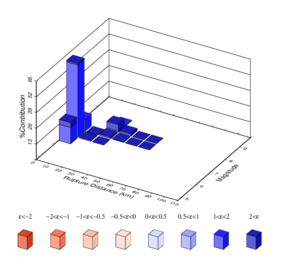
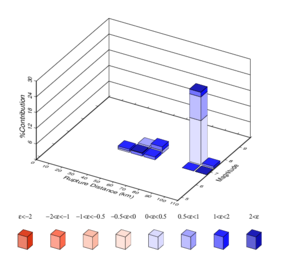
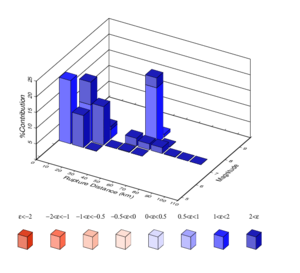
Disaggregation

Site Top 5 CyberShake contributors CyberShake Plot Top 5 ASK contributors ASK Plot
SFRH
Source Percent Name
000039 57.07 N. San Andreas;SAO+SAN+SAP+SAS
000037 22.81 N. San Andreas;SAO+SAN
000041 10.91 N. San Andreas;SAP+SAS
000256 03.20 San Gregorio Connected
000127 03.05 N. San Andreas
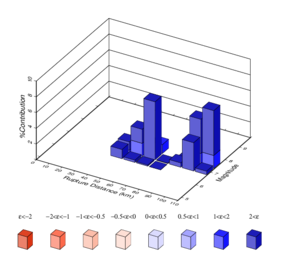
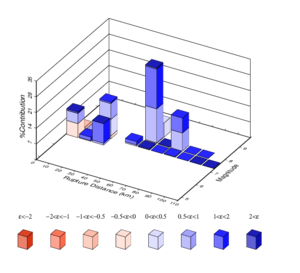
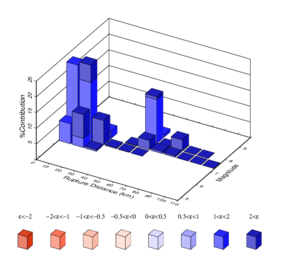
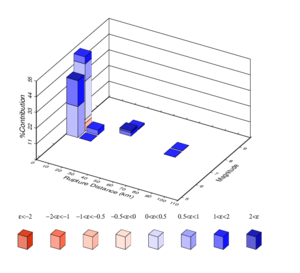
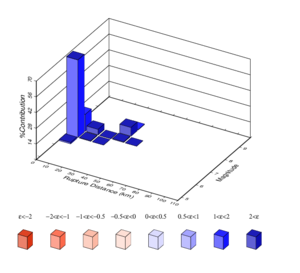
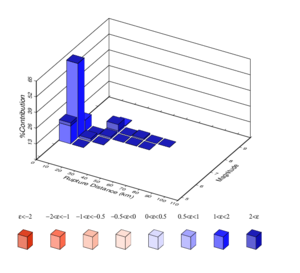
SFRH, CyberShake disaggregation at 3 sec RotD50
Source Percent Name
000039 34.88 N. San Andreas;SAO+SAN+SAP+SAS
000037 22.22 N. San Andreas;SAO+SAN
000041 17.04 N. San Andreas;SAP+SAS
000127 07.98 N. San Andreas
000256 05.79 San Gregorio Connected
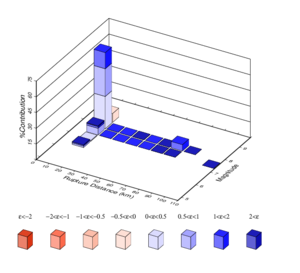
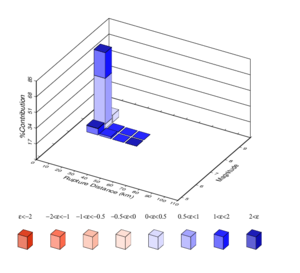
SFRH, ASK disaggregation at 3 sec RotD50
OKFS
Source Percent Name
000028 34.20 Hayward-Rodgers Creek;HN+HS
000029 23.71 Hayward-Rodgers Creek;HS
000126 19.70 Hayward-Rodgers Creek
000032 14.33 Hayward-Rodgers Creek;RC+HN+HS
000031 04.52 Hayward-Rodgers Creek;RC+HN
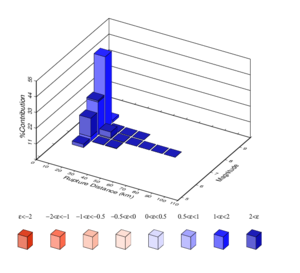
OKFS, CyberShake disaggregation at 3 sec RotD50
Source Percent Name
000028 33.23 Hayward-Rodgers Creek;HN+HS
000029 28.80 Hayward-Rodgers Creek;HS
000126 13.48 Hayward-Rodgers Creek
000032 07.75 Hayward-Rodgers Creek;RC+HN+HS
000039 06.05 N. San Andreas;SAO+SAN+SAP+SAS
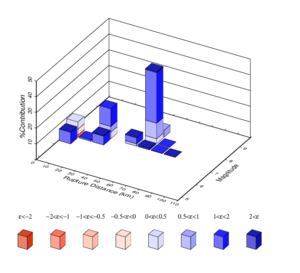
OKFS, ASK disaggregation at 3 sec RotD50
SAC
Source Percent Name
000133 28.04 Bartlett Springs
000296 21.04 1285_1654 Carson Range-Kings Canyon faults Char
000039 12.68 N. San Andreas;SAO+SAN+SAP+SAS
000037 07.85 N. San Andreas;SAO+SAN
000358 05.84 1647 Mount Rose fault zone Char
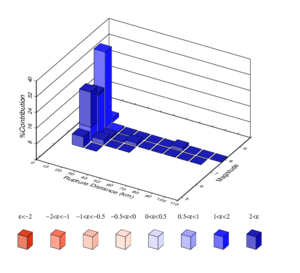
SAC, CyberShake disaggregation at 3 sec RotD50
Source Percent Name
000039 32.46 N. San Andreas;SAO+SAN+SAP+SAS
000037 18.87 N. San Andreas;SAO+SAN
000205 07.87 Maacama-Garberville
000190 07.17 Hunting Creek-Berryessa
000041 05.19 N. San Andreas;SAP+SAS
SAC, ASK disaggregation at 3 sec RotD50
LVMR
Source Percent Name
000039 36.75 N. San Andreas;SAO+SAN+SAP+SAS
000037 14.65 N. San Andreas;SAO+SAN
000179 13.34 Greenville Connected
000032 11.87 Hayward-Rodgers Creek;RC+HN+HS
000028 08.93 Hayward-Rodgers Creek;HN+HS
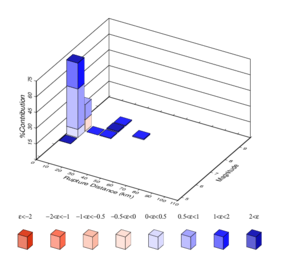
LVMR, CyberShake disaggregation at 3 sec RotD50
Source Percent Name
000179 29.86 Greenville Connected
000039 13.83 N. San Andreas;SAO+SAN+SAP+SAS
000004 11.07 Calaveras;CN+CC+CS
000214 09.57 Mount Diablo Thrust
000002 08.93 Calaveras;CN
LVMR, ASK disaggregation at 3 sec RotD50
SRSA
Source Percent Name
000030 55.54 Hayward-Rodgers Creek;RC
000031 16.59 Hayward-Rodgers Creek;RC+HN
000032 13.32 Hayward-Rodgers Creek;RC+HN+HS
000126 06.65 Hayward-Rodgers Creek
000039 03.72 N. San Andreas;SAO+SAN+SAP+SAS
SRSA, CyberShake disaggregation at 3 sec RotD50
Source Percent Name
000030 62.45 Hayward-Rodgers Creek;RC
000031 09.58 Hayward-Rodgers Creek;RC+HN
000032 06.87 Hayward-Rodgers Creek;RC+HN+HS
000126 06.86 Hayward-Rodgers Creek
000205 05.48 Maacama-Garberville
SRSA, ASK disaggregation at 3 sec RotD50
SJO
Source Percent Name
000039 74.48 N. San Andreas;SAO+SAN+SAP+SAS
000041 09.57 N. San Andreas;SAP+SAS
000037 06.04 N. San Andreas;SAO+SAN
000213 03.30 Monte Vista-Shannon
000127 03.07 N. San Andreas
SJO, CyberShake disaggregation at 3 sec RotD50
Source Percent Name
000039 35.89 N. San Andreas;SAO+SAN+SAP+SAS
000041 15.25 N. San Andreas;SAP+SAS
000028 09.85 Hayward-Rodgers Creek;HN+HS
000029 05.97 Hayward-Rodgers Creek;HS
000004 05.92 Calaveras;CN+CC+CS
SJO, ASK disaggregation at 3 sec RotD50
HAYW
Source Percent Name
000028 37.46 Hayward-Rodgers Creek;HN+HS
000126 23.07 Hayward-Rodgers Creek
000029 18.29 Hayward-Rodgers Creek;HS
000032 18.00 Hayward-Rodgers Creek;RC+HN+HS
000039 01.68 N. San Andreas;SAO+SAN+SAP+SAS
HAYW, CyberShake disaggregation at 3 sec RotD50
Source Percent Name
000028 35.88 Hayward-Rodgers Creek;HN+HS
000029 31.38 Hayward-Rodgers Creek;HS
000126 12.52 Hayward-Rodgers Creek
000032 08.33 Hayward-Rodgers Creek;RC+HN+HS
000039 06.09 N. San Andreas;SAO+SAN+SAP+SAS
HAYW, ASK disaggregation at 3 sec RotD50
CYB
Source Percent Name
000039 51.58 N. San Andreas;SAO+SAN+SAP+SAS
000037 31.97 N. San Andreas;SAO+SAN
000041 07.22 N. San Andreas;SAP+SAS
000127 02.90 N. San Andreas
000256 02.46 San Gregorio Connected
CYB, CyberShake disaggregation at 3 sec RotD50
Source Percent Name
000039 30.19 N. San Andreas;SAO+SAN+SAP+SAS
000037 20.34 N. San Andreas;SAO+SAN
000041 13.06 N. San Andreas;SAP+SAS
000028 07.99 Hayward-Rodgers Creek;HN+HS
000127 06.53 N. San Andreas
CYB, ASK disaggregation at 3 sec RotD50
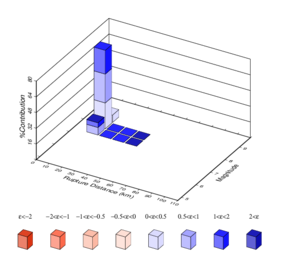
NAPA
Source Percent Name
000039 25.07 N. San Andreas;SAO+SAN+SAP+SAS
000037 22.98 N. San Andreas;SAO+SAN
000284 17.42 West Napa
000030 08.18 Hayward-Rodgers Creek;RC
000032 05.92 Hayward-Rodgers Creek;RC+HN+HS
NAPA, CyberShake disaggregation at 3 sec RotD50
Source Percent Name
000284 25.23 West Napa
000178 19.21 Green Valley Connected
000039 13.16 N. San Andreas;SAO+SAN+SAP+SAS
000190 09.54 Hunting Creek-Berryessa
000030 08.06 Hayward-Rodgers Creek;RC
NAPA, ASK disaggregation at 3 sec RotD50

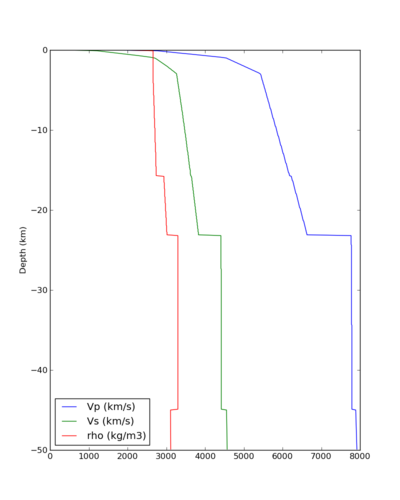
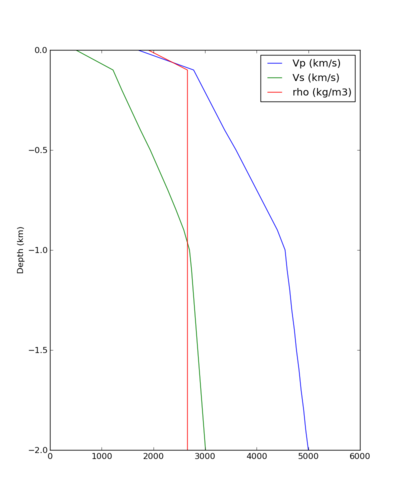
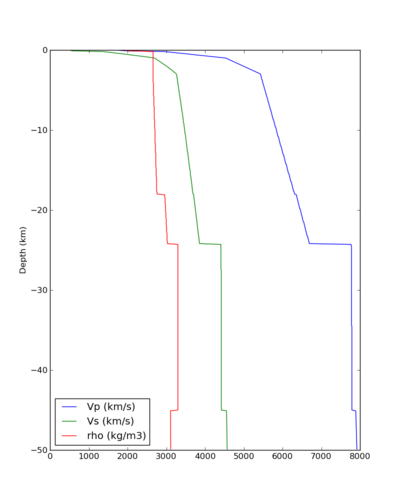
Velocity profiles

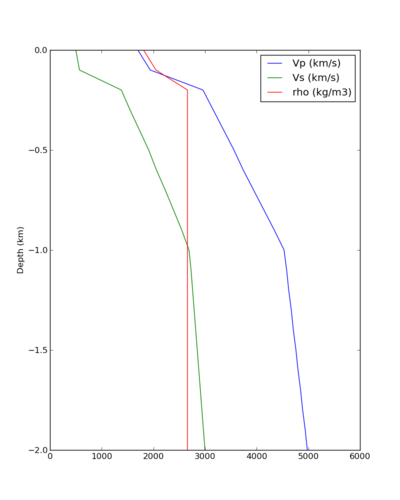
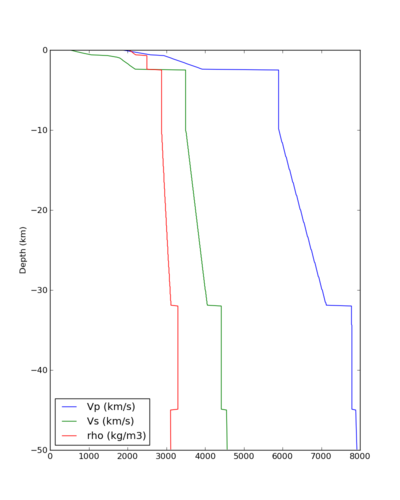
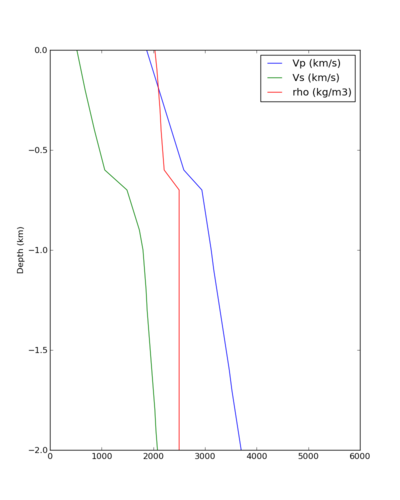
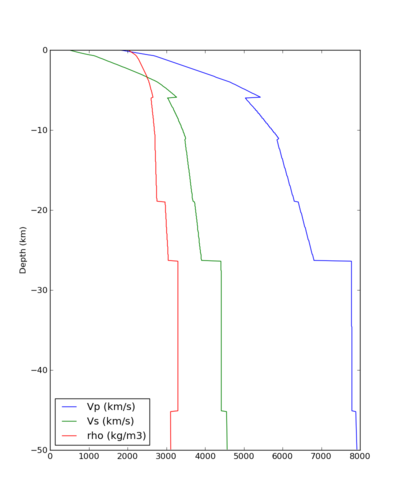
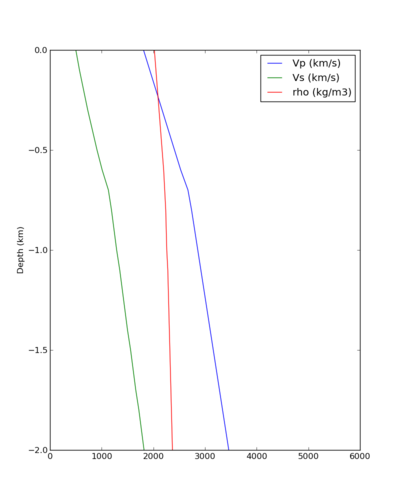
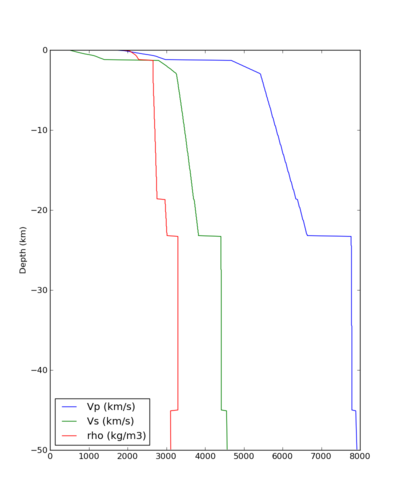
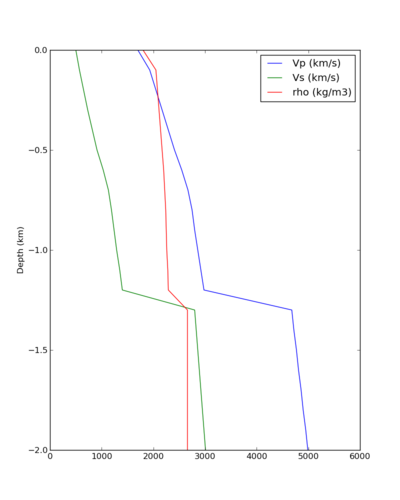
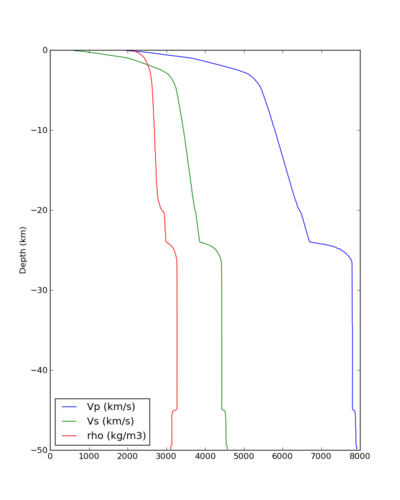
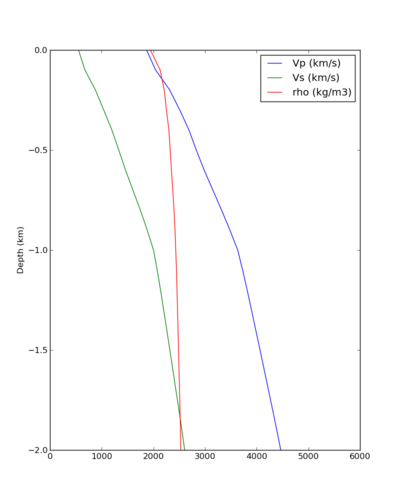
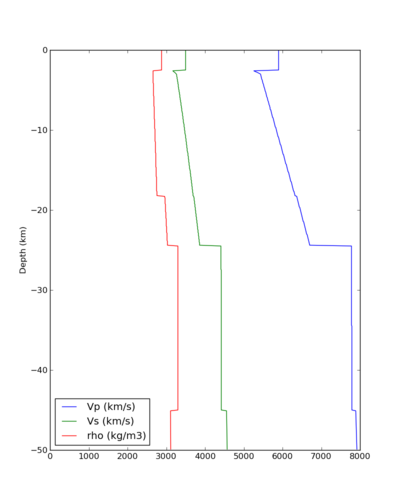
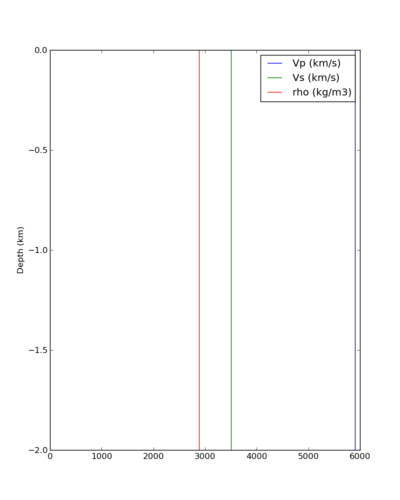
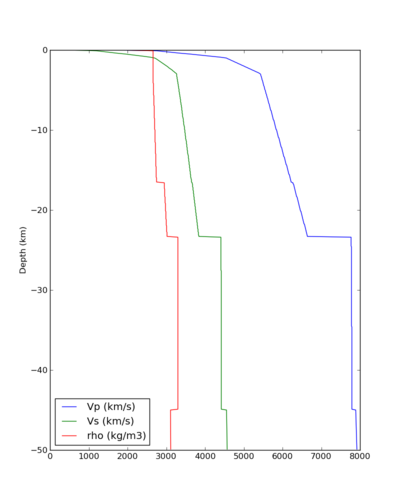
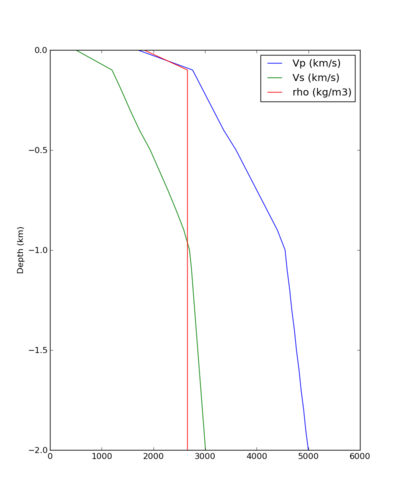
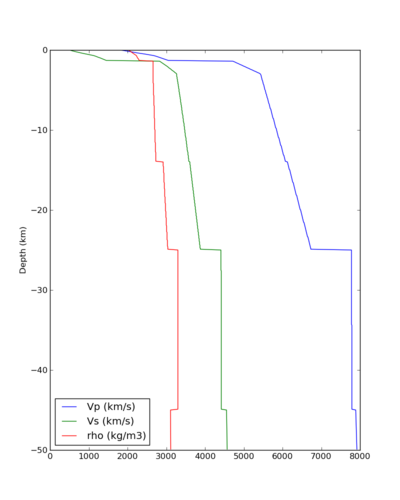
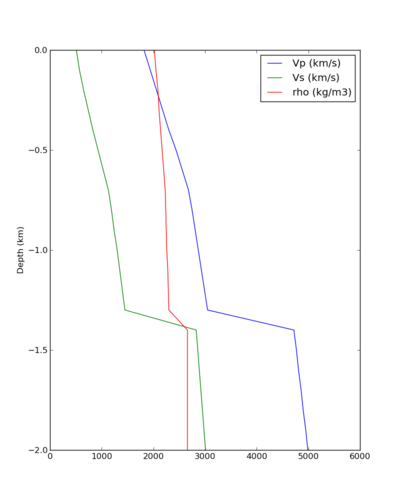
Below are velocity profiles for the 9 sites.

Site Velocity Profile (50 km) Velocity Profile (2 km)
SFRH
Velocity profile from CyberShake mesh for SFRH
Velocity profile from CyberShake mesh for SFRH, top 2 km
OKFS
Velocity profile from CyberShake mesh for OKFS
Velocity profile from CyberShake mesh for OKFS, top 2 km
SAC
Velocity profile from CyberShake mesh for SAC
Velocity profile from CyberShake mesh for SAC, top 2 km
LVMR
Velocity profile from CyberShake mesh for LVMR
Velocity profile from CyberShake mesh for LVMR, top 2 km
SRSA
Velocity profile from CyberShake mesh for SRSA
Velocity profile from CyberShake mesh for SRSA, top 2 km
SJO
Velocity profile from CyberShake mesh for SJO
Velocity profile from CyberShake mesh for SJO, top 2 km
HAYW
Velocity profile from CyberShake mesh for HAYW
Velocity profile from CyberShake mesh for HAYW, top 2 km
CYB
Velocity profile from CyberShake mesh for CYB
Velocity profile from CyberShake mesh for CYB, top 2 km
NAPA
Velocity profile from CyberShake mesh for NAPA
Velocity profile from CyberShake mesh for NAPA, top 2 km

Overlapping sites

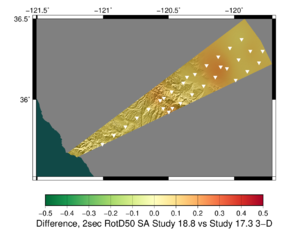
32 sites were used in both Study 18.8 and Study 17.3. Below are difference and ratio maps for this region between the two studies.

Map Type 2 sec 3 sec 5 sec 10 sec
Diff (18.8 - 17.3)
Difference plot, Study 18.8 - Study 17.3 3D, 2 sec RotD50
Difference plot, Study 18.8 - Study 17.3 3D, 3 sec RotD50
Difference plot, Study 18.8 - Study 17.3 3D, 5 sec RotD50
Difference plot, Study 18.8 - Study 17.3 3D, 10 sec RotD50
Ratio (18.8/17.3)
Ratio plot, Study 18.8 - Study 17.3 3D, 2 sec RotD50
Ratio plot, Study 18.8 - Study 17.3 3D, 3 sec RotD50
Ratio plot, Study 18.8 - Study 17.3 3D, 5 sec RotD50
Ratio plot, Study 18.8 - Study 17.3 3D, 10 sec RotD50

Higher-res versions are available here.
Hazard Curves

Waveforms