|
|
| (2 intermediate revisions by the same user not shown) |
| Line 608: |
Line 608: |
| | === Waveforms === | | === Waveforms === |
| | | | |
| − | We've selected the two | + | We've selected the two events we used for investigating velocity models for waveform comparisons. Those events are: |
| | + | # A M8.15 northern SAF event (source 39, rupture 5, rupture variation 311, hypocenter just offshore about 60 km south of Eureka) |
| | + | # A M7.75 southern SAF event (source 59, rupture 0, rupture variation 0, hypocenter near Bombay Beach) |
| | + | |
| | + | {| |
| | + | ! Site !! Northern event !! Southern event |
| | + | |- |
| | + | ! s835 |
| | + | | [[File:s835_5847_v_5612_s39_r5_rv311.png|thumb|400px]] |
| | + | | [[File:s835_5847_v_5612_s59_r0_rv0.png|thumb|400px]] |
| | + | |- |
| | + | ! s816 |
| | + | | [[File:s816_5856_v_5709_s39_r5_rv311.png|thumb|400px]] |
| | + | | [[File:s816_5856_v_5709_s59_r0_rv0.png|thumb|400px]] |
| | + | |- |
| | + | ! s903 |
| | + | | [[File:s903_5851_v_5582_s39_r5_rv311.png|thumb|400px]] |
| | + | | [[File:s903_5851_v_5582_s59_r0_rv0.png|thumb|400px]] |
| | + | |- |
| | + | ! s975 |
| | + | | [[File:s975_6793_v_5558_s39_r5_rv311.png|thumb|400px]] |
| | + | | [[File:s975_6793_v_5558_s59_r0_rv0.png|thumb|400px]] |
| | + | |} |
Latest revision as of 16:39, 28 May 2019
Below are some selected data products from Study 18.8.
Selected Sites
We have selected the following 9 sites for closer comparison:
| Long Name |
Short Name |
Lat |
Lon |
Run ID
|
| San Francisco - Rincon Hill |
SFRH |
37.786 |
-122.391 |
6003
|
| Oakland - Fire Station 23 |
OKFS |
37.7696 |
-122.1734 |
6000
|
| Sacramento |
SAC |
38.581573 |
-121.4944 |
6745
|
| Livermore |
LVMR |
37.681873 |
-121.768005 |
6888
|
| Santa Rosa |
SRSA |
38.440468 |
-122.71443 |
6709
|
| San Jose |
SJO |
37.339386 |
-121.89496 |
6987
|
| Hayward |
HAYW |
37.679 |
-122.082 |
5984
|
| Yerba Buena |
CYB |
37.807873 |
-122.3618 |
6009
|
| Napa |
NAPA |
38.29754 |
-122.286865 |
6743
|
Hazard Curves
Following are hazard curves for a selected subset of sites.
| Site |
2 sec |
3 sec |
5 sec |
10 sec
|
| SFRH
|
|
|
|
|
| OKFS
|
|
|
|
|
| SAC
|
|
|
|
|
| LVMR
|
|
|
|
|
| SRSA
|
|
|
|
|
| SJO
|
|
|
|
|
| HAYW
|
|
|
|
|
| CYB
|
|
|
|
|
| NAPA
|
|
|
|
|
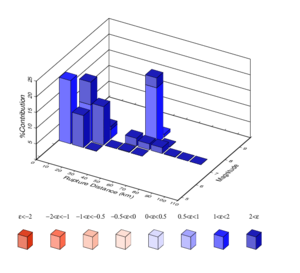
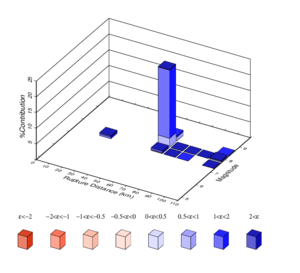
Disaggregation
| Site |
Top 5 CyberShake contributors |
CyberShake Plot |
Top 5 ASK contributors |
ASK Plot
|
| SFRH
|
| Source |
Percent |
Name
|
| 000039 |
57.07 |
N. San Andreas;SAO+SAN+SAP+SAS
|
| 000037 |
22.81 |
N. San Andreas;SAO+SAN
|
| 000041 |
10.91 |
N. San Andreas;SAP+SAS
|
| 000256 |
03.20 |
San Gregorio Connected
|
| 000127 |
03.05 |
N. San Andreas
|
|
 SFRH, CyberShake disaggregation at 3 sec RotD50 |
| Source |
Percent |
Name
|
| 000039 |
34.88 |
N. San Andreas;SAO+SAN+SAP+SAS
|
| 000037 |
22.22 |
N. San Andreas;SAO+SAN
|
| 000041 |
17.04 |
N. San Andreas;SAP+SAS
|
| 000127 |
07.98 |
N. San Andreas
|
| 000256 |
05.79 |
San Gregorio Connected
|
|
 SFRH, ASK disaggregation at 3 sec RotD50 |
| OKFS
|
| Source |
Percent |
Name
|
| 000028 |
34.20 |
Hayward-Rodgers Creek;HN+HS
|
| 000029 |
23.71 |
Hayward-Rodgers Creek;HS
|
| 000126 |
19.70 |
Hayward-Rodgers Creek
|
| 000032 |
14.33 |
Hayward-Rodgers Creek;RC+HN+HS
|
| 000031 |
04.52 |
Hayward-Rodgers Creek;RC+HN
|
|
 OKFS, CyberShake disaggregation at 3 sec RotD50 |
| Source |
Percent |
Name
|
| 000028 |
33.23 |
Hayward-Rodgers Creek;HN+HS
|
| 000029 |
28.80 |
Hayward-Rodgers Creek;HS
|
| 000126 |
13.48 |
Hayward-Rodgers Creek
|
| 000032 |
07.75 |
Hayward-Rodgers Creek;RC+HN+HS
|
| 000039 |
06.05 |
N. San Andreas;SAO+SAN+SAP+SAS
|
|
 OKFS, ASK disaggregation at 3 sec RotD50 |
| SAC
|
| Source |
Percent |
Name
|
| 000133 |
28.04 |
Bartlett Springs
|
| 000296 |
21.04 |
1285_1654 Carson Range-Kings Canyon faults Char
|
| 000039 |
12.68 |
N. San Andreas;SAO+SAN+SAP+SAS
|
| 000037 |
07.85 |
N. San Andreas;SAO+SAN
|
| 000358 |
05.84 |
1647 Mount Rose fault zone Char
|
|
 SAC, CyberShake disaggregation at 3 sec RotD50 |
| Source |
Percent |
Name
|
| 000039 |
32.46 |
N. San Andreas;SAO+SAN+SAP+SAS
|
| 000037 |
18.87 |
N. San Andreas;SAO+SAN
|
| 000205 |
07.87 |
Maacama-Garberville
|
| 000190 |
07.17 |
Hunting Creek-Berryessa
|
| 000041 |
05.19 |
N. San Andreas;SAP+SAS
|
|
 SAC, ASK disaggregation at 3 sec RotD50 |
| LVMR
|
| Source |
Percent |
Name
|
| 000039 |
36.75 |
N. San Andreas;SAO+SAN+SAP+SAS
|
| 000037 |
14.65 |
N. San Andreas;SAO+SAN
|
| 000179 |
13.34 |
Greenville Connected
|
| 000032 |
11.87 |
Hayward-Rodgers Creek;RC+HN+HS
|
| 000028 |
08.93 |
Hayward-Rodgers Creek;HN+HS
|
|
 LVMR, CyberShake disaggregation at 3 sec RotD50 |
| Source |
Percent |
Name
|
| 000179 |
29.86 |
Greenville Connected
|
| 000039 |
13.83 |
N. San Andreas;SAO+SAN+SAP+SAS
|
| 000004 |
11.07 |
Calaveras;CN+CC+CS
|
| 000214 |
09.57 |
Mount Diablo Thrust
|
| 000002 |
08.93 |
Calaveras;CN
|
|
 LVMR, ASK disaggregation at 3 sec RotD50 |
| SRSA
|
| Source |
Percent |
Name
|
| 000030 |
55.54 |
Hayward-Rodgers Creek;RC
|
| 000031 |
16.59 |
Hayward-Rodgers Creek;RC+HN
|
| 000032 |
13.32 |
Hayward-Rodgers Creek;RC+HN+HS
|
| 000126 |
06.65 |
Hayward-Rodgers Creek
|
| 000039 |
03.72 |
N. San Andreas;SAO+SAN+SAP+SAS
|
|
 SRSA, CyberShake disaggregation at 3 sec RotD50 |
| Source |
Percent |
Name
|
| 000030 |
62.45 |
Hayward-Rodgers Creek;RC
|
| 000031 |
09.58 |
Hayward-Rodgers Creek;RC+HN
|
| 000032 |
06.87 |
Hayward-Rodgers Creek;RC+HN+HS
|
| 000126 |
06.86 |
Hayward-Rodgers Creek
|
| 000205 |
05.48 |
Maacama-Garberville
|
|
 SRSA, ASK disaggregation at 3 sec RotD50 |
| SJO
|
| Source |
Percent |
Name
|
| 000039 |
74.48 |
N. San Andreas;SAO+SAN+SAP+SAS
|
| 000041 |
09.57 |
N. San Andreas;SAP+SAS
|
| 000037 |
06.04 |
N. San Andreas;SAO+SAN
|
| 000213 |
03.30 |
Monte Vista-Shannon
|
| 000127 |
03.07 |
N. San Andreas
|
|
 SJO, CyberShake disaggregation at 3 sec RotD50 |
| Source |
Percent |
Name
|
| 000039 |
35.89 |
N. San Andreas;SAO+SAN+SAP+SAS
|
| 000041 |
15.25 |
N. San Andreas;SAP+SAS
|
| 000028 |
09.85 |
Hayward-Rodgers Creek;HN+HS
|
| 000029 |
05.97 |
Hayward-Rodgers Creek;HS
|
| 000004 |
05.92 |
Calaveras;CN+CC+CS
|
|
 SJO, ASK disaggregation at 3 sec RotD50 |
| HAYW
|
| Source |
Percent |
Name
|
| 000028 |
37.46 |
Hayward-Rodgers Creek;HN+HS
|
| 000126 |
23.07 |
Hayward-Rodgers Creek
|
| 000029 |
18.29 |
Hayward-Rodgers Creek;HS
|
| 000032 |
18.00 |
Hayward-Rodgers Creek;RC+HN+HS
|
| 000039 |
01.68 |
N. San Andreas;SAO+SAN+SAP+SAS
|
|
 HAYW, CyberShake disaggregation at 3 sec RotD50 |
| Source |
Percent |
Name
|
| 000028 |
35.88 |
Hayward-Rodgers Creek;HN+HS
|
| 000029 |
31.38 |
Hayward-Rodgers Creek;HS
|
| 000126 |
12.52 |
Hayward-Rodgers Creek
|
| 000032 |
08.33 |
Hayward-Rodgers Creek;RC+HN+HS
|
| 000039 |
06.09 |
N. San Andreas;SAO+SAN+SAP+SAS
|
|
 HAYW, ASK disaggregation at 3 sec RotD50 |
| CYB
|
| Source |
Percent |
Name
|
| 000039 |
51.58 |
N. San Andreas;SAO+SAN+SAP+SAS
|
| 000037 |
31.97 |
N. San Andreas;SAO+SAN
|
| 000041 |
07.22 |
N. San Andreas;SAP+SAS
|
| 000127 |
02.90 |
N. San Andreas
|
| 000256 |
02.46 |
San Gregorio Connected
|
|
 CYB, CyberShake disaggregation at 3 sec RotD50 |
| Source |
Percent |
Name
|
| 000039 |
30.19 |
N. San Andreas;SAO+SAN+SAP+SAS
|
| 000037 |
20.34 |
N. San Andreas;SAO+SAN
|
| 000041 |
13.06 |
N. San Andreas;SAP+SAS
|
| 000028 |
07.99 |
Hayward-Rodgers Creek;HN+HS
|
| 000127 |
06.53 |
N. San Andreas
|
|
 CYB, ASK disaggregation at 3 sec RotD50 |
| NAPA
|
| Source |
Percent |
Name
|
| 000039 |
25.07 |
N. San Andreas;SAO+SAN+SAP+SAS
|
| 000037 |
22.98 |
N. San Andreas;SAO+SAN
|
| 000284 |
17.42 |
West Napa
|
| 000030 |
08.18 |
Hayward-Rodgers Creek;RC
|
| 000032 |
05.92 |
Hayward-Rodgers Creek;RC+HN+HS
|
|
 NAPA, CyberShake disaggregation at 3 sec RotD50 |
| Source |
Percent |
Name
|
| 000284 |
25.23 |
West Napa
|
| 000178 |
19.21 |
Green Valley Connected
|
| 000039 |
13.16 |
N. San Andreas;SAO+SAN+SAP+SAS
|
| 000190 |
09.54 |
Hunting Creek-Berryessa
|
| 000030 |
08.06 |
Hayward-Rodgers Creek;RC
|
|
 NAPA, ASK disaggregation at 3 sec RotD50 |
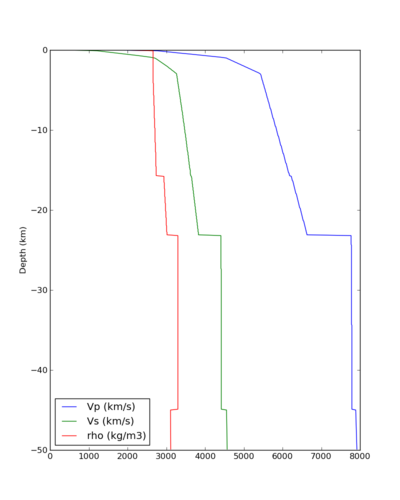
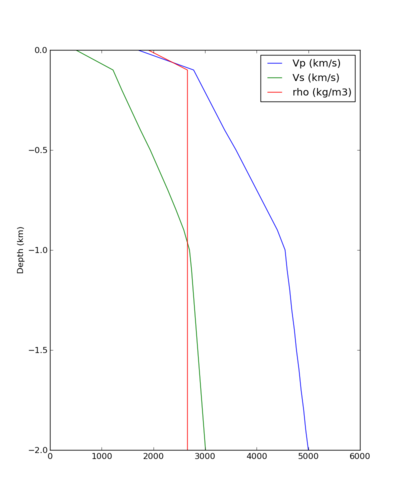
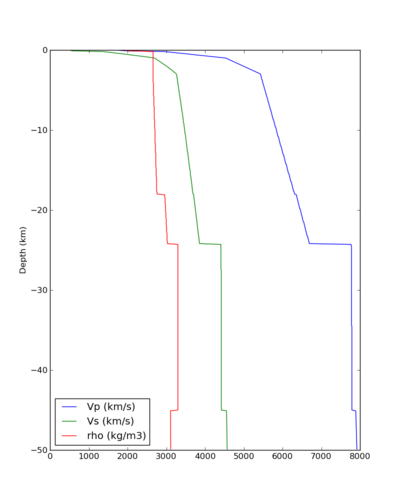
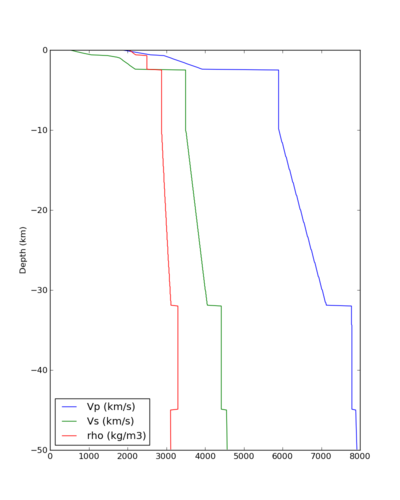
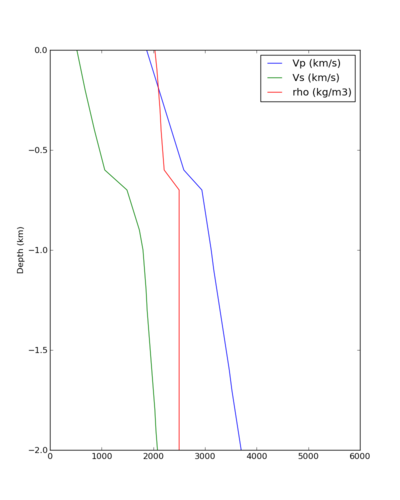
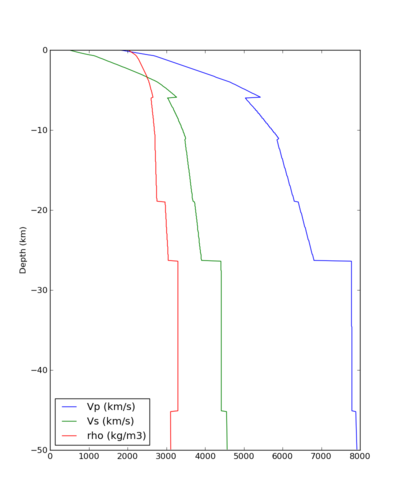
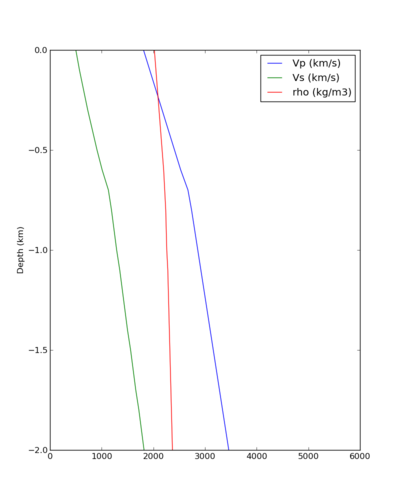
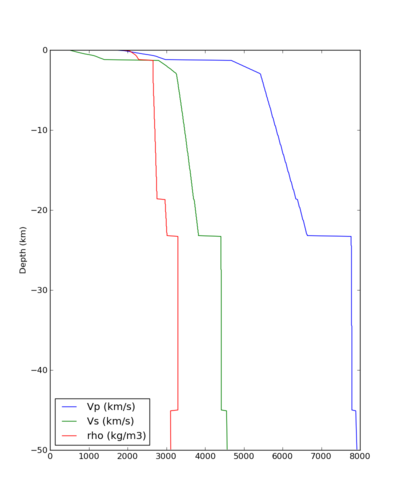
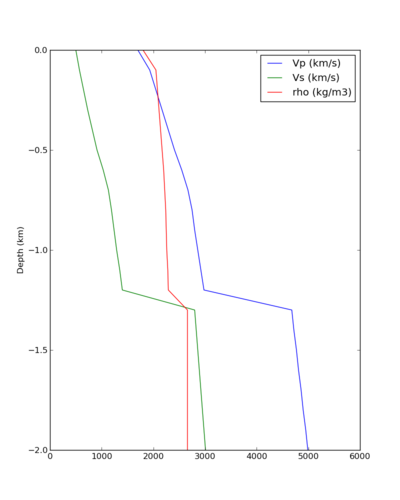
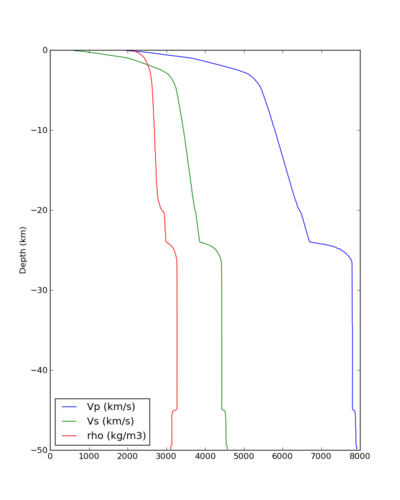
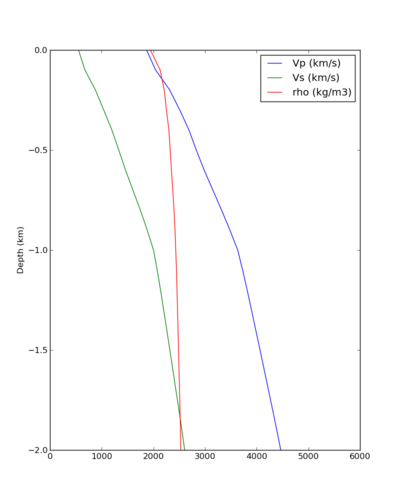
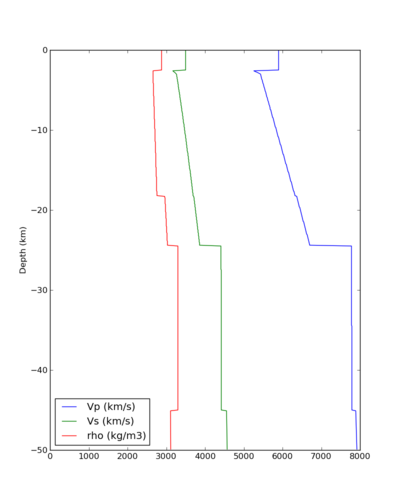
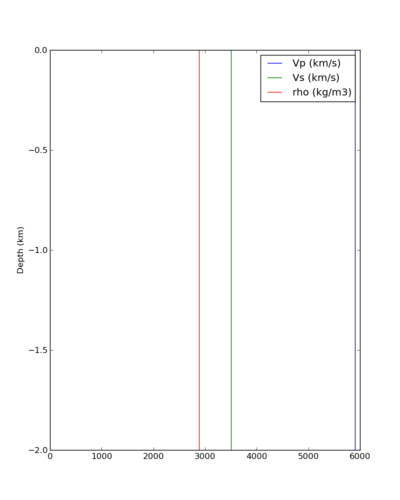
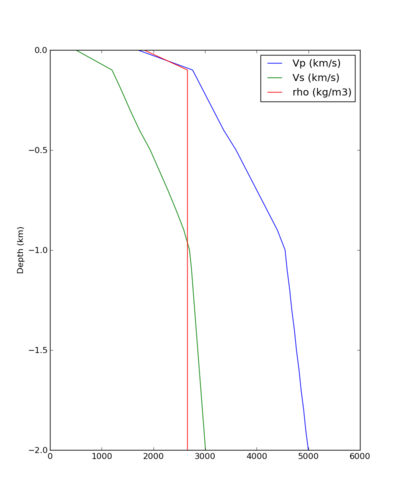
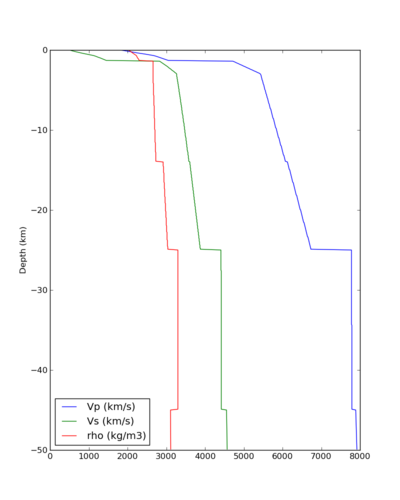
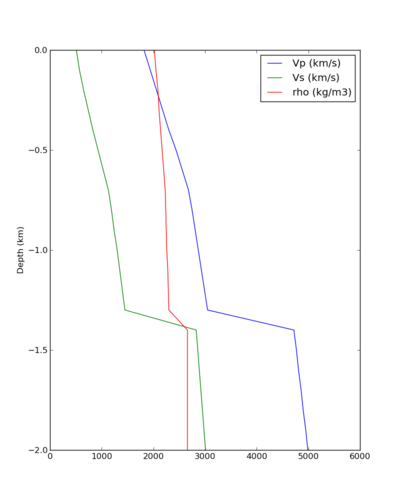
Velocity profiles
Below are velocity profiles for the 9 sites.
| Site |
Velocity Profile (50 km) |
Velocity Profile (2 km)
|
| SFRH |
 Velocity profile from CyberShake mesh for SFRH |
 Velocity profile from CyberShake mesh for SFRH, top 2 km |
| OKFS |
 Velocity profile from CyberShake mesh for OKFS |
 Velocity profile from CyberShake mesh for OKFS, top 2 km |
| SAC |
 Velocity profile from CyberShake mesh for SAC |
 Velocity profile from CyberShake mesh for SAC, top 2 km |
| LVMR |
 Velocity profile from CyberShake mesh for LVMR |
 Velocity profile from CyberShake mesh for LVMR, top 2 km |
| SRSA |
 Velocity profile from CyberShake mesh for SRSA |
 Velocity profile from CyberShake mesh for SRSA, top 2 km |
| SJO |
 Velocity profile from CyberShake mesh for SJO |
 Velocity profile from CyberShake mesh for SJO, top 2 km |
| HAYW |
 Velocity profile from CyberShake mesh for HAYW |
 Velocity profile from CyberShake mesh for HAYW, top 2 km |
| CYB |
 Velocity profile from CyberShake mesh for CYB |
 Velocity profile from CyberShake mesh for CYB, top 2 km |
| NAPA |
 Velocity profile from CyberShake mesh for NAPA |
 Velocity profile from CyberShake mesh for NAPA, top 2 km |
Overlapping sites
32 sites were used in both Study 18.8 and Study 17.3. Below are difference and ratio maps for this region between the two studies.
| Map Type |
2 sec |
3 sec |
5 sec |
10 sec
|
| Diff (18.8 - 17.3)
|
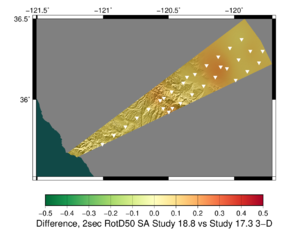 Difference plot, Study 18.8 - Study 17.3 3D, 2 sec RotD50 |
 Difference plot, Study 18.8 - Study 17.3 3D, 3 sec RotD50 |
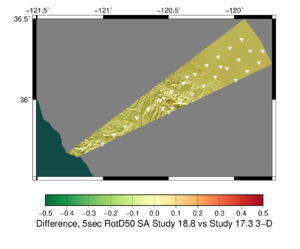 Difference plot, Study 18.8 - Study 17.3 3D, 5 sec RotD50 |
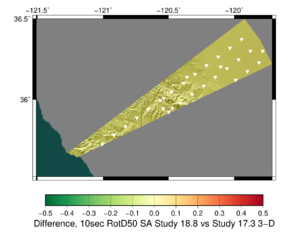 Difference plot, Study 18.8 - Study 17.3 3D, 10 sec RotD50 |
| Ratio (18.8/17.3)
|
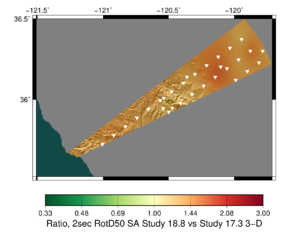 Ratio plot, Study 18.8/Study 17.3 3D, 2 sec RotD50 |
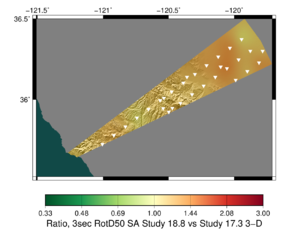 Ratio plot, Study 18.8/Study 17.3 3D, 3 sec RotD50 |
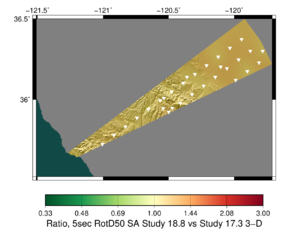 Ratio plot, Study 18.8/Study 17.3 3D, 5 sec RotD50 |
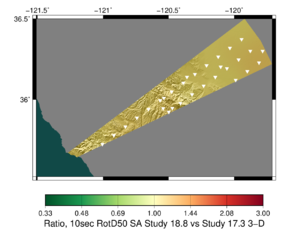 Ratio plot, Study 18.8/Study 17.3 3D, 10 sec RotD50 |
Higher-res versions are available here.
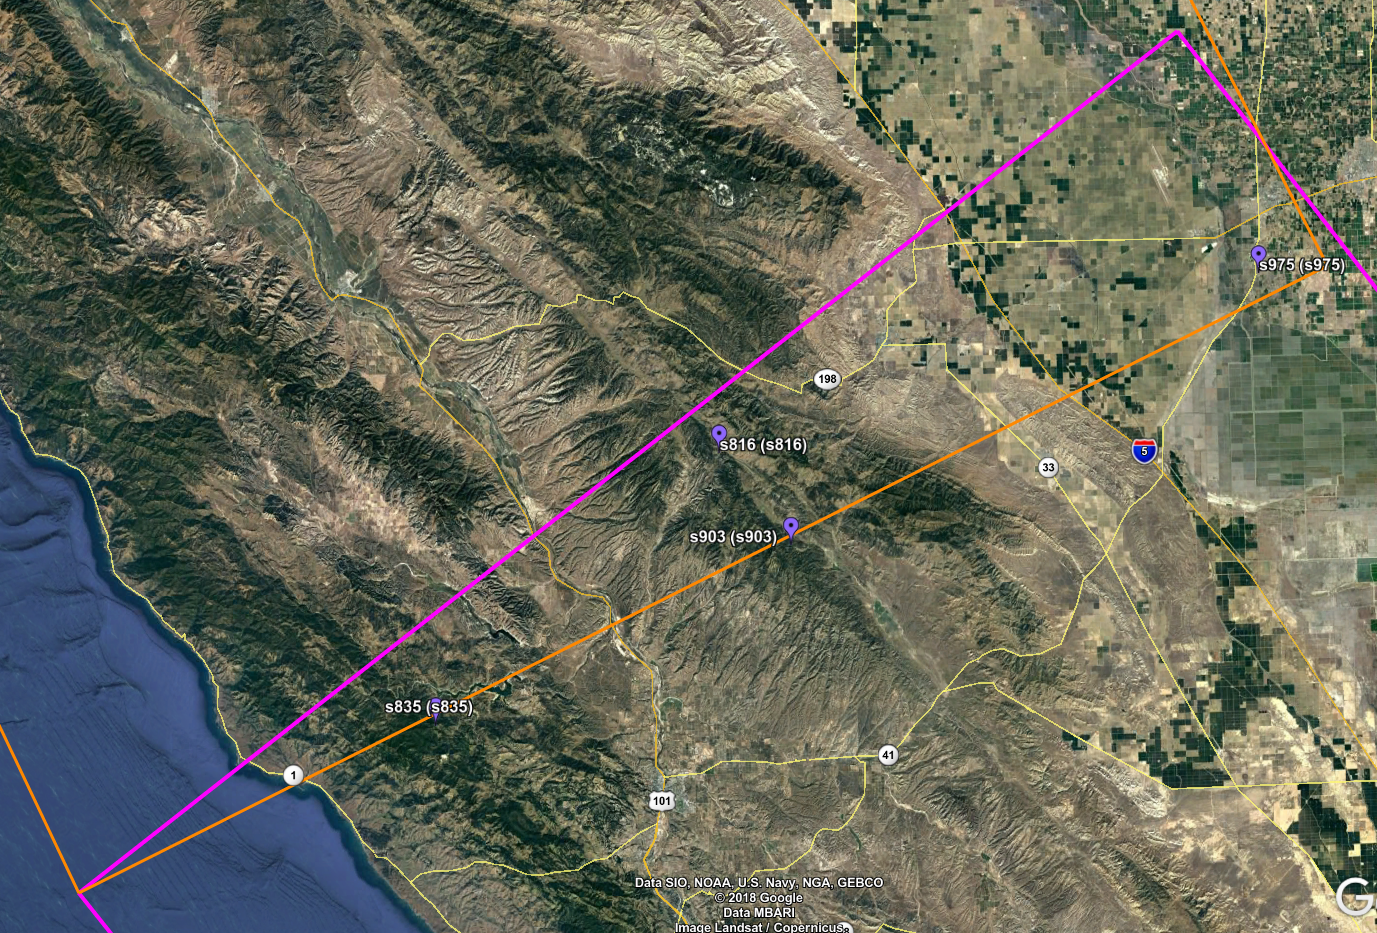
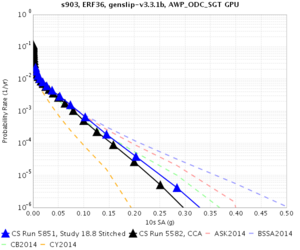
Comparison sites
For more in-depth comparisons, we have selected 4 sites in the overlapping region: s835, near the coast; s816 and s903, in the mountains; and s975, in the valley.
Hazard Curves
Hazard curves for the 4 overlapping sites.
| Site |
2 sec |
3 sec |
5 sec |
10 sec
|
| s835
|
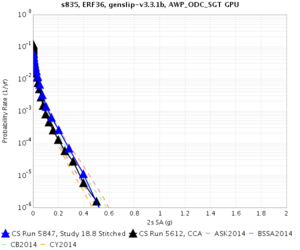 Study 18.8 (blue) vs Study 17.3 3D (black), 2 sec RotD50 |
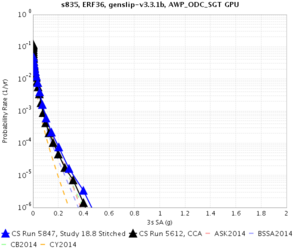 Study 18.8 (blue) vs Study 17.3 3D (black), 3 sec RotD50 |
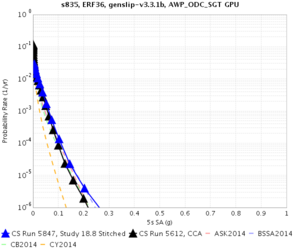 Study 18.8 (blue) vs Study 17.3 3D (black), 5 sec RotD50 |
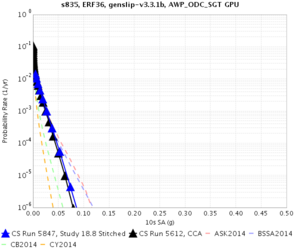 Study 18.8 (blue) vs Study 17.3 3D (black), 10 sec RotD50 |
| s816
|
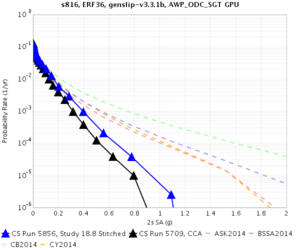 Study 18.8 (blue) vs Study 17.3 3D (black), 2 sec RotD50 |
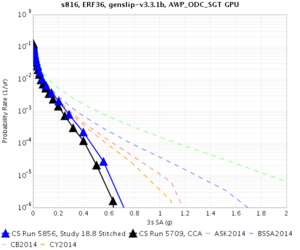 Study 18.8 (blue) vs Study 17.3 3D (black), 3 sec RotD50 |
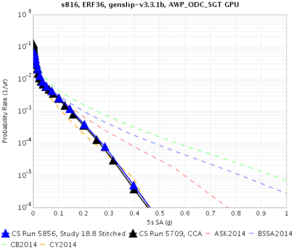 Study 18.8 (blue) vs Study 17.3 3D (black), 5 sec RotD50 |
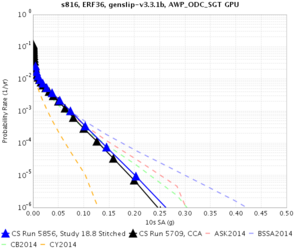 Study 18.8 (blue) vs Study 17.3 3D (black), 10 sec RotD50 |
| s903
|
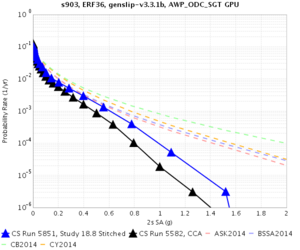 Study 18.8 (blue) vs Study 17.3 3D (black), 2 sec RotD50 |
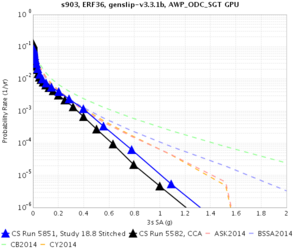 Study 18.8 (blue) vs Study 17.3 3D (black), 3 sec RotD50 |
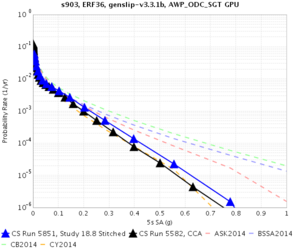 Study 18.8 (blue) vs Study 17.3 3D (black), 5 sec RotD50 |
 Study 18.8 (blue) vs Study 17.3 3D (black), 10 sec RotD50 |
| s975
|
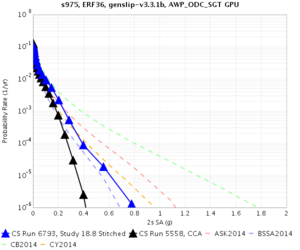 Study 18.8 (blue) vs Study 17.3 3D (black), 2 sec RotD50 |
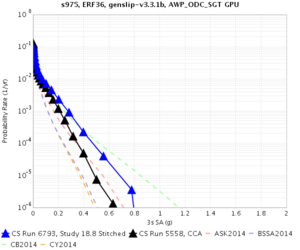 Study 18.8 (blue) vs Study 17.3 3D (black), 3 sec RotD50 |
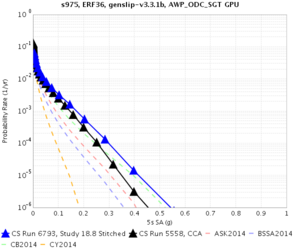 Study 18.8 (blue) vs Study 17.3 3D (black), 5 sec RotD50 |
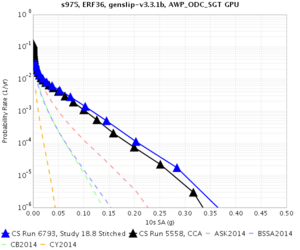 Study 18.8 (blue) vs Study 17.3 3D (black), 10 sec RotD50 |
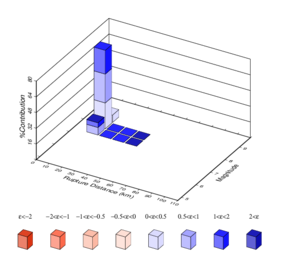
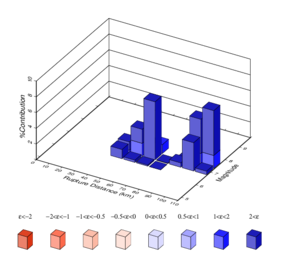
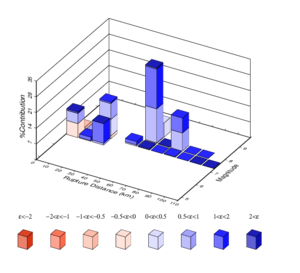
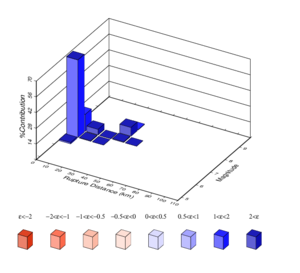
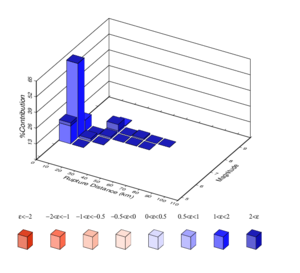
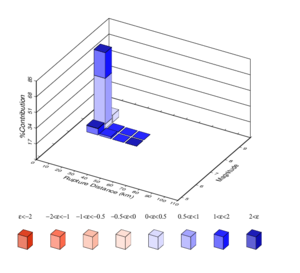
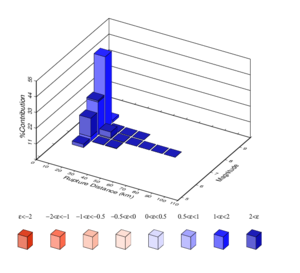
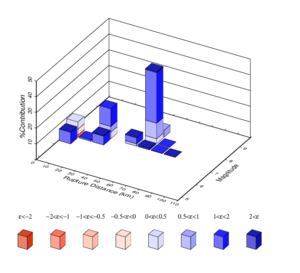
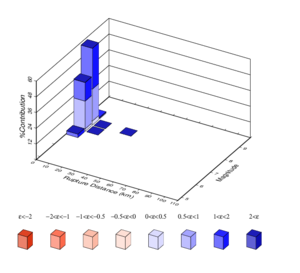
Disaggregation
Disaggregation for the 4 sites, comparing Study 18.8 with Study 17.3.
| Site |
Top 5 Study 18.8 contributors |
Study 18.8 Plot |
Top 5 Study 17.3 contributors |
Study 17.3 Plot
|
| s835
|
| Source |
Percent |
Name
|
| 000187 |
65.16 |
Hosgri
|
| 000249 |
26.40 |
Rinconada
|
| 000039 |
02.50 |
N. San Andreas;SAO+SAN+SAP+SAS
|
| 000085 |
01.66 |
S. San Andreas;PK+CH+CC+BB+NM+SM
|
| 000084 |
01.07 |
S. San Andreas;PK+CH+CC+BB+NM
|
|
 s835, Study 18.8 disagg 3 sec RotD50 |
| Source |
Percent |
Name
|
| 000187 |
61.01 |
Hosgri
|
| 000249 |
24.79 |
Rinconada
|
| 000039 |
05.98 |
N. San Andreas;SAO+SAN+SAP+SAS
|
| 000085 |
03.07 |
S. San Andreas;PK+CH+CC+BB+NM+SM
|
| 000086 |
01.09 |
S. San Andreas;PK+CH+CC+BB+NM+SM+NSB
|
|
 s835, Study 17.3 disagg 3 sec RotD50 |
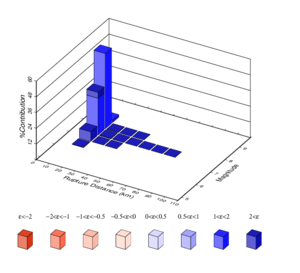
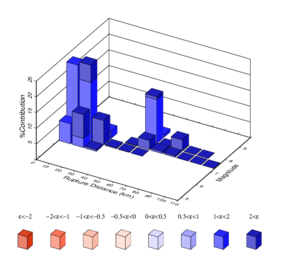
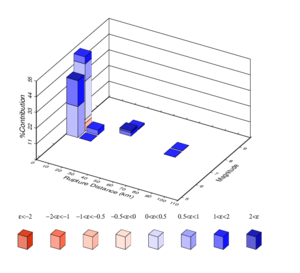
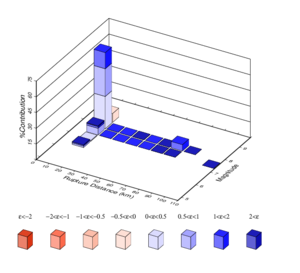
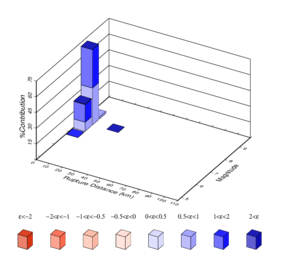
| s816
|
| Source |
Percent |
Name
|
| 000084 |
27.94 |
S. San Andreas;PK+CH+CC+BB+NM
|
| 000085 |
21.87 |
S. San Andreas;PK+CH+CC+BB+NM+SM
|
| 000081 |
16.19 |
S. San Andreas;PK+CH
|
| 000083 |
12.72 |
S. San Andreas;PK+CH+CC+BB
|
| 000082 |
10.27 |
S. San Andreas;PK+CH+CC
|
|
 s816, Study 18.8 disagg 3 sec RotD50 |
| Source |
Percent |
Name
|
| 000084 |
26.67 |
S. San Andreas;PK+CH+CC+BB+NM
|
| 000085 |
20.92 |
S. San Andreas;PK+CH+CC+BB+NM+SM
|
| 000081 |
18.84 |
S. San Andreas;PK+CH
|
| 000083 |
11.67 |
S. San Andreas;PK+CH+CC+BB
|
| 000082 |
10.79 |
S. San Andreas;PK+CH+CC
|
|
 s816, Study 17.3 disagg 3 sec RotD50 |
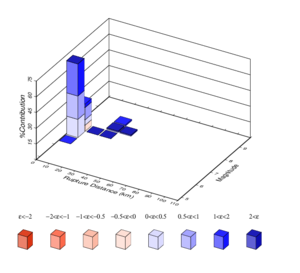
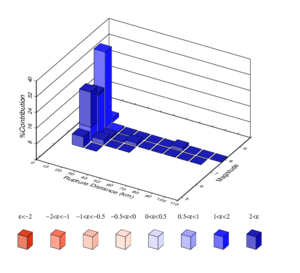
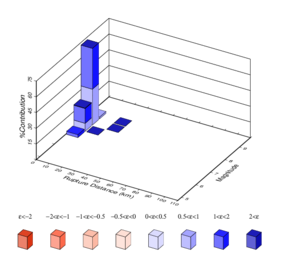
| s903
|
| Source |
Percent |
Name
|
| 000085 |
31.85 |
S. San Andreas;PK+CH+CC+BB+NM+SM
|
| 000084 |
22.47 |
S. San Andreas;PK+CH+CC+BB+NM
|
| 000086 |
12.69 |
S. San Andreas;PK+CH+CC+BB+NM+SM+NSB
|
| 000083 |
10.31 |
S. San Andreas;PK+CH+CC+BB
|
| 000081 |
09.20 |
S. San Andreas;PK+CH
|
|
 s903, Study 18.8 disagg 3 sec RotD50 |
| Source |
Percent |
Name
|
| 000085 |
32.32 |
S. San Andreas;PK+CH+CC+BB+NM+SM
|
| 000084 |
23.86 |
S. San Andreas;PK+CH+CC+BB+NM
|
| 000086 |
11.82 |
S. San Andreas;PK+CH+CC+BB+NM+SM+NSB
|
| 000083 |
10.47 |
S. San Andreas;PK+CH+CC+BB
|
| 000082 |
07.50 |
S. San Andreas;PK+CH+CC
|
|
 s903, Study 17.3 disagg 3 sec RotD50 |
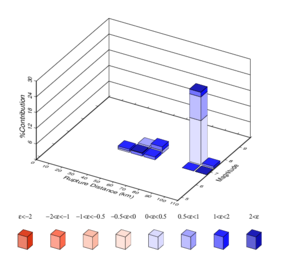
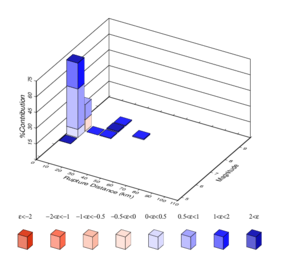
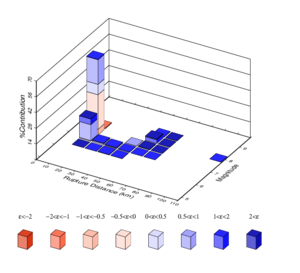
| s975
|
| Source |
Percent |
Name
|
| 000039 |
65.82 |
N. San Andreas;SAO+SAN+SAP+SAS
|
| 000041 |
14.52 |
N. San Andreas;SAP+SAS
|
| 000085 |
06.33 |
S. San Andreas;PK+CH+CC+BB+NM+SM
|
| 000084 |
03.23 |
S. San Andreas;PK+CH+CC+BB+NM
|
| 000086 |
02.94 |
S. San Andreas;PK+CH+CC+BB+NM+SM+NSB
|
|
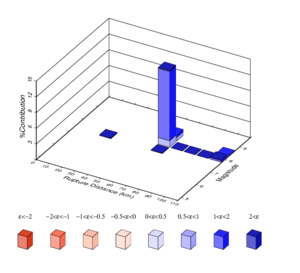 s975, Study 18.8 disagg 3 sec RotD50 |
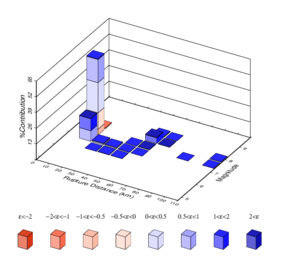
| Source |
Percent |
Name
|
| 000039 |
57.73 |
N. San Andreas;SAO+SAN+SAP+SAS
|
| 000085 |
12.08 |
S. San Andreas;PK+CH+CC+BB+NM+SM
|
| 000041 |
10.75 |
N. San Andreas;SAP+SAS
|
| 000084 |
04.08 |
S. San Andreas;PK+CH+CC+BB+NM
|
| 000086 |
03.77 |
S. San Andreas;PK+CH+CC+BB+NM+SM+NSB
|
|
 s975, Study 17.3 disagg 3 sec RotD50 |
Waveforms
We've selected the two events we used for investigating velocity models for waveform comparisons. Those events are:
- A M8.15 northern SAF event (source 39, rupture 5, rupture variation 311, hypocenter just offshore about 60 km south of Eureka)
- A M7.75 southern SAF event (source 59, rupture 0, rupture variation 0, hypocenter near Bombay Beach)
| Site |
Northern event |
Southern event
|
| s835
|
|
|
| s816
|
|
|
| s903
|
|
|
| s975
|
|
|


