Hazard Maps
Below are hazard maps from Study 15.12 (150 ppi).
Basic Maps
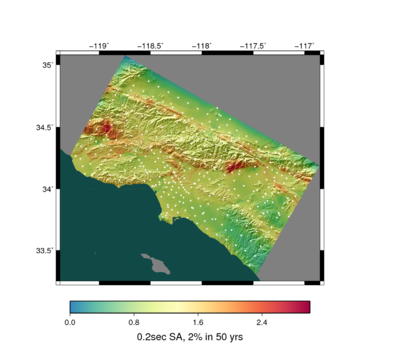
| 0.2 sec geometric mean
|
 0.2 sec geometric mean hazard map, all sites |
 0.2 sec geometric mean hazard map, all sites, marked |
|
| 0.5 sec geometric mean
|
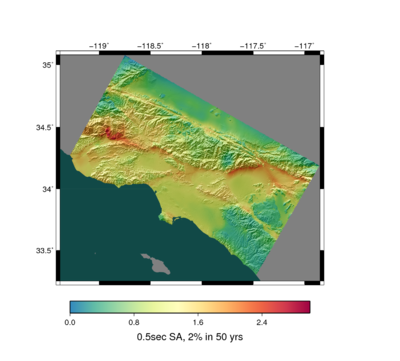 0.5 sec geometric mean hazard map, all sites |
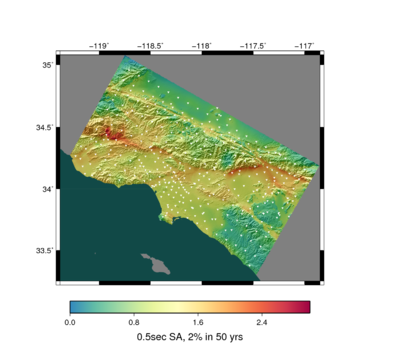 0.5 sec geometric mean hazard map, all sites, marked |
|
| 1 sec geometric mean
|
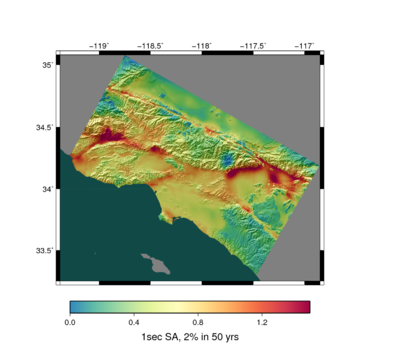 1 sec geometric mean hazard map, all sites |
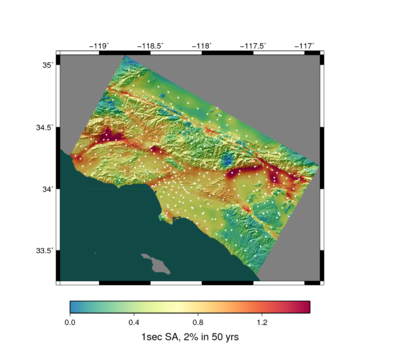 1 sec geometric mean hazard map, all sites, marked |
|
| 2 sec geometric mean
|
 2 sec geometric mean hazard map, all sites |
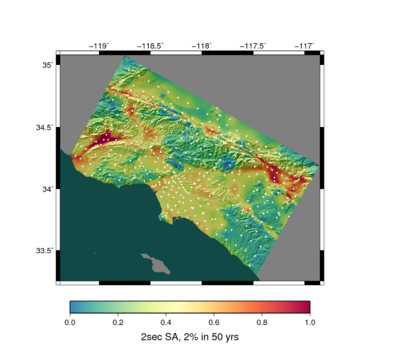 2 sec geometric mean hazard map, all sites, marked |
| 3 sec geometric mean
|
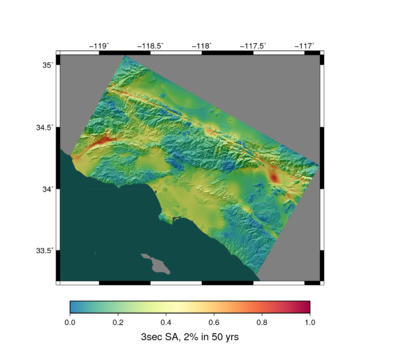 3 sec geometric mean hazard map, all sites |
 3 sec geometric mean hazard map, all sites, marked |
| 5 sec geometric mean
|
 5 sec geometric mean hazard map, all sites |
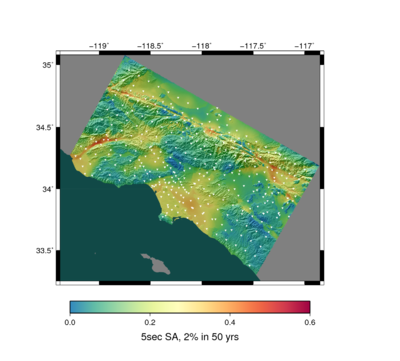 5 sec geometric mean hazard map, all sites, marked |
| 10 sec geometric mean
|
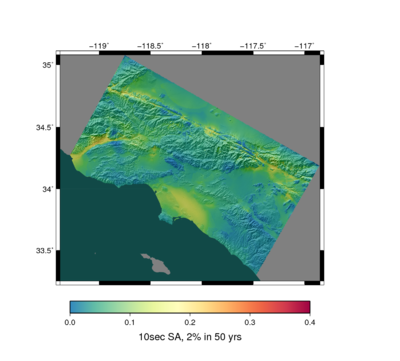 10 sec geometric mean hazard map, all sites |
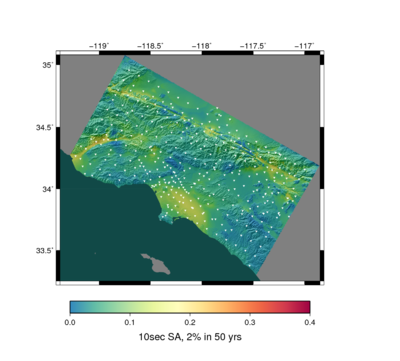 10 sec geometric mean hazard map, all sites, marked |
Comparison Maps
|
|
2 sec
|
3 sec
|
5 sec
|
10 sec
|
| Difference
|
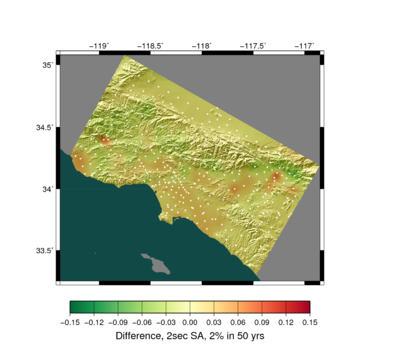 Study 15.12 vs Study 15.4, 2 sec geometric mean, difference map. Warm colors are higher Study 15.12. |
 Study 15.12 vs Study 15.4, 3 sec geometric mean, difference map. Warm colors are higher Study 15.12. |
 Study 15.12 vs Study 15.4, 5 sec geometric mean, difference map. Warm colors are higher Study 15.12. |
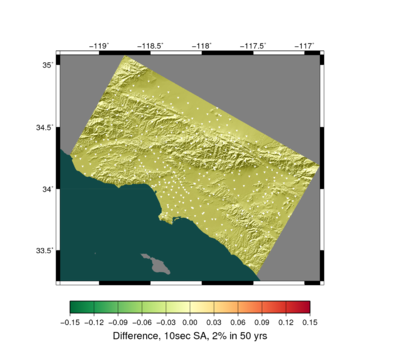 Study 15.12 vs Study 15.4, 10 sec geometric mean, difference map. Warm colors are higher Study 15.12. |
| Ratio
|
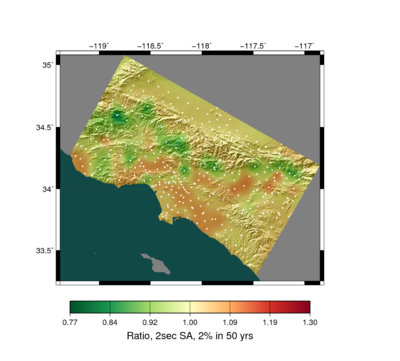 Study 15.12 vs Study 15.4, 2 sec geometric mean, ratio map. Warm colors are higher Study 15.12. |
 Study 15.12 vs Study 15.4, 3 sec geometric mean, ratio map. Warm colors are higher Study 15.12. |
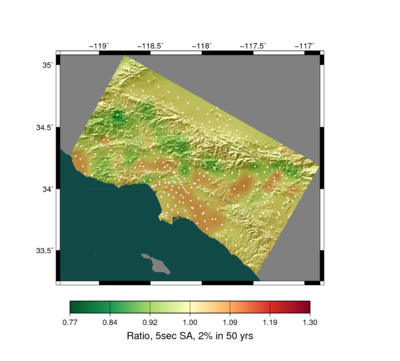 Study 15.12 vs Study 15.4, 5 sec geometric mean, ratio map. Warm colors are higher Study 15.12. |
 Study 15.12 vs Study 15.4, 10 sec geometric mean, ratio map. Warm colors are higher Study 15.12. |


