Hazard Maps
Below are hazard maps from Study 15.12 (150 ppi).
Basic Maps
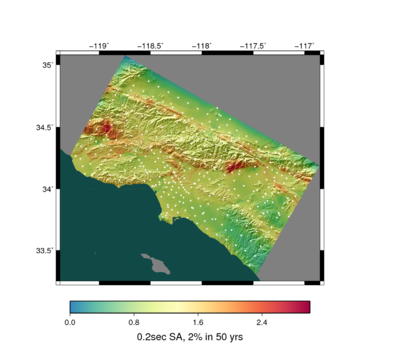
| 0.2 sec geometric mean
|
 0.2 sec geometric mean hazard map, all sites |
 0.2 sec geometric mean hazard map, all sites, marked |
|
| 0.5 sec geometric mean
|
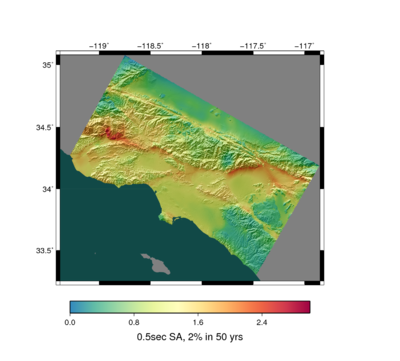 0.5 sec geometric mean hazard map, all sites |
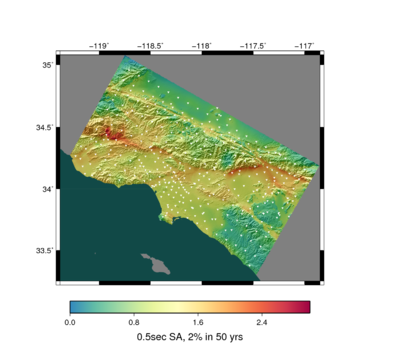 0.5 sec geometric mean hazard map, all sites, marked |
|
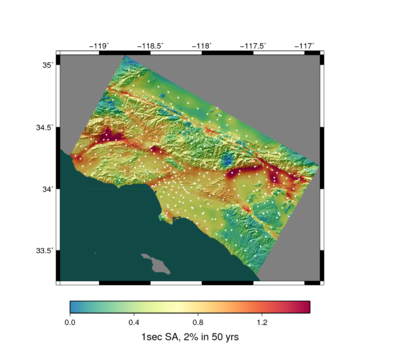
| 1 sec geometric mean
|
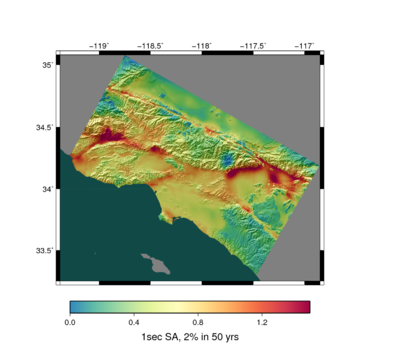 1 sec geometric mean hazard map, all sites |
 1 sec geometric mean hazard map, all sites, marked |
|
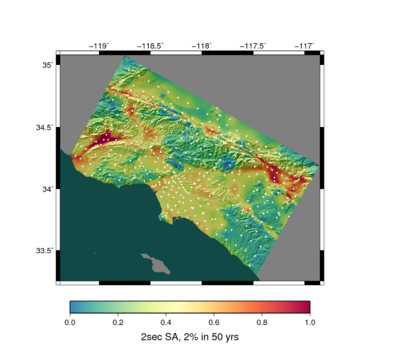
| 2 sec geometric mean
|
 2 sec geometric mean hazard map, all sites |
 2 sec geometric mean hazard map, all sites, marked |
| 3 sec geometric mean
|
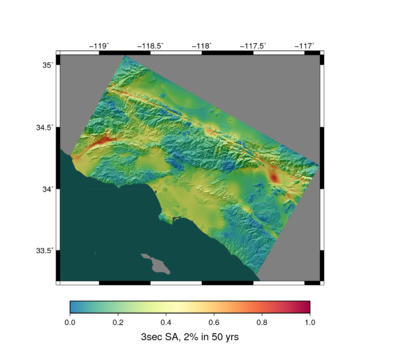 3 sec geometric mean hazard map, all sites |
 3 sec geometric mean hazard map, all sites, marked |
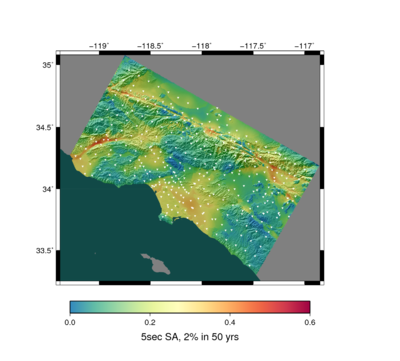
| 5 sec geometric mean
|
 5 sec geometric mean hazard map, all sites |
 5 sec geometric mean hazard map, all sites, marked |
| 10 sec geometric mean
|
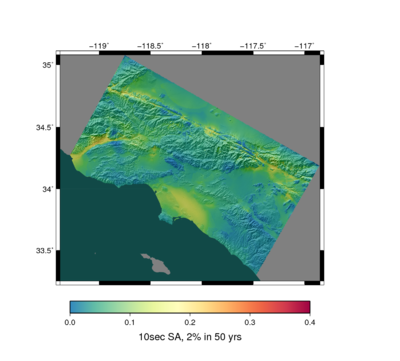 10 sec geometric mean hazard map, all sites |
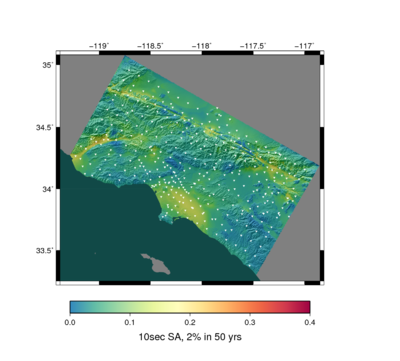 10 sec geometric mean hazard map, all sites, marked |
Comparison Maps
|
|
2 sec
|
3 sec
|
5 sec
|
10 sec
|
| Difference
|
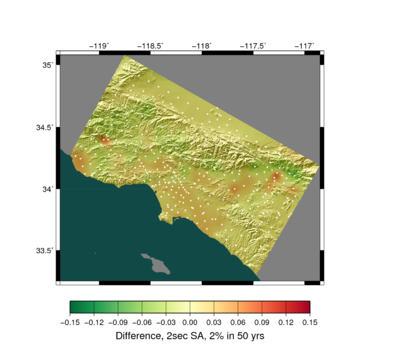 Study 15.12 vs Study 15.4, 2 sec geometric mean, difference map. Warm colors are higher Study 15.12. |
 Study 15.12 vs Study 15.4, 3 sec geometric mean, difference map. Warm colors are higher Study 15.12. |
 Study 15.12 vs Study 15.4, 5 sec geometric mean, difference map. Warm colors are higher Study 15.12. |
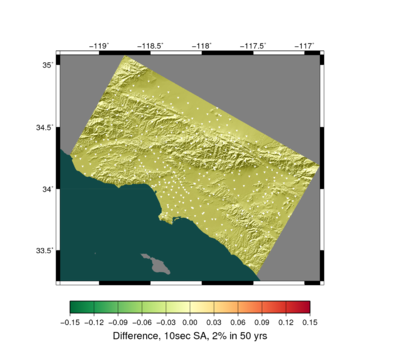 Study 15.12 vs Study 15.4, 10 sec geometric mean, difference map. Warm colors are higher Study 15.12. |
| Ratio
|
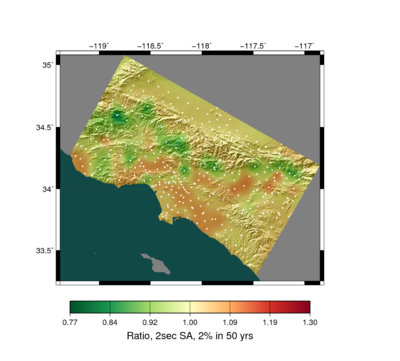 Study 15.12 vs Study 15.4, 2 sec geometric mean, ratio map. Warm colors are higher Study 15.12. |
 Study 15.12 vs Study 15.4, 3 sec geometric mean, ratio map. Warm colors are higher Study 15.12. |
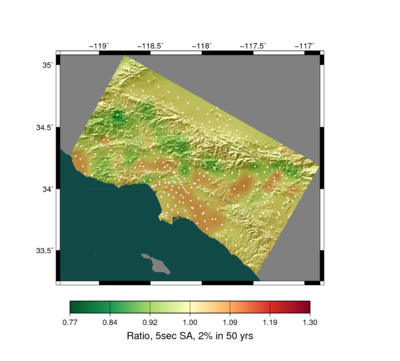 Study 15.12 vs Study 15.4, 5 sec geometric mean, ratio map. Warm colors are higher Study 15.12. |
 Study 15.12 vs Study 15.4, 10 sec geometric mean, ratio map. Warm colors are higher Study 15.12. |
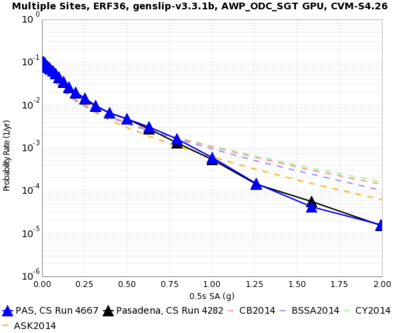
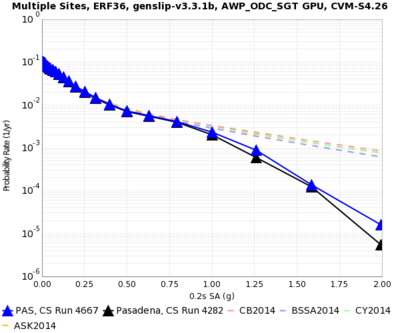
Comparison with NGA results
We would expect the stochastic results to show reasonably good agreement with the deterministic results, but they do not. Here are some data products to investigate this. We've chosen 3 sites with large differences (MRVY, s028, LAPD) and 2 we're familiar with (PAS, USC).
NGA-2 curve comparisons
We replotted the curves using NGA-2s (instead of NGA-1) for comparison, and RotD50.
| Site
|
0.5 sec
|
0.2 sec
|
| USC
|
|
|
| PAS
|
|
|
| MRVY
|
|
|
| s028
|
|
|
| LAPD
|
|
|
Changing RVSIG
We reran PAS using rvsig1 = 0.1; comparison curves are below.
 Blue: rvsig1=0.1, black: rvisg1=-1.0 |
 Blue: rvsig1=0.1, black: rvisg1=-1.0 |
Disaggregations
We did disaggregations for CyberShake and the 4 NGA-2s at 0.5 sec and 0.2 sec, at prob=1e-4. Below are images for each, along with the top 5 contributing sources:
| Data Source
|
0.5 sec value at prob=4e-4
|
0.5 sec plot
|
0.5 sec contributors
|
0.2 sec value at prob=4e-4
|
0.2 sec plot
|
0.2 sec contributors
|
| CyberShake
|
1.08g
|
|
47.0% Verdugo (source 283)
 23.4% Elysian Park (Upper) (source 158)
 12.5% Raymond (source 247)
 10.6% Puente Hills (LA) (source 244)
  5.9% Puente Hills (source 242)
|
|
|
| ASK2014
|
1.24g
|
|
|
|
|
| BSSA2014
|
1.51g
|
|
|
|
|
| CB2014
|
1.59g
|
|
|
|
|
| CY2014
|
1.65g
|
|
|
|
|


