Difference between revisions of "UCVM elevation vs depth, model boundary"
From SCECpedia
Jump to navigationJump to search| Line 64: | Line 64: | ||
{| | {| | ||
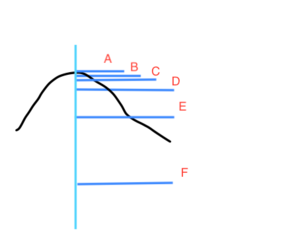
| − | | [[File:sketch.png|thumb|300px| | + | | [[File:sketch.png|thumb|300px|]] |
|} | |} | ||
== Related Links == | == Related Links == | ||
*[[UCVM]] | *[[UCVM]] | ||
Revision as of 23:54, 19 February 2019
Contents
Model Boundary
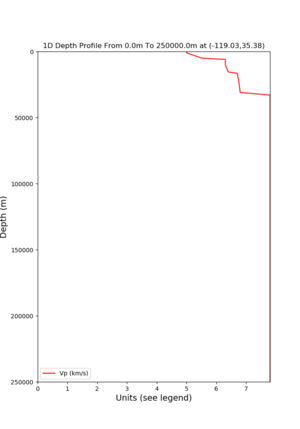
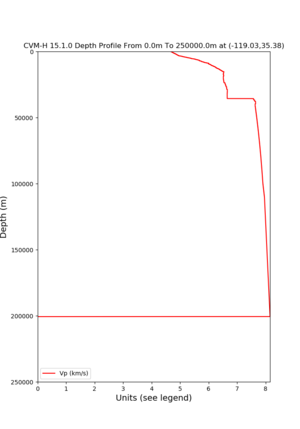
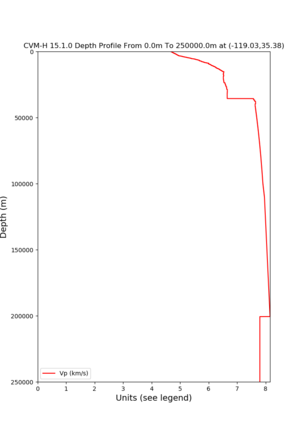
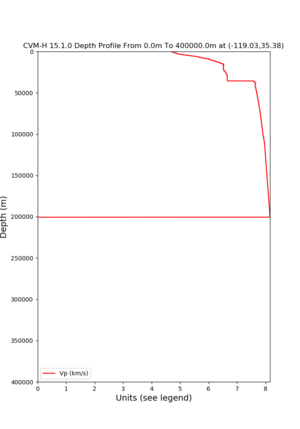
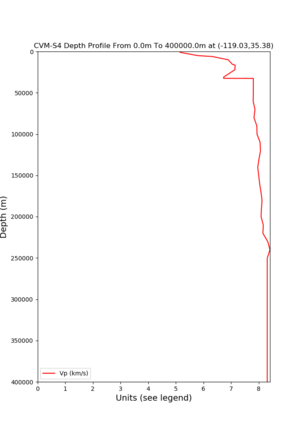
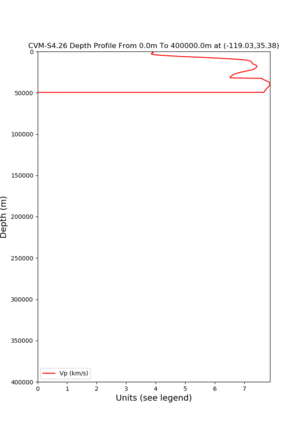
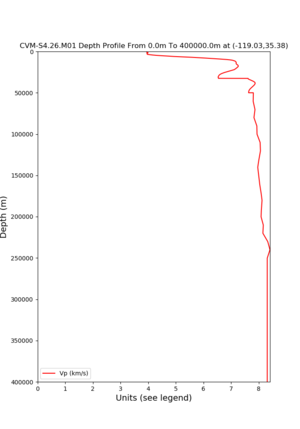
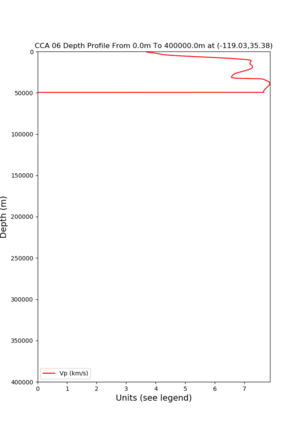
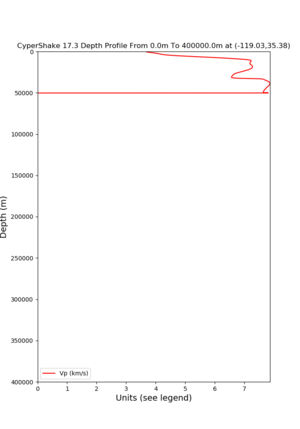
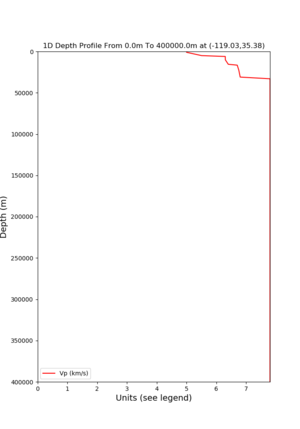
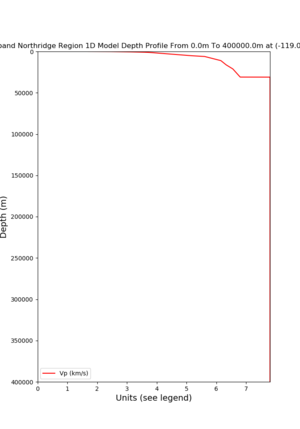
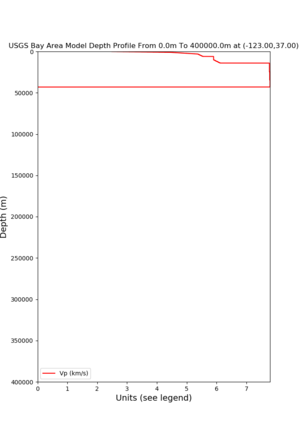
Using depth profile plots to show the bottom of the model boundary in relationship to possible background 1d model
Using (-119.03, 35.38) near Bakersfield, CA
SCEC 1d (1d)
CVM-H v15.1(cvmh) with optional configurable 1d background
./plot_depth_profile.py -d vp -b ${START} -e ${END} -v 10 -c ${MODEL} -s ${LAT},${LON} -o ${MODEL}_${IDX}_depth.png
 START is 0
 END is 250000
 MODEL is cvmh
 IDX is Bakersfield
 LAT is 35.38
 LON is -119.03
How deep are the Models
At -119.03,35.38
At -123,37,0.0,1000000.0
