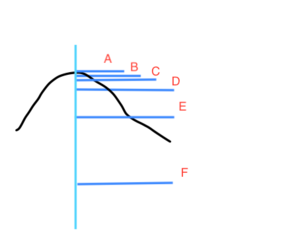
UCVM elevation vs depth, model boundary
From SCECpedia
Contents
Model Boundary
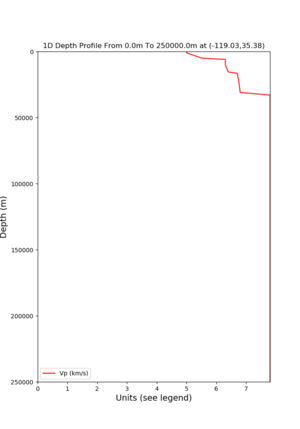
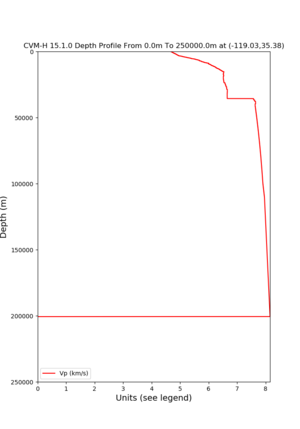
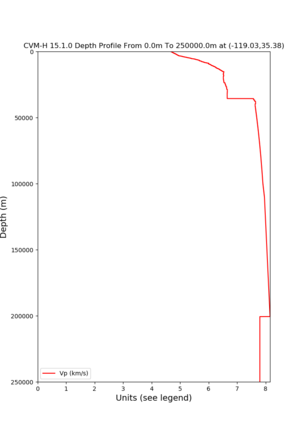
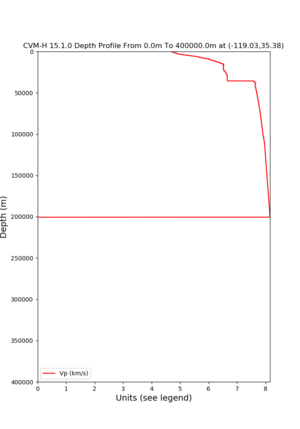
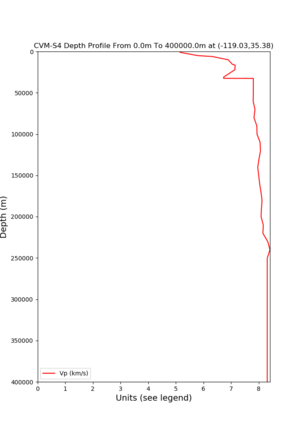
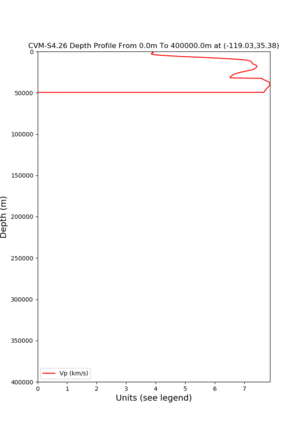
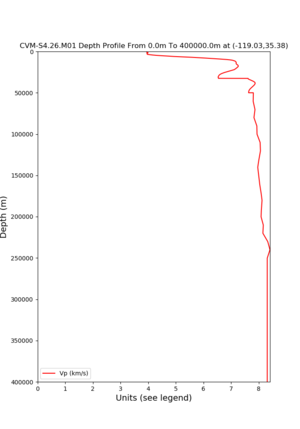
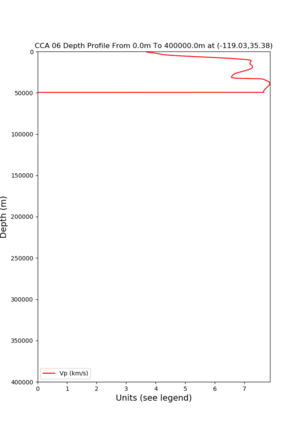
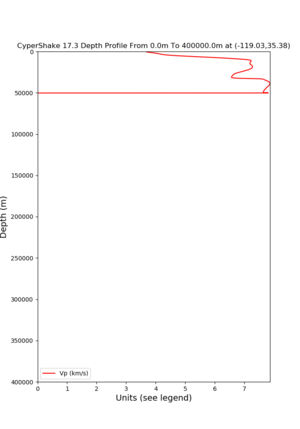
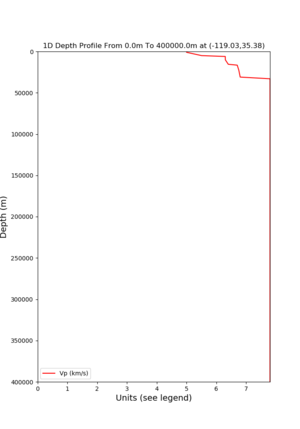
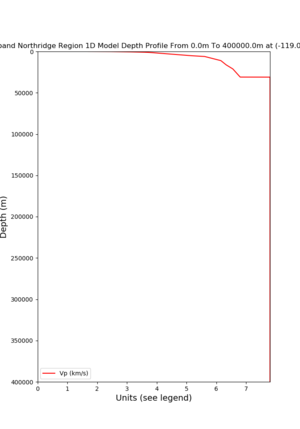
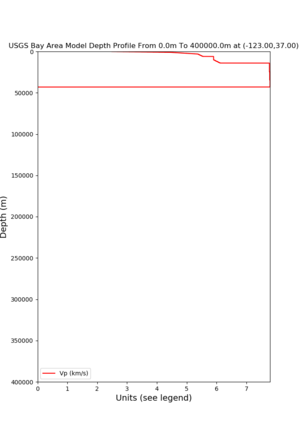
Using depth profile plots to show the bottom of the model boundary in relationship to possible background 1d model
Using (-119.03, 35.38) near Bakersfield, CA
SCEC 1d (1d)
CVM-H v15.1(cvmh) with optional configurable 1d background
./plot_depth_profile.py -d vp -b ${START} -e ${END} -v 10 -c ${MODEL} -s ${LAT},${LON} -o ${MODEL}_${IDX}_depth.png
 START is 0
 END is 250000
 MODEL is cvmh
 IDX is Bakersfield
 LAT is 35.38
 LON is -119.03
How deep are the Models
At -119.03,35.38
At -123,37,0.0,1000000.0
Query by elevation vs by depth
A: elevation 122.589 (depth 0) B: elevation 0 (depth 122.589) C: elevation -300 (depth 412.589)
