Difference between revisions of "Virtual Shaker"
(Created page with 'The response of a building subjected to ground acceleration depends on the magnitude of acceleration and frequency components. The largest, full dynamic earthquake simulation of …') |
|||
| (28 intermediate revisions by 2 users not shown) | |||
| Line 1: | Line 1: | ||
| − | + | CME team at SCEC can produce forward wave propagation data – ground motion time-histories (seismograms) for simulated earthquakes of various magnitudes. The largest, full dynamic earthquake simulation of magnitude 8 on southern San Andreas fault was led by SCEC last year. The seismograms produced by this simulation included frequency components up to 2 Hz. These seismograms can be applied to steel buildings models in virtual environment with [http://www.frame3d.caltech.edu/ Frame3D] software, a building analysis program developed by [http://krishnan.caltech.edu/krishnan/ Swaminathan Krishnan] at California Institute of Technology. Frame3D allows us to perform efficient three-dimensional nonlinear analysis of steel buildings subject to ground acceleration records. | |
| − | + | [[File:Sites.png|256px|thumb|right|Fig 1: Building Sites]] | |
| + | We needed a package to interface ground motion data with structural analysis software to visualize building response to ground motion time-histories. VShaker is set of tools developed at SCEC to provide this interface. It provides formatted ground motion time-history input to Frame3D software, process and visualizes its output data. The building analysis results from Frame3D are processed by VShaker program in two steps. The program first combines structural model, response data from Frame3D and ground motion data to build three-dimensional geometric representations of the structure at specified time intervals. These geometric representations are output as Wavefront OBJ files - a universal file format supported by major 3D rendering programs. In the next step VShaker can combine these snapshots to produce simple animations of structural motion with various viewpoints. | ||
| − | + | [[File:M8-nr-nc-front.png|256px|thumb|right|Fig 2: 18-Story Northridge building (Front view).]] | |
| − | + | [[File:M8-nr-nc-side.png|256px|thumb|right|Fig 3: 18-Story Northridge building (Side view).]] | |
| + | [[File:M8-nr-nc-top-p1.png|256px|thumb|right|Fig 4: 18-Story Northridge building (Top view).]] | ||
| + | |||
| + | We are currently conducting a study to evaluate the response of two types of steel buildings with fundamental periods of 0.63 and 4.54 seconds subjected to acceleration records from SCEC M8 Simulation. These buildings are being simulated at eight locations spread out across Southern California. The locations were chosen based on a previous study conducted by Krishnan et al., on response of tall steel buildings for magnitude 7.9 1857 southern San Andreas Earthquake. The choice of building locations will allow us to compare the results of building response from our study to those reported in the earlier study. The tall steel building with fundamental period of 4.54 seconds had comparable responses to those reported in Mw 7.9 earthquake study. | ||
| + | |||
| + | VShaker has the potential to produce animations of structural motion after significant earthquake to aid in identification of damage to structural elements. It can also be used to effectively visualize performance of proposed building models to simulated earthquakes. | ||
| + | |||
| + | == Caltech Virtual Shaker and Frame3D == | ||
| + | |||
| + | *[http://www.frame3d.caltech.edu/ Caltech Civil Engineering Frame3D] | ||
| + | *[https://virtualshaker.caltech.edu/ Caltech Civil Engineering Virtual Shaker] | ||
| + | *[http://www.frame3d.caltech.edu/bldgdb.html Building Design for M8 Study] | ||
| + | |||
| + | == Software Design == | ||
| + | |||
| + | * [[VShaker_Metadata]] | ||
| + | * Convert Virtual Shaker output to OBJ Files. | ||
| + | * Map damage data from Virtual Shaker Results to OBJ meshes. | ||
| + | * Render OBJ files. | ||
| + | |||
| + | == M8 Building Response Study == | ||
| + | |||
| + | Building used in M8 response study is described here: | ||
| + | *[https://virtualshaker.caltech.edu/index.php?todo=editview_strucdesgn&type=public&id=4 Building In Use] | ||
| + | *Building Sites: | ||
| + | **Site 1: Thousand Oaks (34.18750, -118.87500) | ||
| + | **Site 2: Northridge (34.21875, -118.53125) | ||
| + | **Site 3: West Los Angeles (34.03125, -118.40625) | ||
| + | **Site 4: Downtown Los Angeles (34.06250,-118.25000) | ||
| + | **Site 5: Baldwin Park (34.09375, -118.00000) | ||
| + | **Site 6: Anaheim (33.84375, -117.90625) | ||
| + | **Site 7: Long Beach (33.78125, -118.18750) | ||
| + | **Site 8: Santa Ana (33.75000, -117.87500) | ||
| + | **Site 9: SCEC/USC (34.01940,-118.28619) | ||
| + | |||
| + | Information on the SCEC M8 Simulation: | ||
| + | *[http://scec.usc.edu/websims/repo/m8/ws-index.html M8 Data on Websims] | ||
| + | *[[M8]] Project Home Page | ||
| + | |||
| + | M8 seismograms used in Building Response Study from Websims | ||
| + | *[http://scec.usc.edu/websims Websims] | ||
Latest revision as of 18:30, 29 September 2010
CME team at SCEC can produce forward wave propagation data – ground motion time-histories (seismograms) for simulated earthquakes of various magnitudes. The largest, full dynamic earthquake simulation of magnitude 8 on southern San Andreas fault was led by SCEC last year. The seismograms produced by this simulation included frequency components up to 2 Hz. These seismograms can be applied to steel buildings models in virtual environment with Frame3D software, a building analysis program developed by Swaminathan Krishnan at California Institute of Technology. Frame3D allows us to perform efficient three-dimensional nonlinear analysis of steel buildings subject to ground acceleration records.
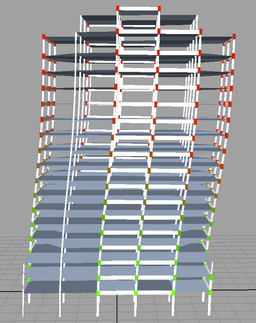
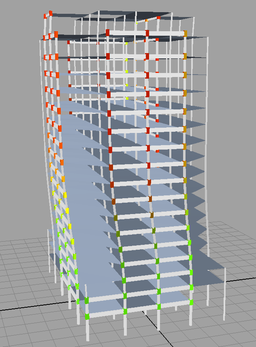
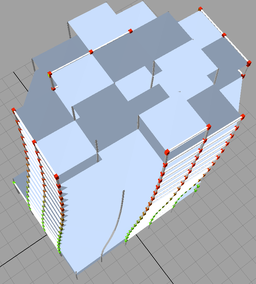
We needed a package to interface ground motion data with structural analysis software to visualize building response to ground motion time-histories. VShaker is set of tools developed at SCEC to provide this interface. It provides formatted ground motion time-history input to Frame3D software, process and visualizes its output data. The building analysis results from Frame3D are processed by VShaker program in two steps. The program first combines structural model, response data from Frame3D and ground motion data to build three-dimensional geometric representations of the structure at specified time intervals. These geometric representations are output as Wavefront OBJ files - a universal file format supported by major 3D rendering programs. In the next step VShaker can combine these snapshots to produce simple animations of structural motion with various viewpoints.
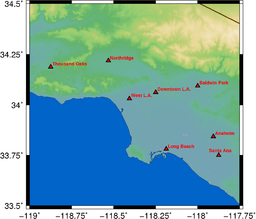
We are currently conducting a study to evaluate the response of two types of steel buildings with fundamental periods of 0.63 and 4.54 seconds subjected to acceleration records from SCEC M8 Simulation. These buildings are being simulated at eight locations spread out across Southern California. The locations were chosen based on a previous study conducted by Krishnan et al., on response of tall steel buildings for magnitude 7.9 1857 southern San Andreas Earthquake. The choice of building locations will allow us to compare the results of building response from our study to those reported in the earlier study. The tall steel building with fundamental period of 4.54 seconds had comparable responses to those reported in Mw 7.9 earthquake study.
VShaker has the potential to produce animations of structural motion after significant earthquake to aid in identification of damage to structural elements. It can also be used to effectively visualize performance of proposed building models to simulated earthquakes.
Caltech Virtual Shaker and Frame3D
- Caltech Civil Engineering Frame3D
- Caltech Civil Engineering Virtual Shaker
- Building Design for M8 Study
Software Design
- VShaker_Metadata
- Convert Virtual Shaker output to OBJ Files.
- Map damage data from Virtual Shaker Results to OBJ meshes.
- Render OBJ files.
M8 Building Response Study
Building used in M8 response study is described here:
- Building In Use
- Building Sites:
- Site 1: Thousand Oaks (34.18750, -118.87500)
- Site 2: Northridge (34.21875, -118.53125)
- Site 3: West Los Angeles (34.03125, -118.40625)
- Site 4: Downtown Los Angeles (34.06250,-118.25000)
- Site 5: Baldwin Park (34.09375, -118.00000)
- Site 6: Anaheim (33.84375, -117.90625)
- Site 7: Long Beach (33.78125, -118.18750)
- Site 8: Santa Ana (33.75000, -117.87500)
- Site 9: SCEC/USC (34.01940,-118.28619)
Information on the SCEC M8 Simulation:
- M8 Data on Websims
- M8 Project Home Page
M8 seismograms used in Building Response Study from Websims


