
|
|
| User | Max Uplift (m) | Max Subsidence (m) | Vertical | Horizontal | Normal | Data (ZIP) |
| barall | 0.920 | 0.430 | View plot | View plot | View plot | Raw data |
| dliu.3 | 0.928 | 0.425 | View plot | View plot | View plot | Raw data |
| imran | 0.931 | 0.490 | View plot | View plot | View plot | Raw data |
| kutschera.2 | 0.936 | 0.437 | View plot | View plot | View plot | Raw data |
| li | 0.977 | 0.482 | View plot | View plot | View plot | Raw data |
| ma | 0.920 | 0.431 | View plot | View plot | View plot | Raw data |
| wzhang.2 | 0.915 | 0.431 | View plot | View plot | View plot | Raw data |
| yang.2 | 0.888 | 0.446 | View plot | View plot | View plot | Raw data |
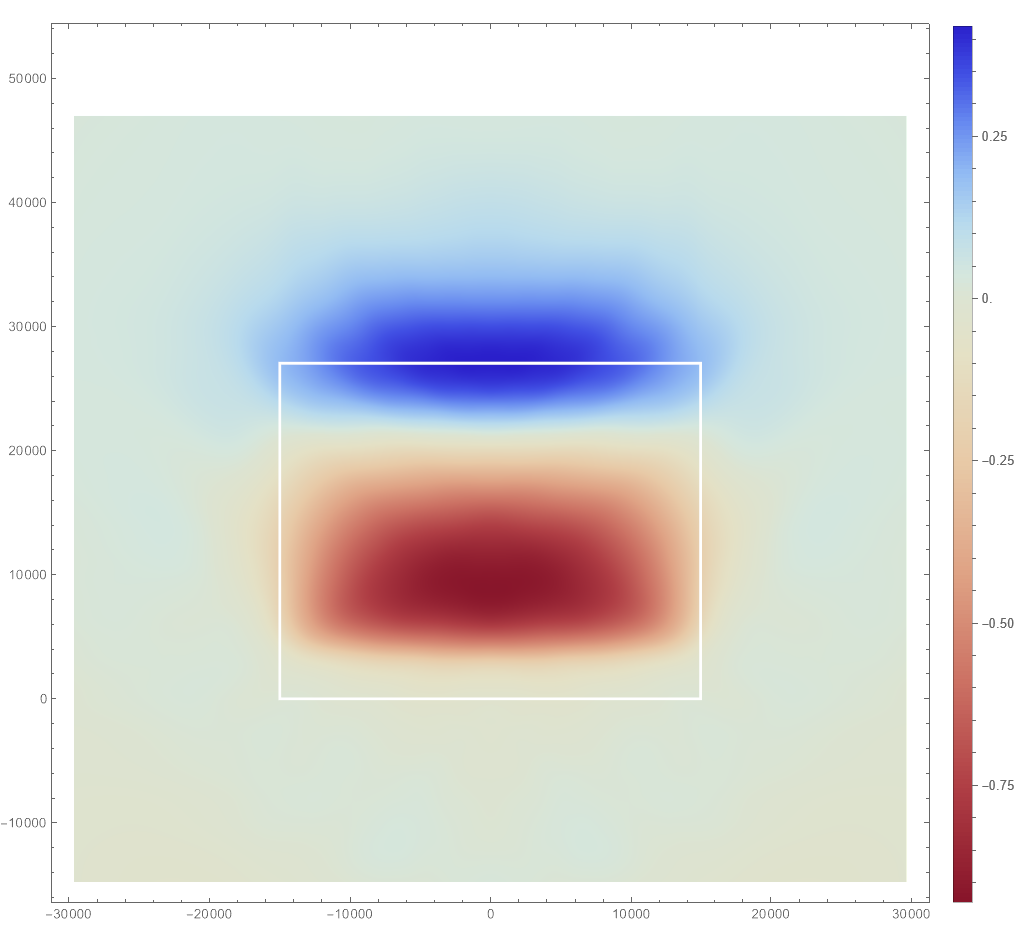
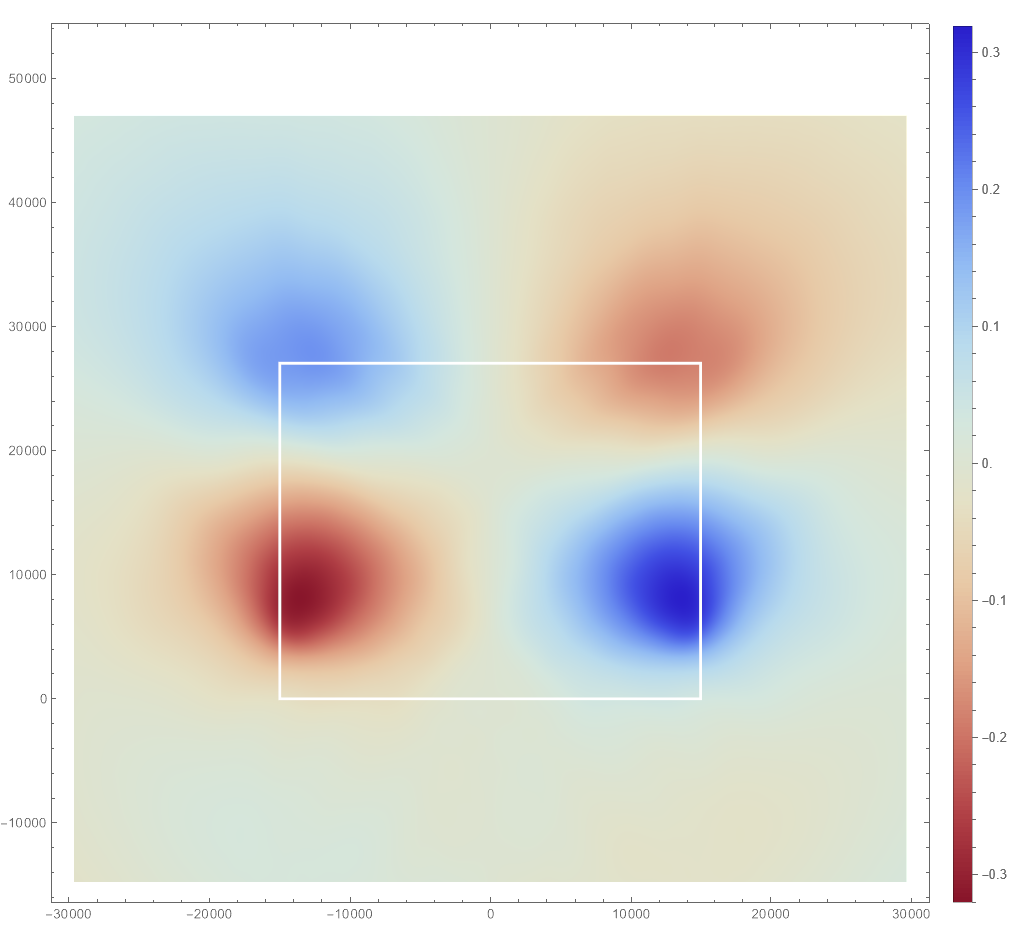
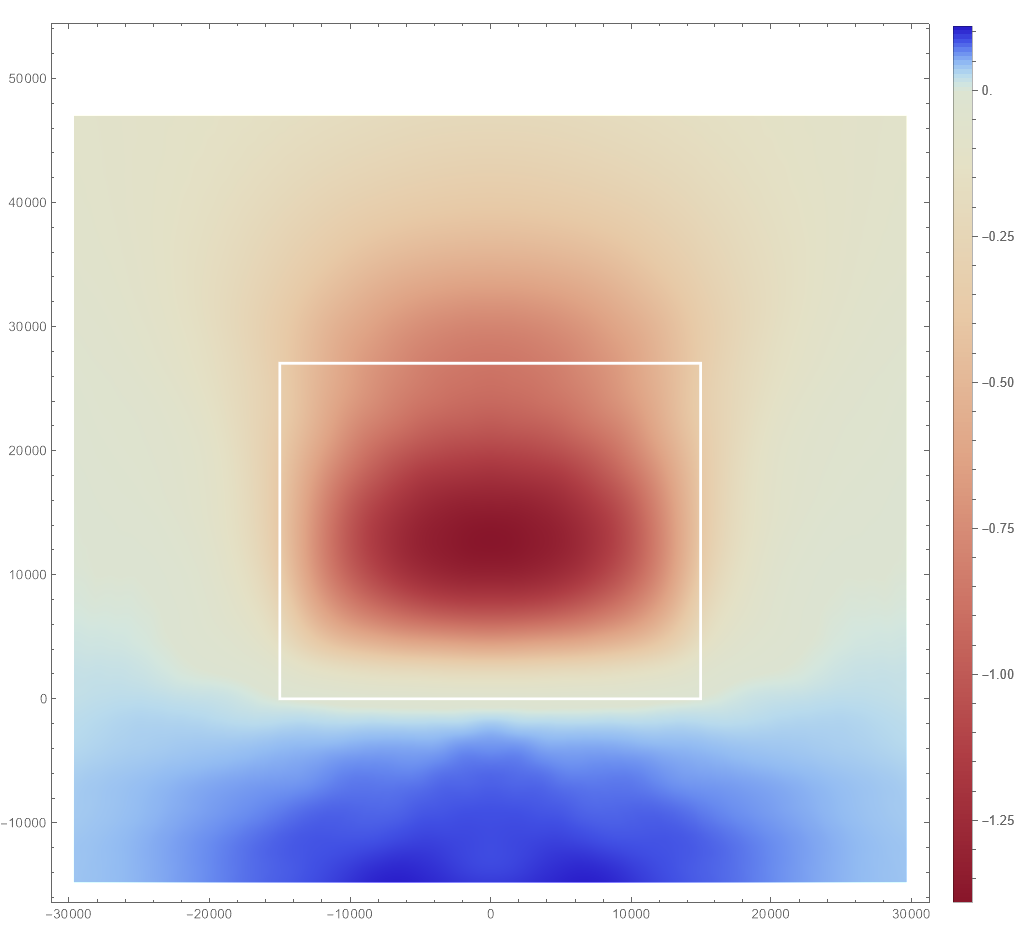
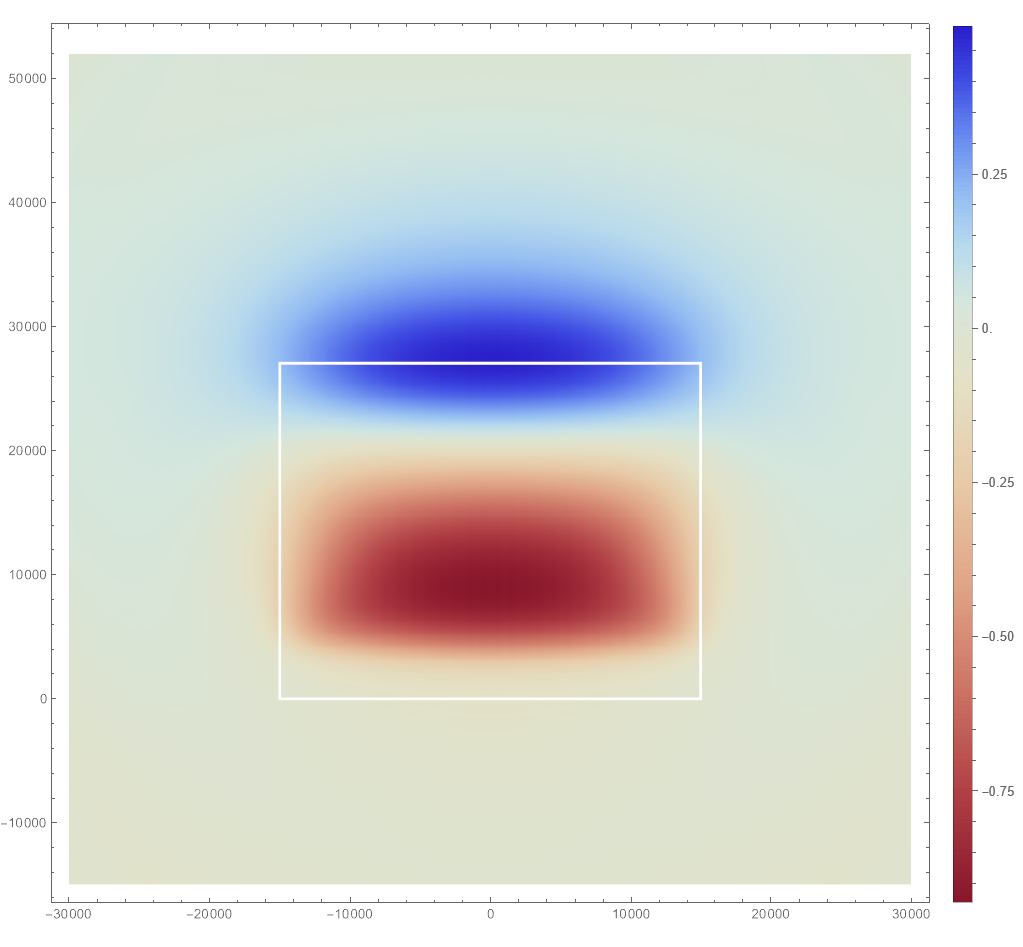
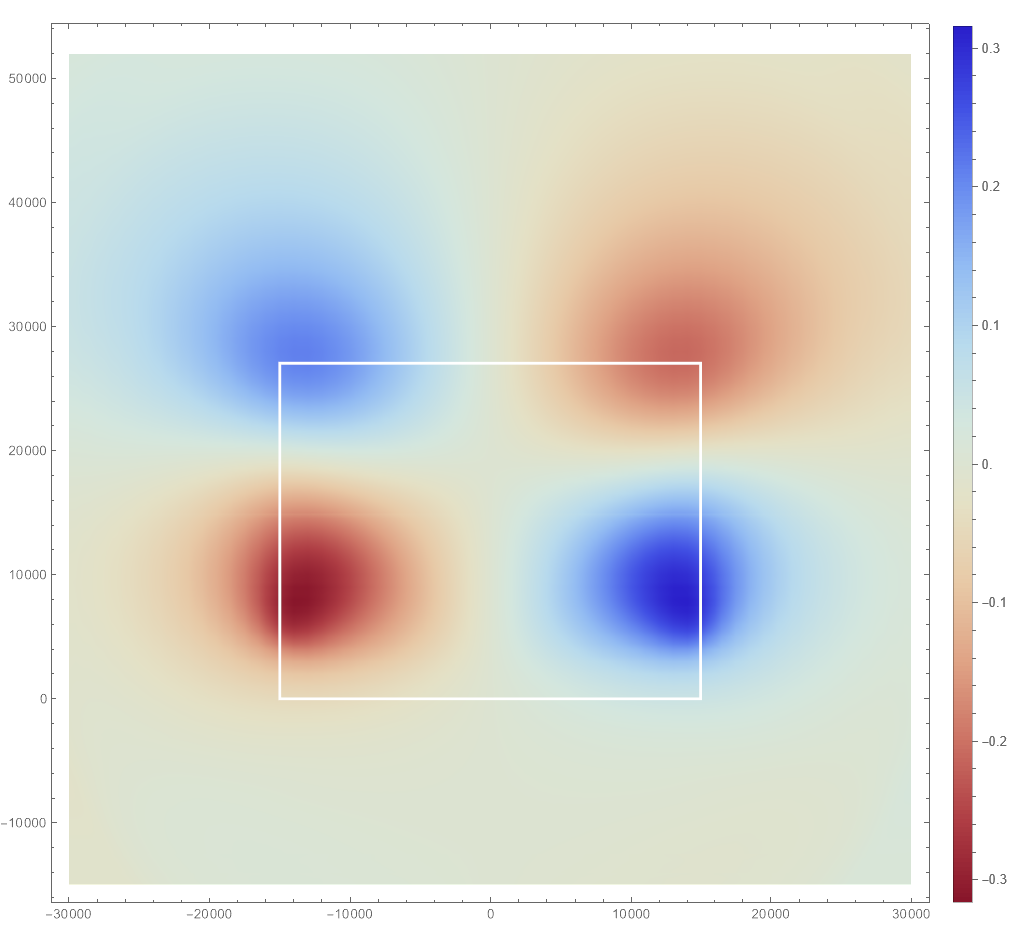
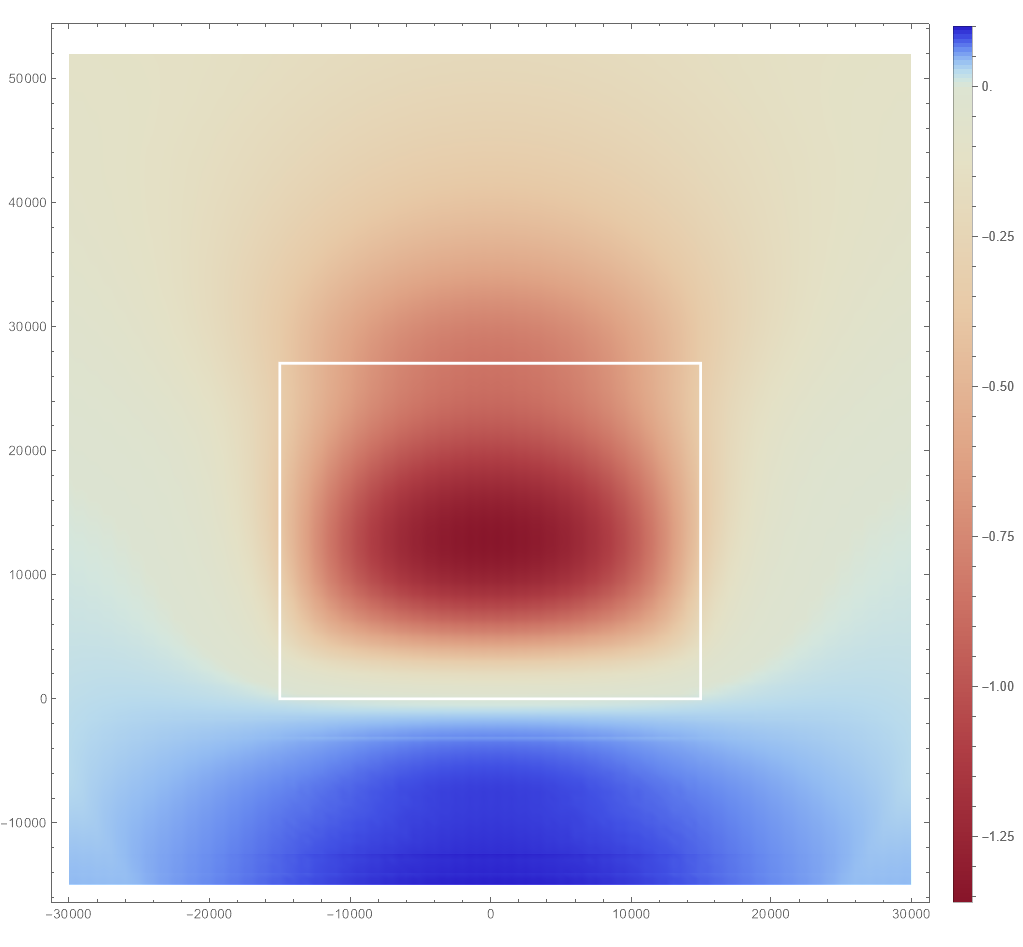
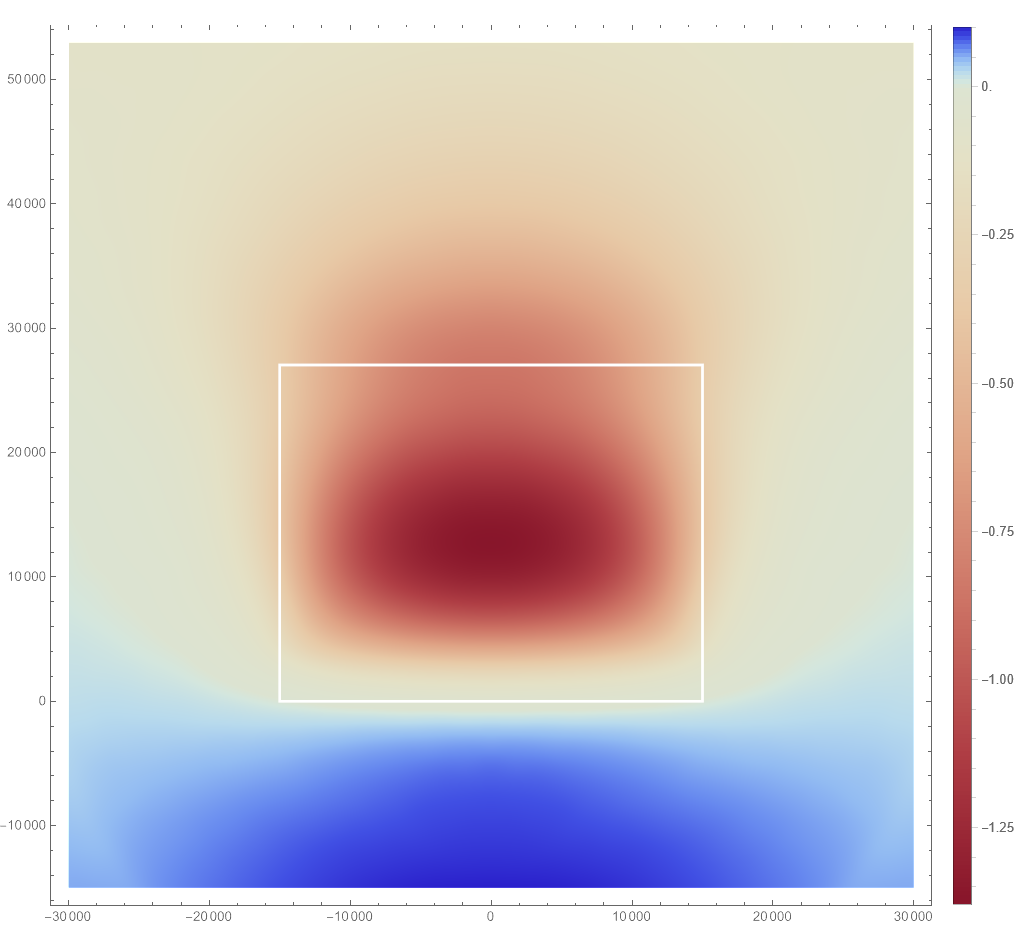
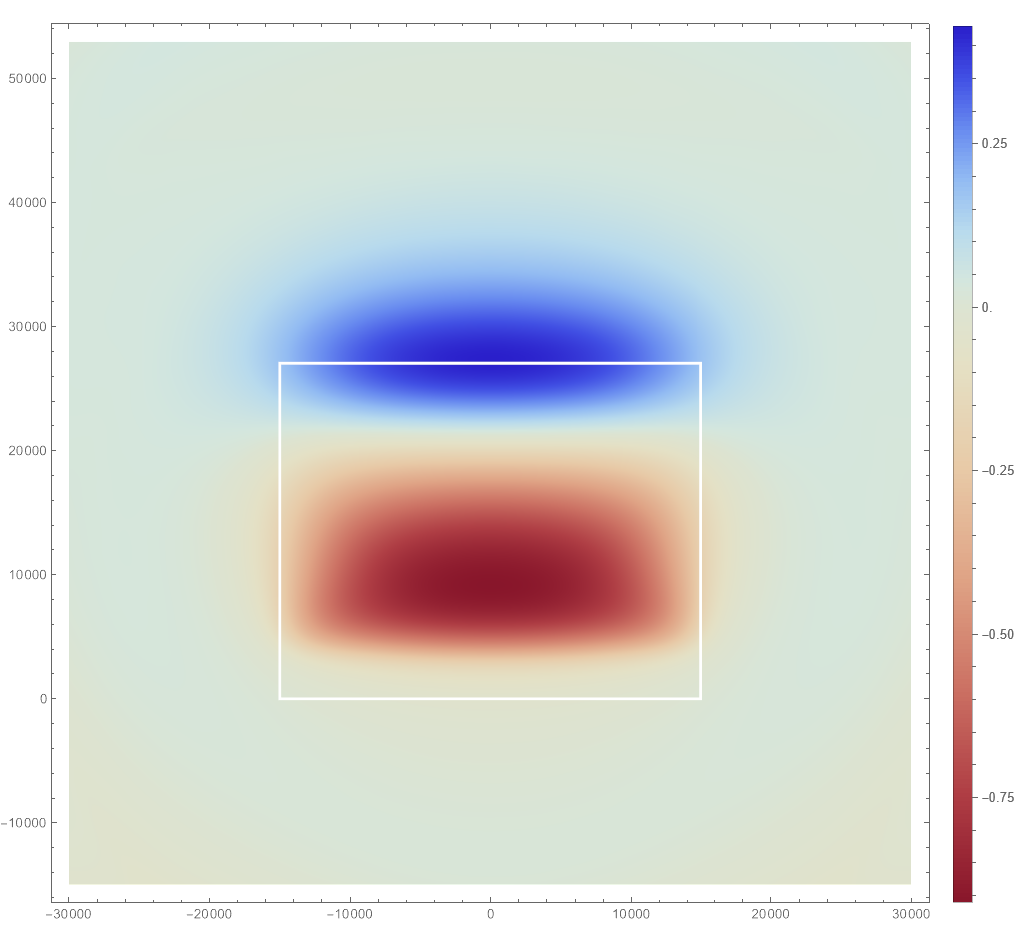
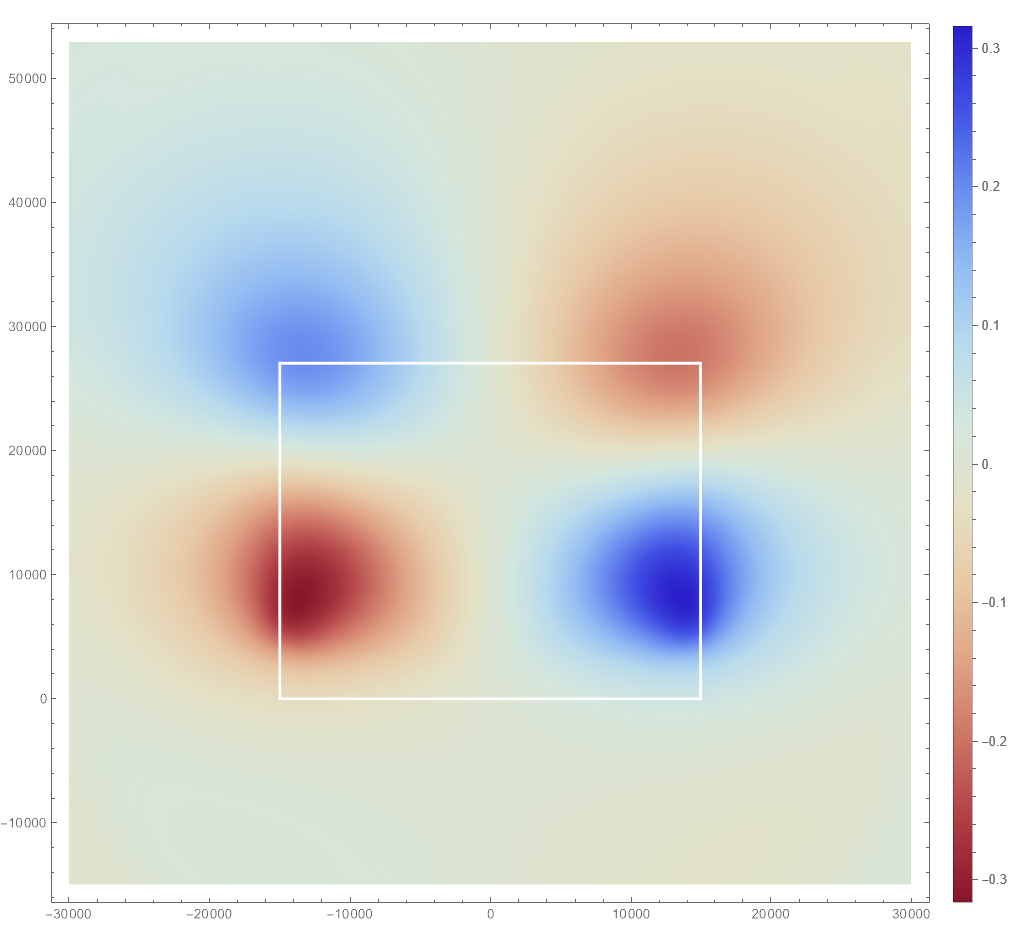
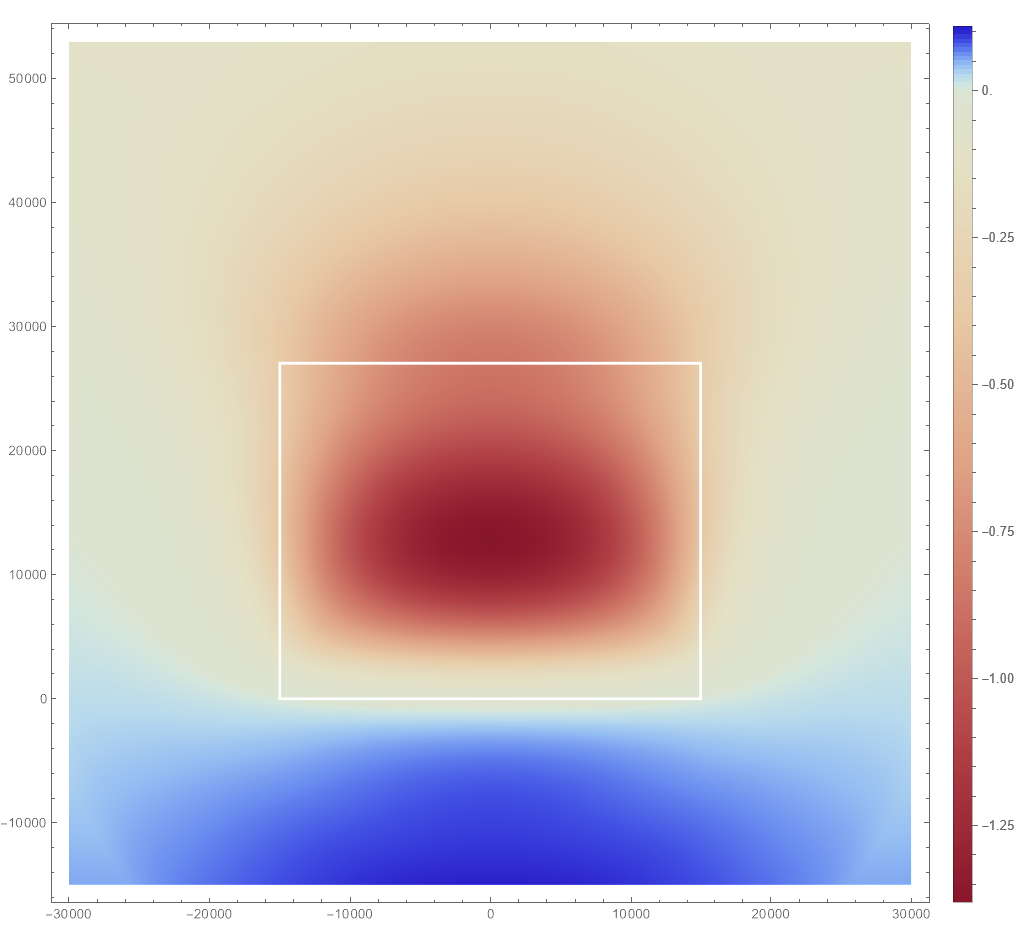
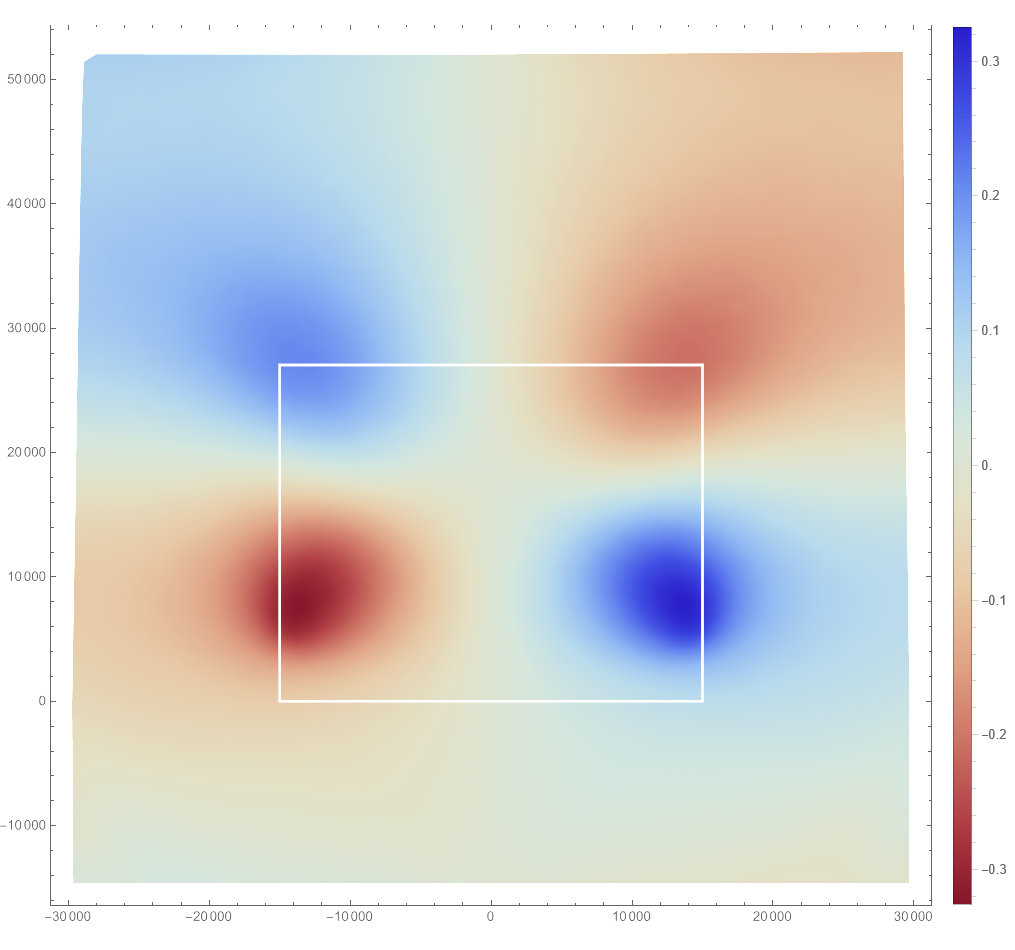
Plots show the Earth's surface in map view; the horizontal axis is distance along strike, and the vertical axis is distance perpendicular to the fault trace. Colors show the displacement of the Earth's surface in meters. The white rectangle is the vertical projection of the 15-degree dispping fault surface; the bottom edge of the rectangle is the fault trace.
The "Vertical" plot shows vertical displacement. Positive values (blue) denote downward displacement (subsidence); negative value (red) denote upward displacement (uplift).
The "Horizontal" plot shows horizontal displaement parallel to the fault trace. Positive values (blue) denote displacement to the right; negative values (red) denote displacement to the left.
The "Normal" plot shows horizontal displacement perpendicular to the fault trace. Positive values (blue) denote displacement toward the hanging wall side (toward the top of the image); negative values (red) denote displament toward the footwall side (toward the bottom of the image).
barall (Michael Barall - FaultMod - 50 m)
dliu.3 (EQdyna.v5.3.3.50m.dliu.largeDomain)
imran (Abdullah Al Imran - Finite Difference - FD-Q-WaveLab)
kutschera.2 (Fabian Kutschera - DG - SeisSol v1.2.0 - fault 200 m - o4)
li (Duo Li - DG, h200,o4)
ma (Shuo Ma - Finite Element - MAFE - 50 m on fault)
wzhang.2 (Wenqiang Zhang - Mixed-Flux DG - drdg3d - 200m,O4)
yang.2 (Hongfeng Yang-PyLith-Fault 75m-Larger Domain)
Back to the Documentation for TPV36 and TPV37.
This page was last updated or reviewed on 2 September 2025.