Uncategorized files
From SCECpedia
Jump to navigationJump to search
Showing below up to 50 results in range #4,101 to #4,150.
-
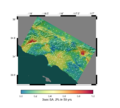 Study 13.4 AWP CVMS with sites new color.150.png 1,500 × 1,354; 1,022 KB
-
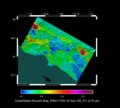 Study 13.4 RWG CVMH.150.png 1,500 × 1,354; 1.17 MB
-
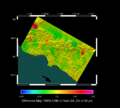 Study 13.4 RWG CVMH diff sites.150.png 1,500 × 1,354; 1.08 MB
-
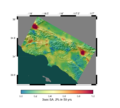 Study 13.4 RWG CVMH new color.150.png 1,500 × 1,354; 1.01 MB
-
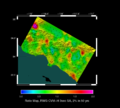 Study 13.4 RWG CVMH ratio sites.150.png 1,500 × 1,354; 1.11 MB
-
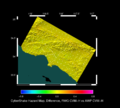 Study 13.4 RWG CVMH vs AWP CVMH diff.png 3,000 × 2,708; 2.95 MB
-
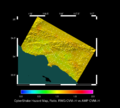 Study 13.4 RWG CVMH vs AWP CVMH ratio.png 3,000 × 2,708; 3.09 MB
-
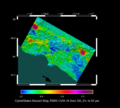 Study 13.4 RWG CVMH with sites.150.png 1,500 × 1,354; 1.19 MB
-
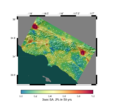 Study 13.4 RWG CVMH with sites new color.150.png 1,500 × 1,354; 1.01 MB
-
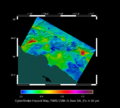 Study 13.4 RWG CVMS.150.png 1,500 × 1,354; 1.15 MB
-
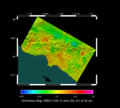 Study 13.4 RWG CVMS diff sites.150.png 1,500 × 1,354; 1.08 MB
-
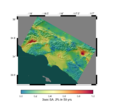 Study 13.4 RWG CVMS new color.150.png 1,500 × 1,354; 1,018 KB
-
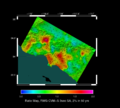 Study 13.4 RWG CVMS ratio sites.150.png 1,500 × 1,354; 1.09 MB
-
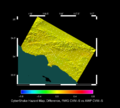 Study 13.4 RWG CVMS vs AWP CVMS diff.png 3,000 × 2,708; 2.96 MB
-
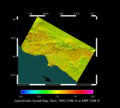 Study 13.4 RWG CVMS vs AWP CVMS ratio.png 3,000 × 2,708; 3.16 MB
-
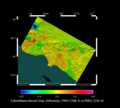 Study 13.4 RWG CVMS vs RWG CVMH diff.png 3,000 × 2,708; 3.34 MB
-
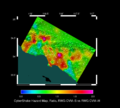 Study 13.4 RWG CVMS vs RWG CVMH ratio.png 3,000 × 2,708; 3.5 MB
-
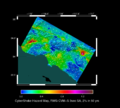 Study 13.4 RWG CVMS with sites.150.png 1,500 × 1,354; 1.18 MB
-
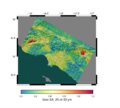 Study 13.4 RWG CVMS with sites new color.150.png 1,500 × 1,354; 1,020 KB
-
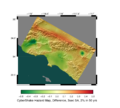 Study 14.2 BBP 1D vs CVMS426 diff.png 1,500 × 1,354; 1.35 MB
-
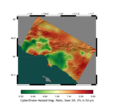 Study 14.2 BBP 1D vs CVMS426 ratio.png 1,500 × 1,354; 1.33 MB
-
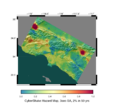 Study 14.2 CPU CVMH noGTL.150.png 1,500 × 1,354; 1.43 MB
-
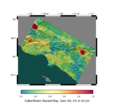 Study 14.2 CPU CVMH noGTL with sites.150.png 1,500 × 1,354; 1.45 MB
-
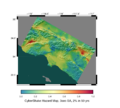 Study 14.2 CPU CVMS426.150.png 1,500 × 1,354; 1.41 MB
-
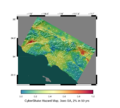 Study 14.2 CPU CVMS426 with sites.150.png 1,500 × 1,354; 1.43 MB
-
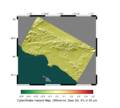 Study 14.2 CPU vs GPU CVMS426 diff.png 1,500 × 1,354; 1.11 MB
-
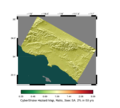 Study 14.2 CPU vs GPU CVMS426 ratio.png 1,500 × 1,354; 1.11 MB
-
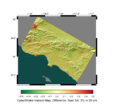 Study 14.2 CVMH noGTL vs CVMH diff.png 1,500 × 1,354; 1.3 MB
-
 Study 14.2 CVMH noGTL vs CVMH ratio.png 1,500 × 1,354; 1.34 MB
-
 Study 14.2 GPU BBP 1D.150.png 1,500 × 1,354; 1.34 MB
-
 Study 14.2 GPU BBP 1D with sites.150.png 1,500 × 1,354; 1.36 MB
-
 Study 14.2 GPU CVMS426.150.png 1,500 × 1,354; 1.41 MB
-
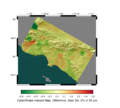 Study 14.2 GPU CVMS426 vs CPU CVMH diff.png 1,500 × 1,354; 1.34 MB
-
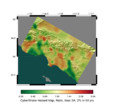 Study 14.2 GPU CVMS426 vs CPU CVMH ratio.png 1,500 × 1,354; 1.37 MB
-
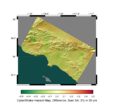 Study 14.2 GPU CVMS426 vs CPU CVMS diff.png 1,500 × 1,354; 1.32 MB
-
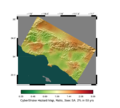 Study 14.2 GPU CVMS426 vs CPU CVMS ratio.png 1,500 × 1,354; 1.36 MB
-
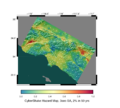 Study 14.2 GPU CVMS426 with sites.150.png 1,500 × 1,354; 1.43 MB
-
 Study 15 4 no names.kml ; 43 KB
-
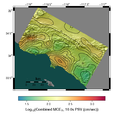 Study 15 4 rotd100 10s combined mcer psv contours.png 595 × 585; 314 KB
-
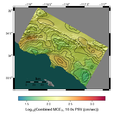 Study 15 4 rotd100 10s combined mcer weight avg psv contours.png 595 × 585; 314 KB
-
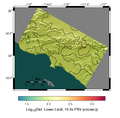 Study 15 4 rotd100 10s det lower limit psv contours.png 595 × 585; 294 KB
-
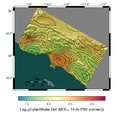 Study 15 4 rotd100 10s det mcer psv contours.png 595 × 585; 316 KB
-
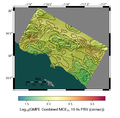 Study 15 4 rotd100 10s gmpe combined mcer psv contours.png 595 × 585; 317 KB
-
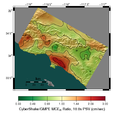 Study 15 4 rotd100 10s gmpe combined ratio contours.png 595 × 585; 324 KB
-
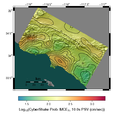 Study 15 4 rotd100 10s prob mcer psv contours.png 595 × 585; 315 KB
-
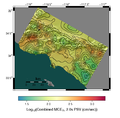 Study 15 4 rotd100 2s combined mcer psv contours.png 595 × 585; 328 KB
-
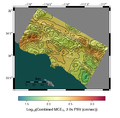 Study 15 4 rotd100 2s combined mcer weight avg psv contours.png 595 × 585; 325 KB
-
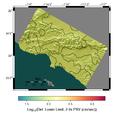 Study 15 4 rotd100 2s det lower limit psv contours.png 595 × 585; 299 KB
-
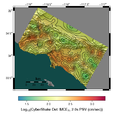 Study 15 4 rotd100 2s det mcer psv contours.png 595 × 585; 334 KB
-
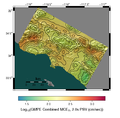 Study 15 4 rotd100 2s gmpe combined mcer psv contours.png 595 × 585; 325 KB


