Difference between revisions of "UCVM sfcvm geomodelgrid"
| (7 intermediate revisions by the same user not shown) | |||
| Line 485: | Line 485: | ||
| [[FILE:sfcvm-gabbro-interpolate-h2.png|thumb|400px|interpolated gabbro]] | | [[FILE:sfcvm-gabbro-interpolate-h2.png|thumb|400px|interpolated gabbro]] | ||
| [[FILE:sfcvm-gabbro-nearest-h2.png|thumb|400px|nearest gabbro]] | | [[FILE:sfcvm-gabbro-nearest-h2.png|thumb|400px|nearest gabbro]] | ||
| + | |} | ||
| + | |||
| + | == Under the water and near the water step-down search logic == | ||
| + | |||
| + | <pre> | ||
| + | zSurf from geomodelgrids_squery_queryTopoBathyElevation, | ||
| + | |||
| + | zSquashed is new squashed elevation | ||
| + | |||
| + | make initial geomodelgrids_squery_query call, | ||
| + | |||
| + | do step-down search iterations | ||
| + | if (query failed and zSurf < 0) | ||
| + | or | ||
| + | if (zSquashed < zSurf || zSurf < 0) and (vp != NODATA) and (vs == NODATA) | ||
| + | </pre> | ||
| + | |||
| + | |||
| + | == Gabbro in Sierra == | ||
| + | |||
| + | <pre> | ||
| + | |||
| + | In regional area, | ||
| + | zone_ids : "GV gabbro":3 | ||
| + | |||
| + | </pre> | ||
| + | |||
| + | From Brad, sfcvm's regional area | ||
| + | {| | ||
| + | | [[FILE:sfcvm-regional-zone.png|thumb|400px| sfcvm region zones]] | ||
| + | |} | ||
| + | |||
| + | |||
| + | {| | ||
| + | | [[FILE:sfcvm-sierra-gabbro-region2.png|thumb|400px| Sierra region]] | ||
| + | | [[FILE:sfcvm-sierra-no-region.png|thumb|400px| Sierra region]] | ||
| + | |} | ||
| + | |||
| + | <pre> | ||
| + | PROJ_LIB=../model/UCVM_TARGET/lib/proj/share/proj PATH=/usr/local/share/anaconda2/bin:/usr/local/share/anaconda2 | ||
| + | /condabin:/usr/local/sbin:/usr/local/bin:/usr/sbin:/usr/bin PYTHONPATH=../model/UCVM_TARGET/ucvm_plotting plot_d | ||
| + | epth_profile.py -n ../model/UCVM_TARGET/conf/ucvm.conf -i ../model/UCVM_TARGET -d vs,vp,density -c sfcvm -o ../ | ||
| + | result/UCVM_66661243_v.png -C 'San Francisco Bay Velocity Model' -v 100 -b 0 -s 36.9082,-119.4763 -e 30000</pre> | ||
| + | |||
| + | {| | ||
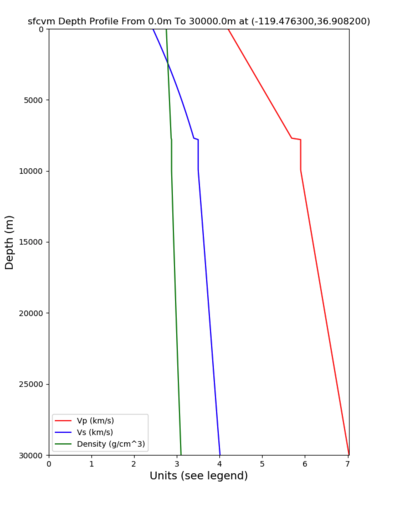
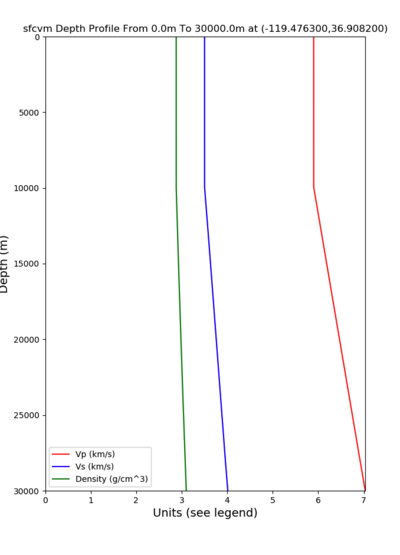
| + | | [[FILE:sfcvm-sierra-gabbro-depth.png|thumb|400px| gabbro processing depth profile]] | ||
| + | | [[FILE:sfcvm-sierra-no-depth.png|thumb|400px| no gabbro processing depth profile]] | ||
| + | |} | ||
| + | |||
| + | <pre> | ||
| + | PROJ_LIB=../model/UCVM_TARGET/lib/proj/share/proj PATH=/usr/local/share/anaconda2/bin:/usr/local/sha | ||
| + | re/anaconda2/condabin:/usr/local/sbin:/usr/local/bin:/usr/sbin:/usr/bin PYTHONPATH=../model/UCVM_TAR | ||
| + | GET/ucvm_plotting plot_horizontal_slice.py -d vs -c sfcvm -s 0.010 -a sd -o ../result/$FNAME.png -n | ||
| + | ../model/UCVM_TARGET/conf/ucvm.conf -i ../model/UCVM_TARGET -b 36.5383,-122.234 -u 38.8162,-119.334 | ||
| + | -e 0 -A 0,4 | ||
| + | </pre> | ||
| + | |||
| + | {| | ||
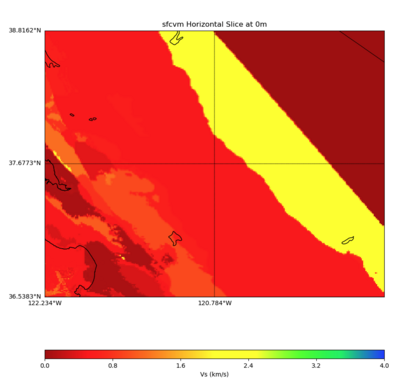
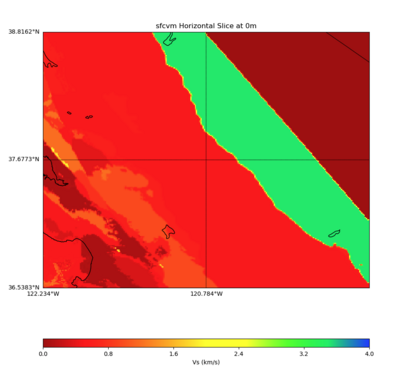
| + | | [[FILE:sfcvm-sierra-gabbro-0m.png|thumb|400px| gabbro processing 0m]] | ||
| + | | [[FILE:sfcvm-sierra-no-0m.png|thumb|400px| no gabbro processing 0m]] | ||
| + | |} | ||
| + | |||
| + | |||
| + | {| | ||
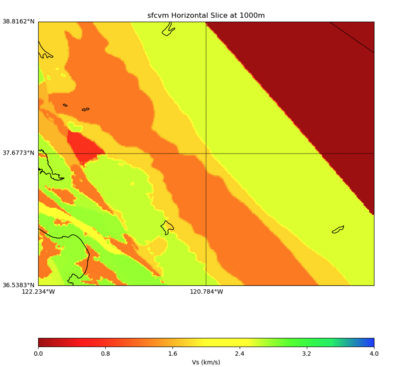
| + | | [[FILE:sfcvm-sierra-gabbro-1000m.png|thumb|400px| gabbro processing 1000m]] | ||
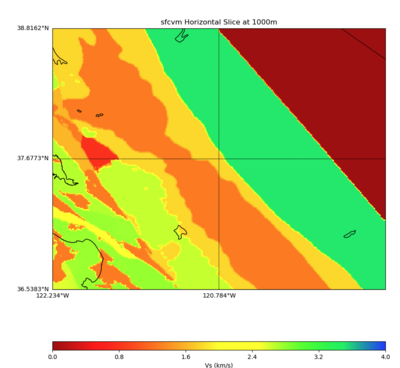
| + | | [[FILE:sfcvm-sierra-no-1000m.png|thumb|400px| no gabbro processing 1000m]] | ||
| + | |} | ||
| + | |||
| + | <pre> | ||
| + | PROJ_LIB=../model/UCVM_TARGET/lib/proj/share/proj PATH=/usr/local/share/anaconda2/bin:/usr/local/sha | ||
| + | re/anaconda2/condabin:/usr/local/sbin:/usr/local/bin:/usr/sbin:/usr/bin PYTHONPATH=../model/UCVM_TAR | ||
| + | GET/ucvm_plotting plot_cross_section.py -s 0 -h 1186 -d vs -c sfcvm -a sd -o ../result/$FNAME.png -n | ||
| + | ../model/UCVM_TARGET/conf/ucvm.conf -i ../model/UCVM_TARGET -v 50 -b 37.0837,-121.2012 -u 37.0661,- | ||
| + | 119.0698 -e 5000 | ||
| + | </pre> | ||
| + | |||
| + | {| | ||
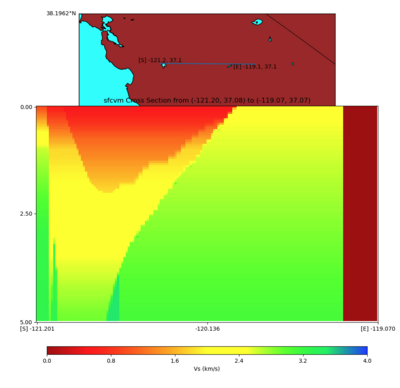
| + | | [[FILE:sfcvm-sierra-gabbro-slice.png|thumb|400px| gabbro processing]] | ||
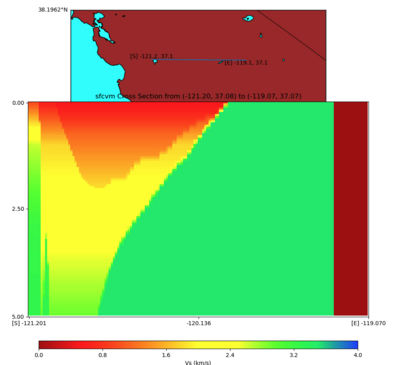
| + | | [[FILE:sfcvm-sierra-no-slice.png|thumb|400px| no gabbro processing]] | ||
| + | |} | ||
| + | |||
| + | |||
| + | And.. | ||
| + | {| | ||
| + | | [[FILE:sfcvm-at-0m.png|thumb|400px| sfcvm at 0m]] | ||
|} | |} | ||
Latest revision as of 17:31, 10 April 2024
Contents
- 1 UCVM with SFCVM
- 2 SFCVM in UCVM
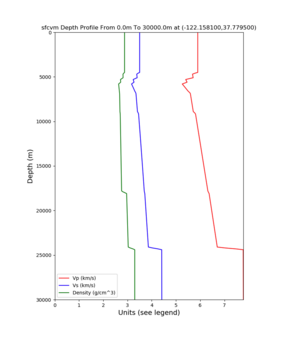
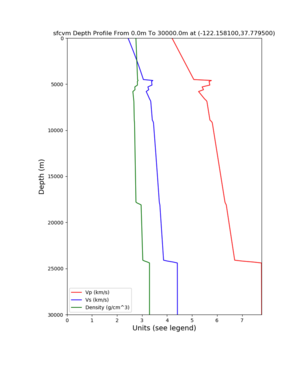
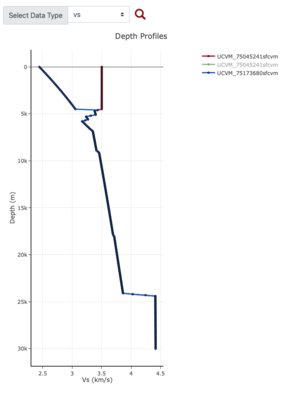
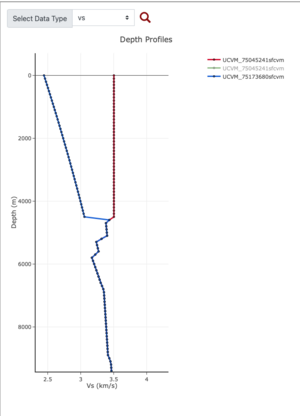
- 3 Plots from web viewer
- 4 New command line option for model specific configuration
- 5 More detailed plots from SFCVM
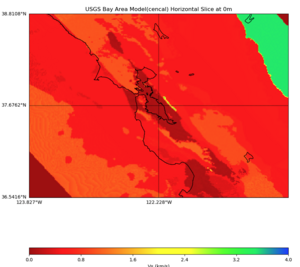
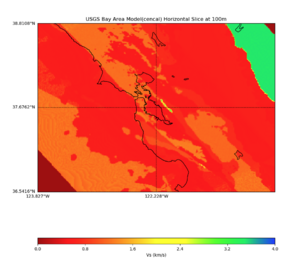
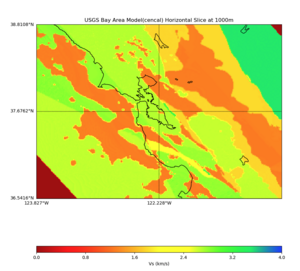
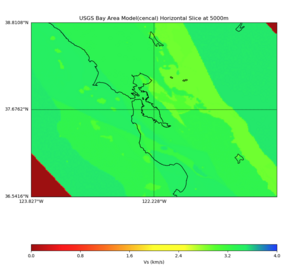
- 6 Detail plots from Cencal
- 7 High Velocity surface regions in SFCVM
- 8 SFCVM(detailed + regional regions) with Gabbro modification
- 9 Vertical Slice
- 10 More Study
- 11 With different grid step processing
- 12 With a Different step down processing
- 13 With minimum squashing elevation of 45000
- 14 fixed geomodelgrid's handling of zone-id
- 15 Under the water and near the water step-down search logic
- 16 Gabbro in Sierra
- 17 Baseline, original CENCAL
UCVM with SFCVM
Software stack for supporting geomodelgrid based format:
- curl (curl-7.87.0)
- hdf5 (hdf5-1.10.9)
- openssl (openssl-3.0.8)
- proj (proj-8.1.1)
- sqlite (sqlite-autoconf-3400100)
- tiff (tiff-4.5.0)
SFCVM in UCVM
geomodelgrid based SFCVM is set with
    geomodelgrids_squery_setSquashing(sfcvm_geo_query_object, GEOMODELGRIDS_SQUASH_TOPOGRAPHY_BATHYMETRY);
    geomodelgrids_squery_setSquashMinElev(sfcvm_geo_query_object, SFCVM_SquashMinElev);
where SFCVM_SquashMinElev is default to -5000m (sfcvm is elevation based, depth is negative value)
NOTE: For locations that are below water, their geomodelgrids_squery_queryTopoBathyElevation() could return a NA value and so a grid height is added across the board to always have an usable value.
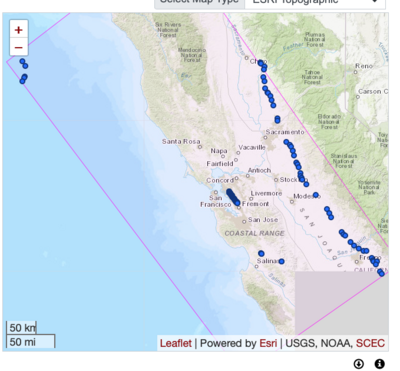
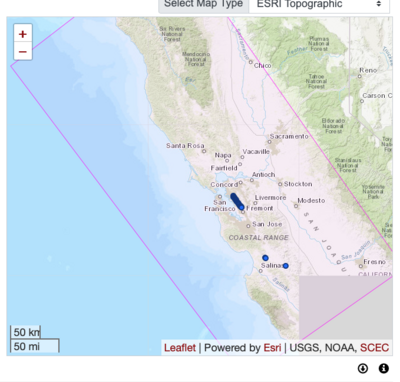
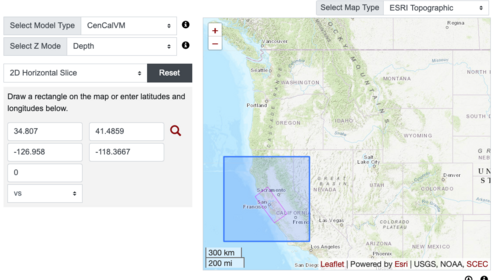
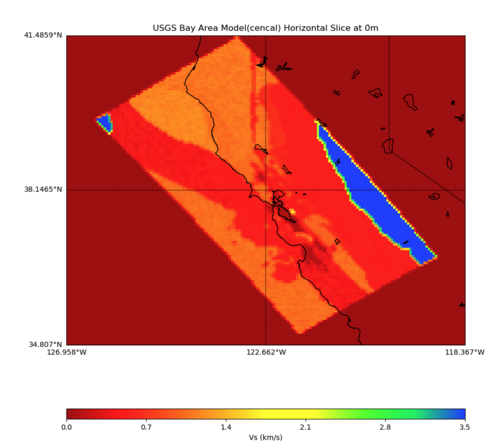
Plots from web viewer
New command line option for model specific configuration
UCVM option:
-P Optional model configuration(model_param:key,value)
Example:
ucvm_query -l 37.455000,-121.941,3000 -m sfcvm -f ../../conf/ucvm.conf -P sfcvm_param:SquashMinElev,-5000.0
Allows multiple -P options,
ucvm_query ... -P cvmh_param:USE_1D_BKG,False -P cvmh_param:USE_GTL,False
More detailed plots from SFCVM
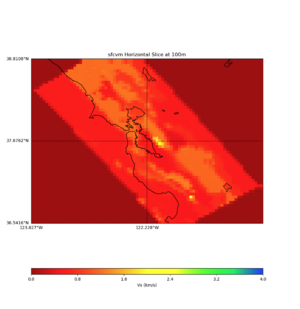
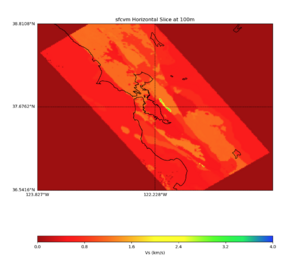
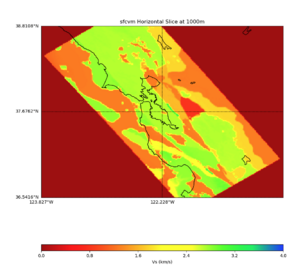
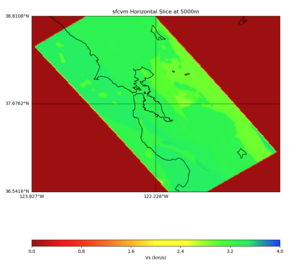
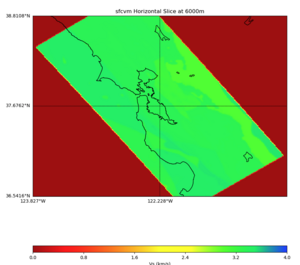
Internal calls from web viewer, (set e to 0,100,1000,5000,6000)
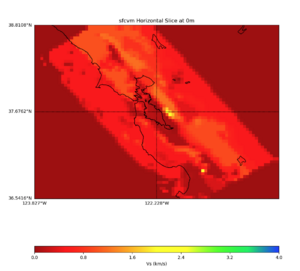
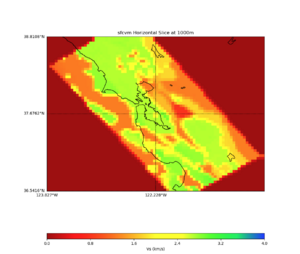
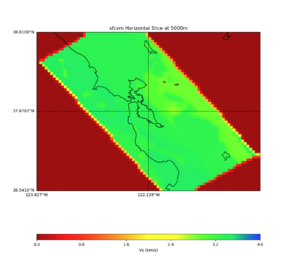
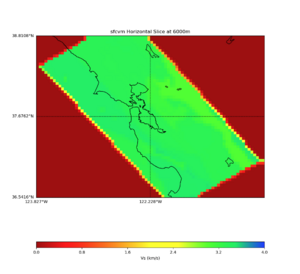
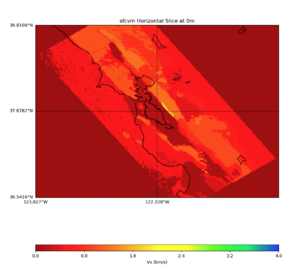
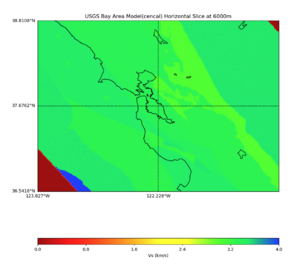
PROJ_LIB=/usr/local/share/anaconda2/share/proj PATH=/usr/local/share/anaconda2/bin:/usr/local/share/anaconda2/condabin:/usr/local/sbin:/usr/local/bin:/usr/sbin:/usr/bin PYTHONPATH=../model/UCVM_TARGET/ucvm_plotting plot_horizontal_slice.py -d vs -c sfcvm -s 0.010 -a sd -o ../result/UCVM_15167424_h.png -n ../model/UCVM_TARGET/conf/ucvm.conf -i ../model/UCVM_TARGET -b 36.5416,-123.8269 -u 38.8108,-120.6299 -e 0
Detail plots from Cencal
High Velocity surface regions in SFCVM
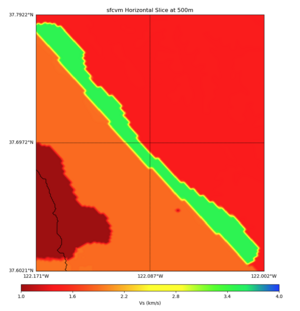
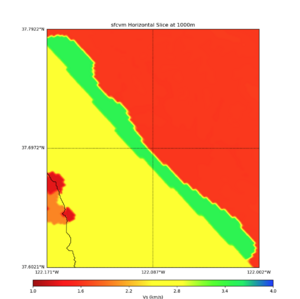
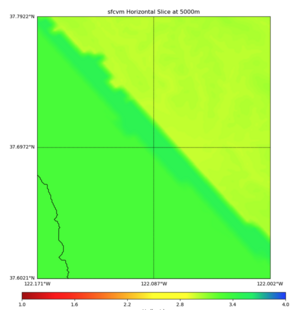
Horizontal region,
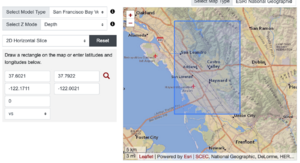
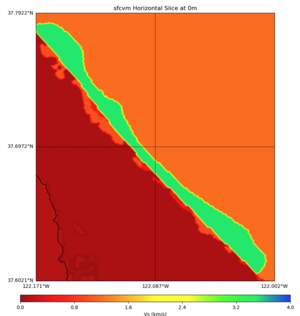
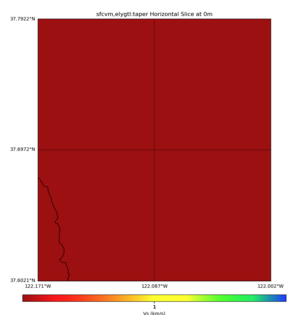
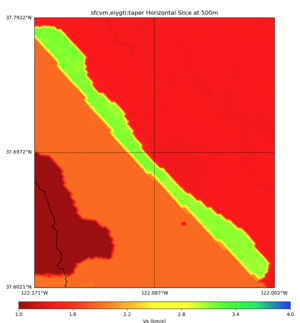
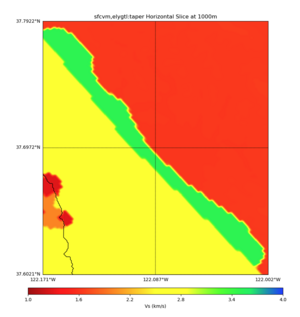
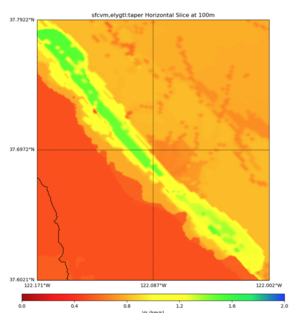
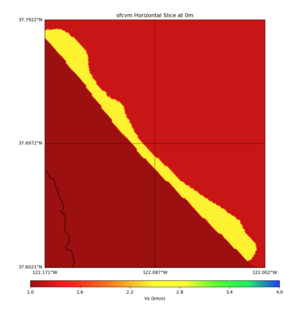
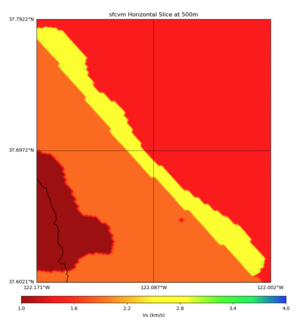
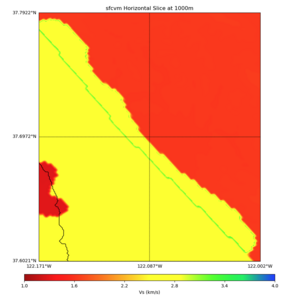
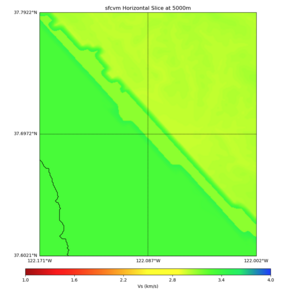
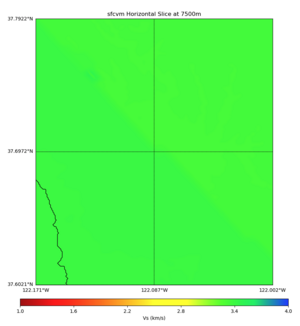
plot_horizontal_slice.py -d vs -c sfcvm,elygtl:taper -s 0.0005 -a sd -o ../result/UCVM_18933492_h.png -n ../model/UCVM_TARGET/conf/ucvm.conf -i ../model/UCVM_TARGET -L 500,1700,1700 -z 0,700 -b 37.6021,-122.1711 -u 37.7922,-122.0021 -e 500 -A 0.0,4.0
with sfcvm (only detailed region)
with sfcvm,elygtl:taper (only detailed region)
with sfcvm,elygtl:taper -A 0,2 (only detailed region)
SFCVM(detailed + regional regions) with Gabbro modification
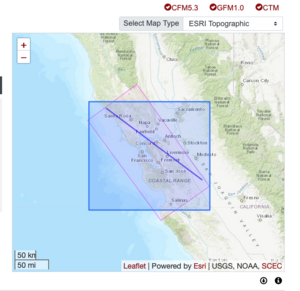
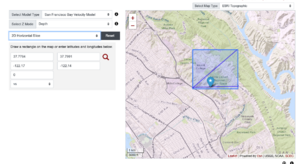
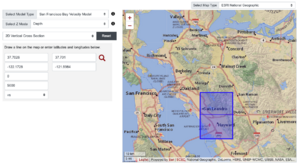
Upper San Leandro Gabbro region Map,
Rectangle horizontal box,
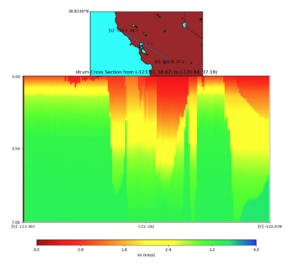
Lower Cross section,
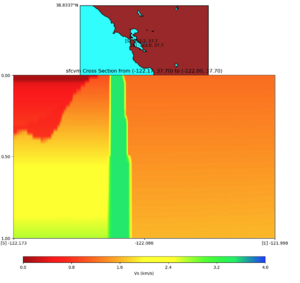
Diagonal Cross section,
Depth Profile at the blue marker,
Comparing depth profile plot (red=no gabbro, blue=gabbro)
with Gabbro modification (full detailed +regional regions)
Vertical Slice
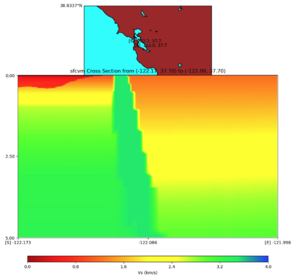
with sfcvm (detailed region)
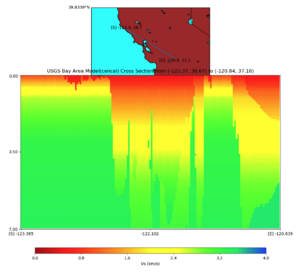
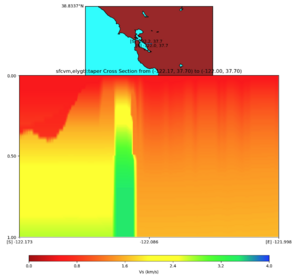
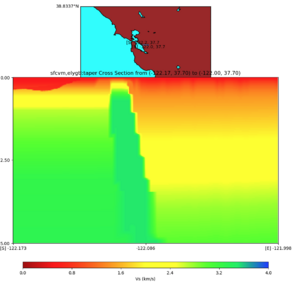
plot_cross_section.py -s 0 -h 48 -d vs -c sfcvm,elygtl:taper -a sd -o ../result/UCVM_23820778_c.png -n ../model/UCVM_TARGET/conf/ucvm.conf -i ../model/UCVM_TARGET -v 25 -L 500,1700,1700 -z 0,700 -b 37.7026,-122.1728 -u 37.701,-121.9984 -e 5000 -A 0.0,4.0
with sfcvm,elygtl:taper (detailed region)
More Study
SFCVM (detailed+regional)
With Water-Step1-Step2 modifications
 surf = geomodelgrids_squery_queryTopoBathyElevation
 surf < 0:
    call geomodelgrids_squery_query with elevation= N
    if vs<0 || vp<0
       call geomodelgrids_squery_query with elevation= N-25 (first step down grid height)
       if vs < 0 || vp < 0
          call geomodelgrids_squery_query with elevation= N-125 (second step down grid height)
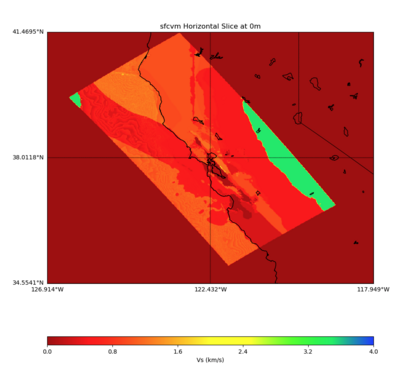
PROJ_LIB=../model/UCVM_TARGET/lib/proj/share/proj PATH=/usr/local/share/anaconda2/bin:
/usr/local/share/anaconda2/condabin:/usr/local/sbin:/usr/local/bin:/usr/sbin:/usr/bin
PYTHONPATH=../model/UCVM_TARGET/ucvm_plotting plot_horizontal_slice.py  -d vs -c sfcvm
 -s 0.010 -a sd -o ../result/UCVM_93552953_h.png -n ../model/UCVM_TARGET/conf/ucvm.con
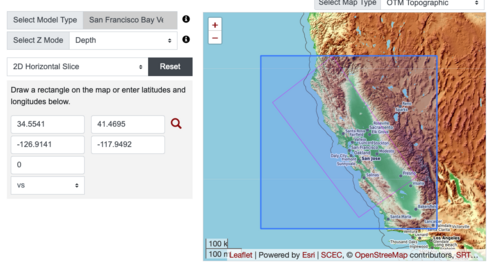
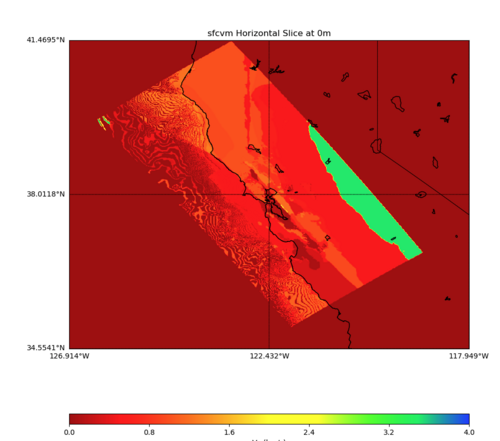
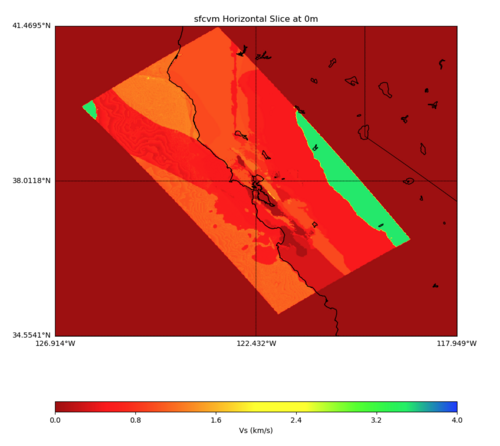
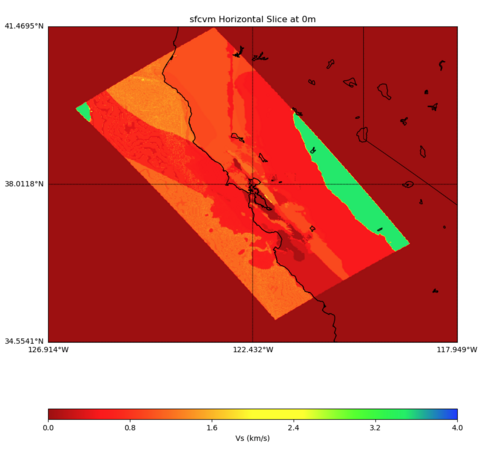
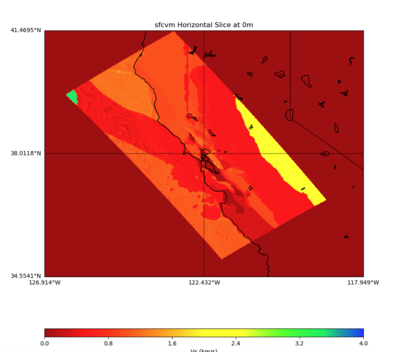
f -i ../model/UCVM_TARGET  -b 34.5541,-126.9141 -u 41.4695,-117.9492 -e 0 -A 0,4
With Water-Step1-Step2-again modification
  surf = geomodelgrids_squery_queryTopoBathyElevation

  surf < 0:
     call geomodelgrids_squery_query with elevation= N
     if vs<0 || vp<0
        call geomodelgrids_squery_query with elevation= N-25 (first step down grid height)
        if vs < 0 || vp < 0
           call geomodelgrids_squery_query with elevation= N-125 (second step down grid height)

           while ( vs < 0 || vp < 0 )
             call geomodelgrids_squery_query with elevation= N-125-(25*step)
           until vs>0 && vp>0 || step > 100
With finer grid, grid step of 0.01
DONE:
    total query count=(622314)
    total gabbro count=(78)
    total water count=(89765)
    total water step count=(89180)
    total water loop count=(43286)
    max water loops =(57)
With different grid step processing
With grid step of 0.10
PROJ_LIB=../model/UCVM_TARGET/lib/proj/share/proj PATH=/usr/local/share/anaconda2/bin:
/usr/local/share/anaconda2/condabin:/usr/local/sbin:/usr/local/bin:/usr/sbin:/usr/bin
PYTHONPATH=../model/UCVM_TARGET/ucvm_plotting plot_horizontal_slice.py  -d vs -c sfcvm
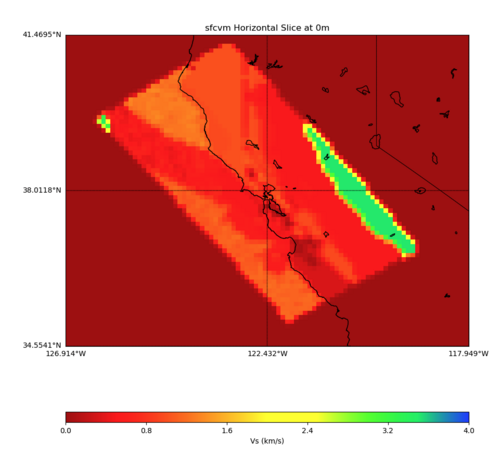
 -s 0.10 -a sd -o ../result/UCVM_59976096_h.png -n ../model/UCVM_TARGET/conf/ucvm.conf
 -i ../model/UCVM_TARGET  -b 34.5541,-126.9141 -u 41.4695,-117.9492 -e 0 -A 0,4
Status result,
step count is the number of query that needed stepping down
max loops is the max number of looping a step-down query needed ie. there is a location that needs to go down to 125+(22*25) meters before finding a valid data
DONE:
    total query count=(6461)
    total gabbro count=(0)
    total water count=(894)
    total water step count=(890)
    total water loop count=(435)
    max water loops =(22)
With a Different step down processing
Using Squash Min Elevation of -45000.
 surf = geomodelgrids_squery_queryTopoBathyElevation
 surf < 0:
    call geomodelgrids_squery_query with elevation= N
    if vs < 0 || vp < 0
       call geomodelgrids_squery_query with elevation= N-25 (first step down grid height)
       if vs < 0 || vp < 0
          cnt=1
          while
             call geomodelgrids_squery_query with elevation= N-(125*cnt)(second step down grid height)
             if vs > 0 && vp > 0
                 // FOUND IT... TODO: additional backtrack processing
             else
                 try again
    total query count=(622314)
    total gabbro count=(82)
    total water count=(89765)
    total water step count=(89180)
    total water 2 step count=(69498)
    max water step =(10)
  In the 2-step while loop, number of query to number of cnt

  61482     done(1)
      1     done(10)
   7997     done(2)
     11     done(3)
      4     done(4)
      1     done(5)
      1     done(6)
      1     done(8)

???
WATER: still bad : at -124.824100 40.314100 -127.914481 -- surface -1025.307276 zsquash -1150.307276
WATER: still bad : at -124.824100 40.314100 -255.828962 -- surface -1025.307276 zsquash -1275.307276
WATER: still bad : at -124.824100 40.314100 -383.743443 -- surface -1025.307276 zsquash -1400.307276
WATER: still bad : at -124.824100 40.314100 -511.657924 -- surface -1025.307276 zsquash -1525.307276
WATER: still bad : at -124.824100 40.314100 -639.572405 -- surface -1025.307276 zsquash -1650.307276
WATER: still bad : at -124.824100 40.314100 -767.486886 -- surface -1025.307276 zsquash -1775.307276
WATER: still bad : at -124.824100 40.314100 -895.401367 -- surface -1025.307276 zsquash -1900.307276
WATER: still bad : at -124.824100 40.314100 -1023.315849 -- surface -1025.307276 zsquash -2025.307276
WATER: still bad : at -124.824100 40.314100 -1151.230330 -- surface -1025.307276 zsquash -2150.307276
    done(10) : at -124.824100 40.314100 -1279.144811 -- surface -1025.307276 zsquash -2275.307276  : previous_zsquash -2150.307276 previous_n_entry_elevation -1151.230330
For points with cnt of 3+
For point with cnt of 10
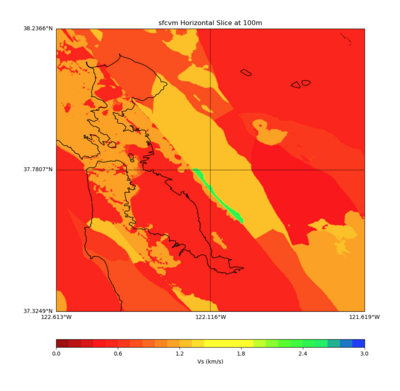
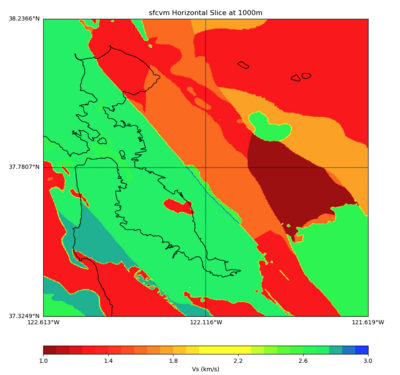
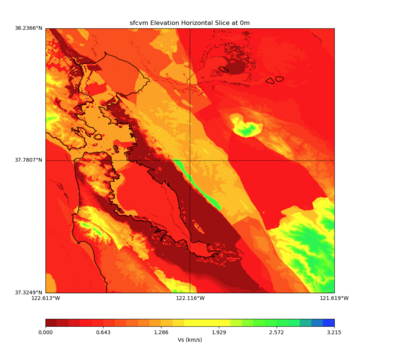
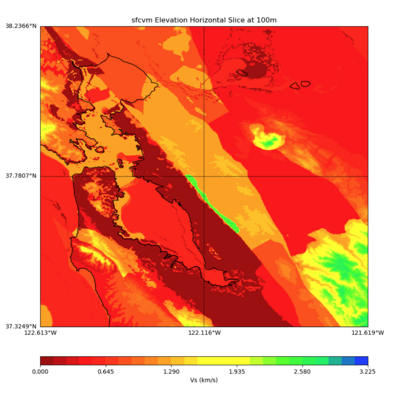
With minimum squashing elevation of 45000
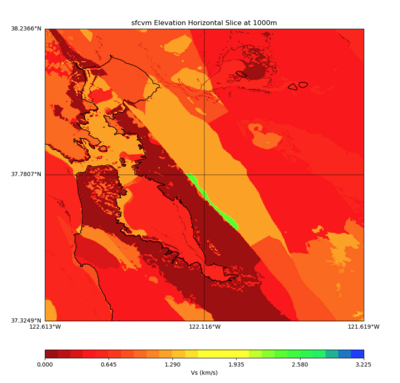
double SFCVM_SquashMinElev=-45000.0
extended geomodelgrids c-api:
/** Query for model at point.
 *
 * @param[inout] handle Handle to query object.
 * @param[in] x X coordinate of point (in input CRS).
 * @param[in] y Y coordinate of point (in input CRS).
 * @returns model index at point.
 */
int geomodelgrids_squery_queryModelContains(void* handle,
                                            const double x,
                                            const double y);
PROJ_LIB=../model/UCVM_TARGET/lib/proj/share/proj PATH=/usr/local/share/anaconda2/bin:/usr/local/share
/anaconda2/condabin:/usr/local/sbin:/usr/local/bin:/usr/sbin:/usr/bin PYTHONPATH=../model/UCVM_TARGET/
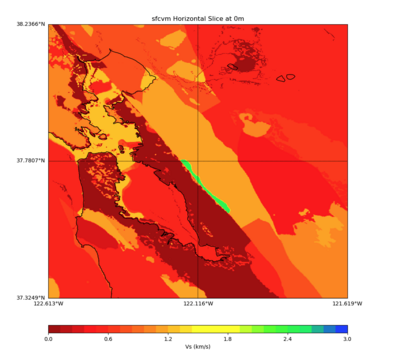
ucvm_plotting plot_horizontal_slice.py  -d vs -c sfcvm -s 0.001 -a sd -o ../result/UCVM_72526857_h.png
 -n ../model/UCVM_TARGET/conf/ucvm.conf -i ../model/UCVM_TARGET  -b 37.3249,-122.6129 -u 38.2366,-121.
6187 -e 0
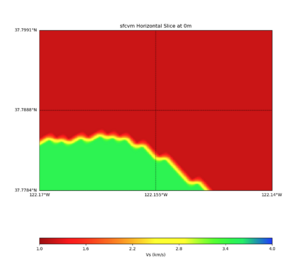
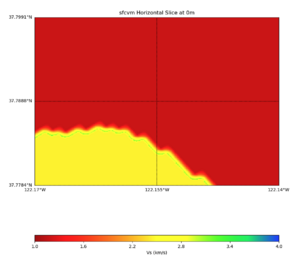
fixed geomodelgrid's handling of zone-id
fixed geomodelgrids' handling of interpolating all stored material properties including type-enumerated data like rock type.
Logic:
if data has no 'units', then use nearest data point
if data has 'units',  then interpolated with surrounding points
PROJ_LIB=../model/UCVM_TARGET/lib/proj/share/proj PATH=/usr/local/share/anaconda2/bin:/usr/local/share/
anaconda2/condabin:/usr/local/sbin:/usr/local/bin:/usr/sbin:/usr/bin PYTHONPATH=../model/UCVM_TARGET/uc
vm_plotting plot_horizontal_slice.py  -d vs -c sfcvm -s 0.010 -a sd -o ../result/$FNAME.png -n ../model
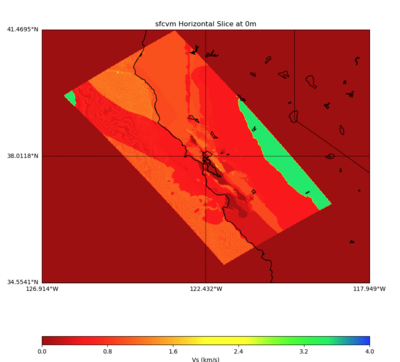
/UCVM_TARGET/conf/ucvm.conf -i ../model/UCVM_TARGET  -b 34.5541,-126.9141 -u 41.4695,-117.9492 -e 0 -A
0,4
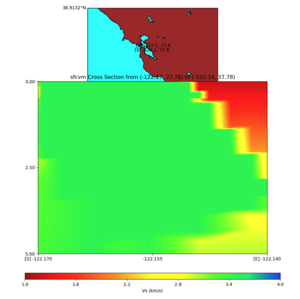
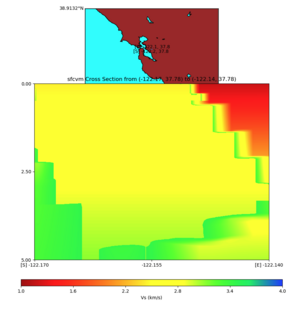
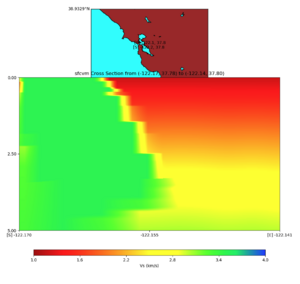
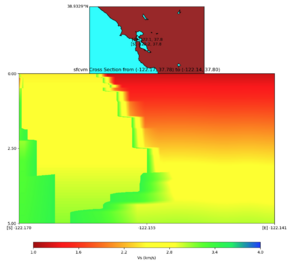
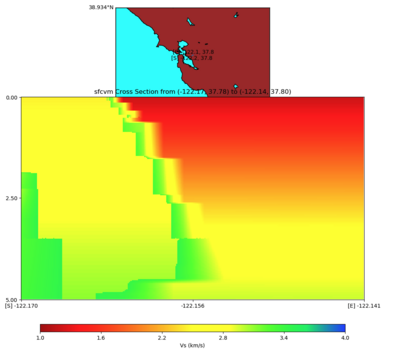
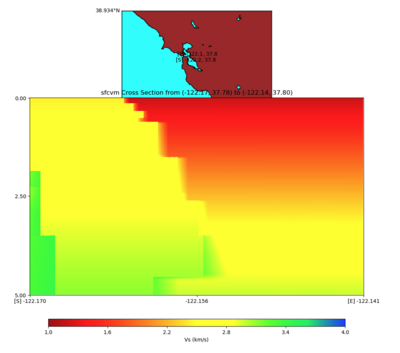
plot_cross_section.py -s 0 -e 5000 -h 10  -d vs -c sfcvm -a sd -o ../result/UCVM_23820778_c.png -n ../model
/UCVM_TARGET/conf/ucvm.conf -i ../model/UCVM_TARGET -v 25 -b 37.78,-122.17 -u 37.80,-122.141 -A 1.0,4.0
PROJ_LIB=../model/UCVM_TARGET/lib/proj/share/proj PATH=/usr/local/share/anaconda2/bin:/usr/local/share/anac
onda2/condabin:/usr/local/sbin:/usr/local/bin:/usr/sbin:/usr/bin PYTHONPATH=../model/UCVM_TARGET/ucvm_plott
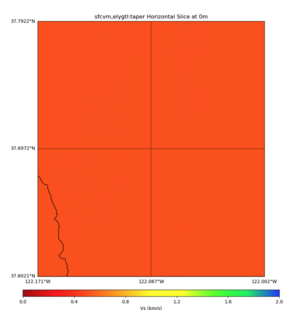
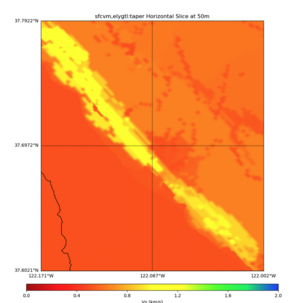
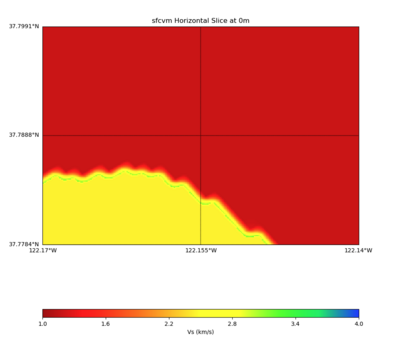
ing plot_horizontal_slice.py  -d vs -c sfcvm -s 0.0001 -a sd -o ../result/$FNAME.png -n ../model/UCVM_TARGE
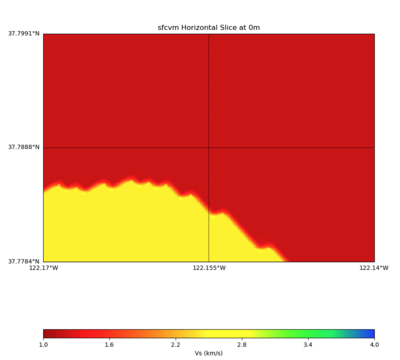
T/conf/ucvm.conf -i ../model/UCVM_TARGET  -b 37.7784,-122.17 -u 37.7991,-122.14 -e 0 -A 1,4
Under the water and near the water step-down search logic
   zSurf from geomodelgrids_squery_queryTopoBathyElevation,

   zSquashed is new squashed elevation

   make initial geomodelgrids_squery_query call,

   do step-down search iterations
      if  (query failed and zSurf < 0)
      or
      if  (zSquashed < zSurf || zSurf < 0) and (vp != NODATA) and (vs == NODATA)
Gabbro in Sierra
  In regional area,
    zone_ids : "GV gabbro":3
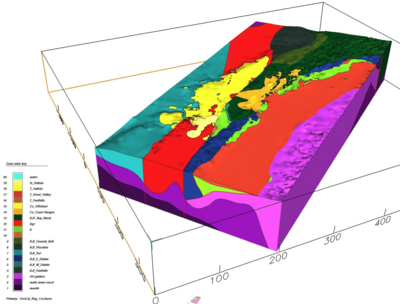
From Brad, sfcvm's regional area
PROJ_LIB=../model/UCVM_TARGET/lib/proj/share/proj PATH=/usr/local/share/anaconda2/bin:/usr/local/share/anaconda2
/condabin:/usr/local/sbin:/usr/local/bin:/usr/sbin:/usr/bin PYTHONPATH=../model/UCVM_TARGET/ucvm_plotting plot_d
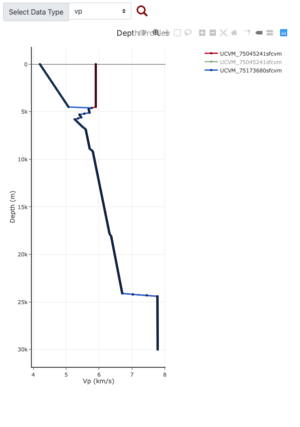
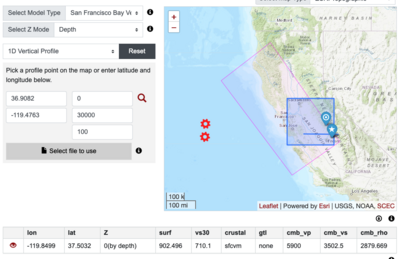
epth_profile.py  -n ../model/UCVM_TARGET/conf/ucvm.conf -i ../model/UCVM_TARGET -d vs,vp,density -c sfcvm -o ../
result/UCVM_66661243_v.png -C 'San Francisco Bay Velocity Model' -v 100 -b 0 -s 36.9082,-119.4763 -e 30000
PROJ_LIB=../model/UCVM_TARGET/lib/proj/share/proj PATH=/usr/local/share/anaconda2/bin:/usr/local/sha
re/anaconda2/condabin:/usr/local/sbin:/usr/local/bin:/usr/sbin:/usr/bin PYTHONPATH=../model/UCVM_TAR
GET/ucvm_plotting plot_horizontal_slice.py  -d vs -c sfcvm -s 0.010 -a sd -o ../result/$FNAME.png -n
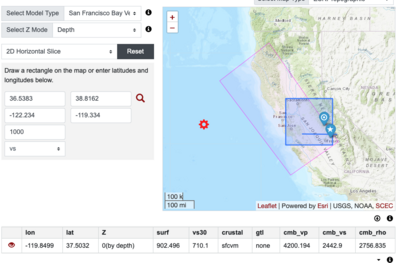
 ../model/UCVM_TARGET/conf/ucvm.conf -i ../model/UCVM_TARGET -b 36.5383,-122.234 -u 38.8162,-119.334
 -e 0 -A 0,4
PROJ_LIB=../model/UCVM_TARGET/lib/proj/share/proj PATH=/usr/local/share/anaconda2/bin:/usr/local/sha
re/anaconda2/condabin:/usr/local/sbin:/usr/local/bin:/usr/sbin:/usr/bin PYTHONPATH=../model/UCVM_TAR
GET/ucvm_plotting plot_cross_section.py -s 0 -h 1186 -d vs -c sfcvm -a sd -o ../result/$FNAME.png -n
 ../model/UCVM_TARGET/conf/ucvm.conf -i ../model/UCVM_TARGET -v 50 -b 37.0837,-121.2012 -u 37.0661,-
119.0698 -e 5000
And..
