Difference between revisions of "Rupture Variation Generator v5.2.3 Verification"
From SCECpedia
Jump to navigationJump to search| Line 3: | Line 3: | ||
== Hazard Curves == | == Hazard Curves == | ||
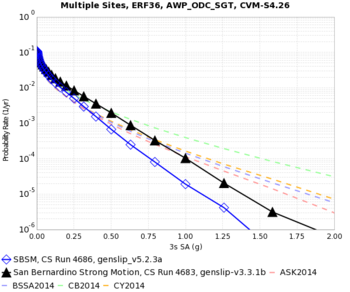
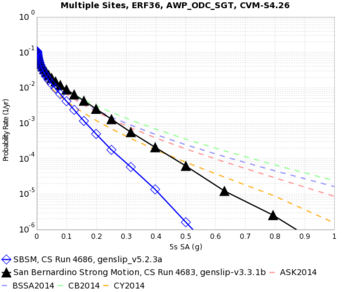
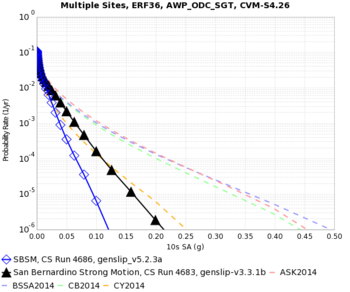
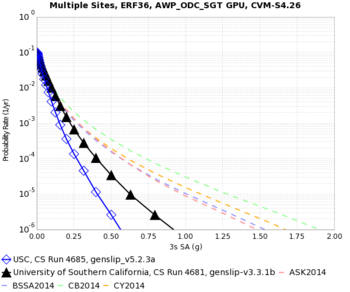
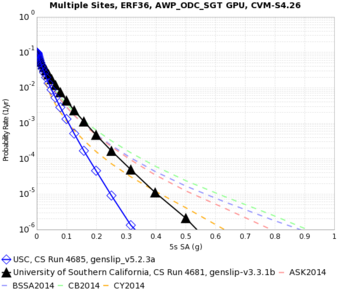
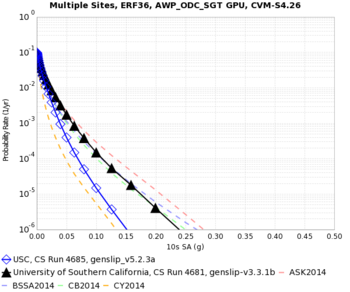
| − | Below are hazard curves for a 0.5 Hz CyberShake run, comparing v3.3.1 and v5.2.3 at 3, 5, and 10 sec, for SBSM and USC. | + | Below are hazard curves for a 0.5 Hz CyberShake run, comparing v3.3.1 (black) and v5.2.3 (blue) at 3, 5, and 10 sec, for SBSM and USC. |
{| | {| | ||
| Line 9: | Line 9: | ||
|- | |- | ||
! SBSM | ! SBSM | ||
| − | | [[File:SBSM_Run4686_CompToRun4683_3sec_SA.png|thumb|350px]] | + | | [[File:SBSM_Run4686_CompToRun4683_3sec_SA.png|thumb|350px|v3.3.1 (black) vs v5.2.3 (blue)]] |
| − | | [[File:SBSM_Run4686_CompToRun4683_5sec_SA.png|thumb|350px]] | + | | [[File:SBSM_Run4686_CompToRun4683_5sec_SA.png|thumb|350px|v3.3.1 (black) vs v5.2.3 (blue)]] |
| − | | [[File:SBSM_Run4686_CompToRun4683_10sec_SA.png|thumb|350px]] | + | | [[File:SBSM_Run4686_CompToRun4683_10sec_SA.png|thumb|350px|v3.3.1 (black) vs v5.2.3 (blue)]] |
|- | |- | ||
! USC | ! USC | ||
| − | | [[File:USC_Run4685_CompToRun4681_3sec_SA.png|thumb|350px]] | + | | [[File:USC_Run4685_CompToRun4681_3sec_SA.png|thumb|350px|v3.3.1 (black) vs v5.2.3 (blue)]] |
| − | | [[File:USC_Run4685_CompToRun4681_5sec_SA.png|thumb|350px]] | + | | [[File:USC_Run4685_CompToRun4681_5sec_SA.png|thumb|350px|v3.3.1 (black) vs v5.2.3 (blue)]] |
| − | | [[File:USC_Run4685_CompToRun4681_10sec_SA.png|thumb|350px]] | + | | [[File:USC_Run4685_CompToRun4681_10sec_SA.png|thumb|350px|v3.3.1 (black) vs v5.2.3 (blue)]] |
|} | |} | ||
Revision as of 19:47, 10 October 2016
This page details the verification work with the Graves & Pitarka (2015) rupture variation generator, v5.2.3, as compared to the Graves & Pitarka (2014) rupture variation generator, v3.3.1.
Hazard Curves
Below are hazard curves for a 0.5 Hz CyberShake run, comparing v3.3.1 (black) and v5.2.3 (blue) at 3, 5, and 10 sec, for SBSM and USC.
| Site | 3 sec | 5 sec | 10 sec |
|---|---|---|---|
| SBSM | |||
| USC |
GMPE Scatter Plots
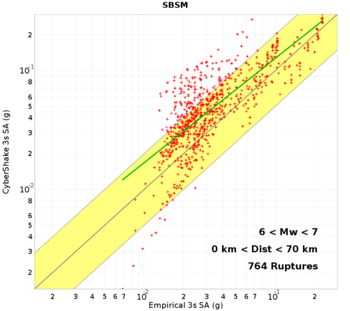
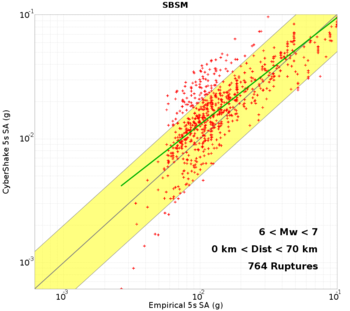
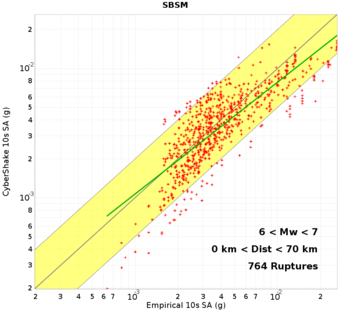
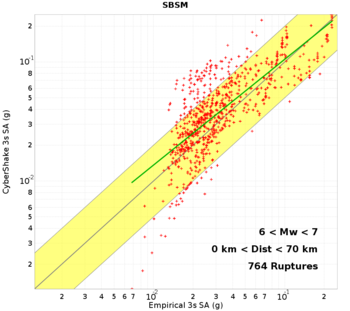
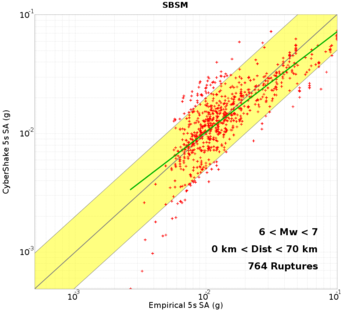
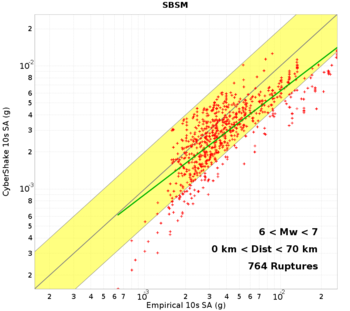
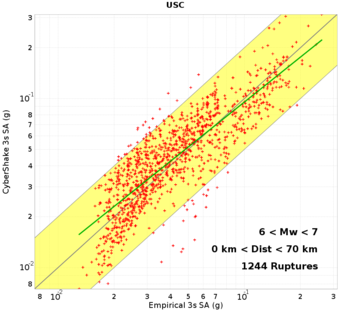
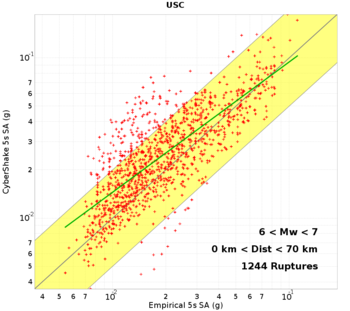
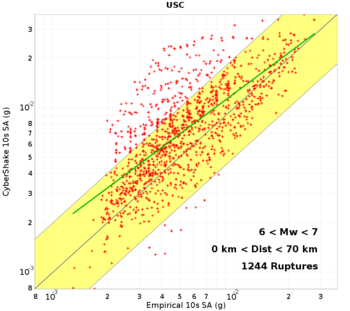
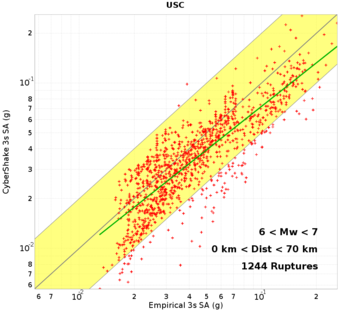
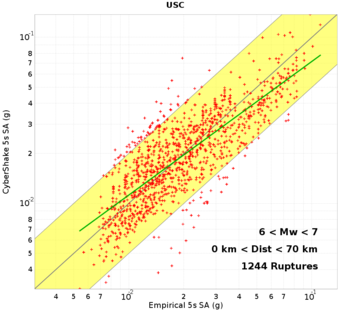
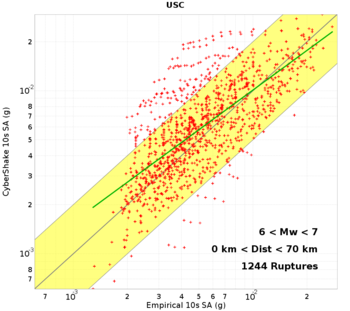
Below are GMPE scatter plots for v3.3.1 (G&P 2014) and v5.2.3 (G&P 2015) runs, for SBSM and USC at 3, 5, and 10 sec.
| Site/Rupture Generator | 3s, 6<M<7, dist<70km | 5s, 6<M<7, dist<70km | 10s, 6<M<7, dist<70km |
|---|---|---|---|
| SBSM, G&P 2014 | |||
| SBSM, G&P 2015 | |||
| USC, G&P 2014 | |||
| USC, G&P 2015 |
Individual Source Comparison
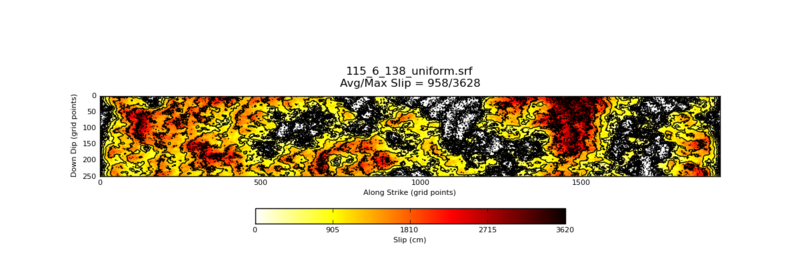
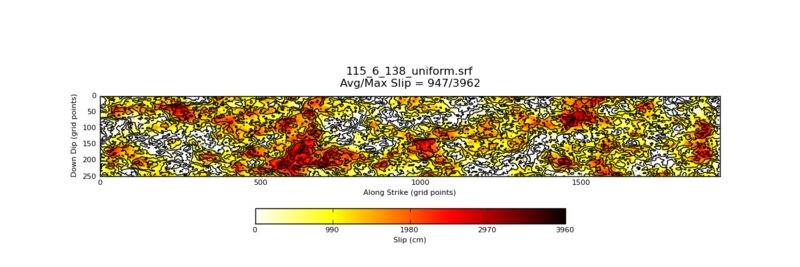
To dig in deeper, I selected a single event (source 115, rupture 6, rupture variation 138).
Below are v3.3.1 and v5.2.3 plots for this event.
