Difference between revisions of "Rupture Variation Generator v5.2.3 Verification"
| Line 78: | Line 78: | ||
{| | {| | ||
| − | [[File:Seismogram_USC_s145_r2_rv7_4681v4685.png|thumb| | + | | [[File:Seismogram_USC_s145_r2_rv7_4681v4685.png|thumb|800px]] |
|} | |} | ||
| Line 84: | Line 84: | ||
{| | {| | ||
| − | [[File:PeakVals_USC_s145_r2_rv7_4681v4685.png|thumb| | + | | [[File:PeakVals_USC_s145_r2_rv7_4681v4685.png|thumb|800px]] |
|} | |} | ||
| Line 95: | Line 95: | ||
{| | {| | ||
| − | [[File:Seismogram_USC_s143_r2_rv7_4681v4685.png|thumb| | + | | [[File:Seismogram_USC_s143_r2_rv7_4681v4685.png|thumb|800px]] |
|} | |} | ||
| Line 101: | Line 101: | ||
{| | {| | ||
| − | [[File:PeakVals_USC_s143_r2_rv7_4681v4685.png|thumb| | + | | [[File:PeakVals_USC_s143_r2_rv7_4681v4685.png|thumb|800px]] |
|} | |} | ||
Revision as of 22:11, 21 October 2016
This page details the verification work with the Graves & Pitarka (2015) rupture variation generator, v5.2.3, as compared to the Graves & Pitarka (2014) rupture variation generator, v3.3.1.
Contents
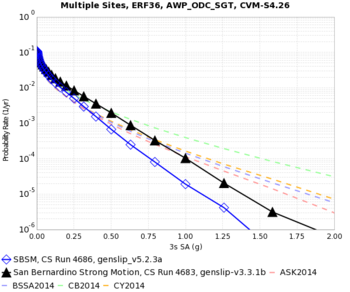
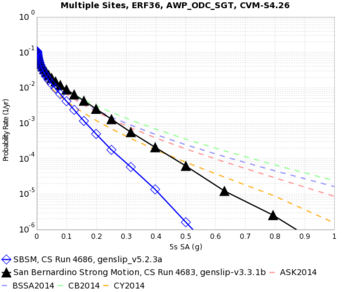
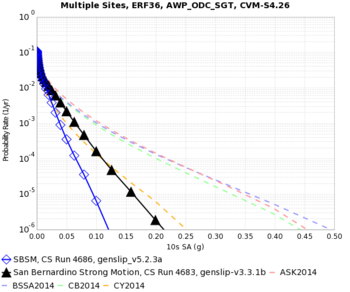
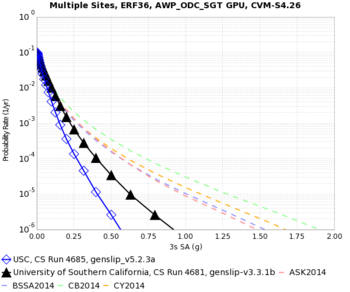
Hazard Curves
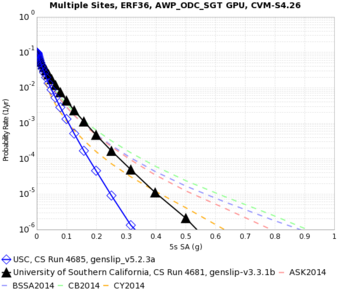
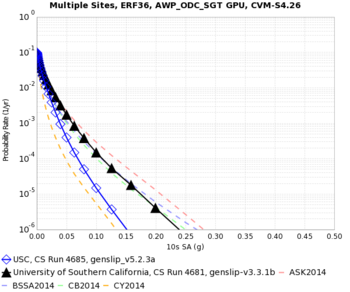
Below are hazard curves for a 0.5 Hz CyberShake run, comparing v3.3.1 (black) and v5.2.3 (blue) at 3, 5, and 10 sec, for SBSM and USC.
| Site | 3 sec | 5 sec | 10 sec |
|---|---|---|---|
| SBSM | |||
| USC |
GMPE Scatter Plots
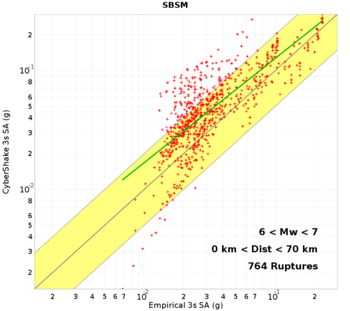
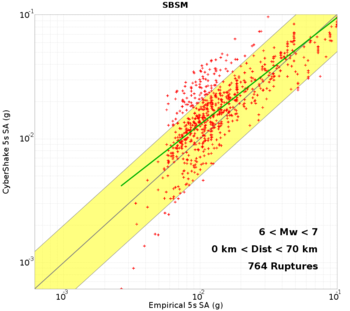
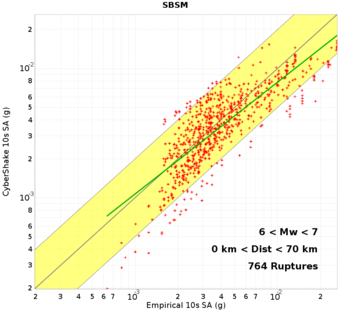
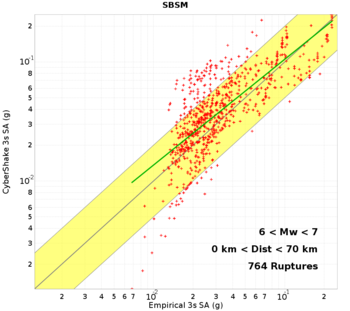
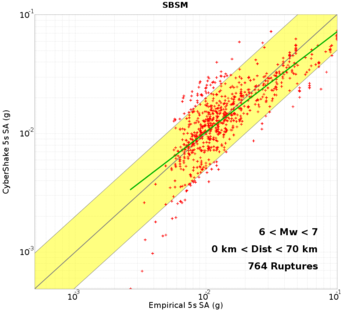
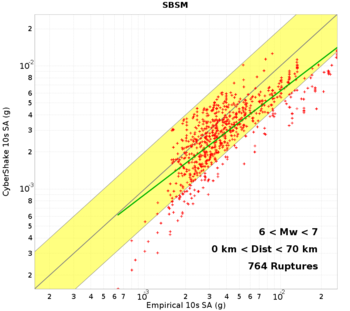
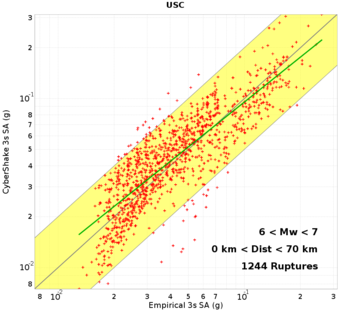
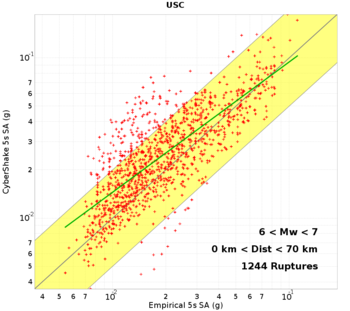
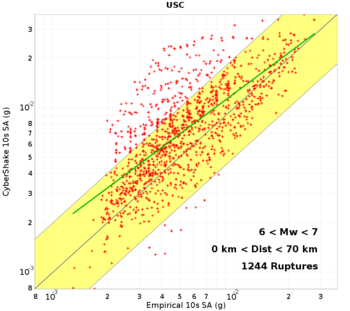
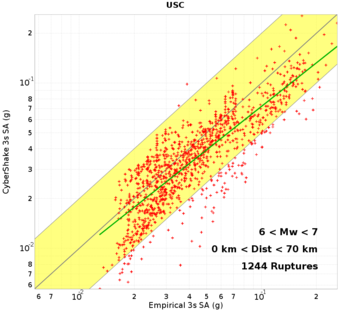
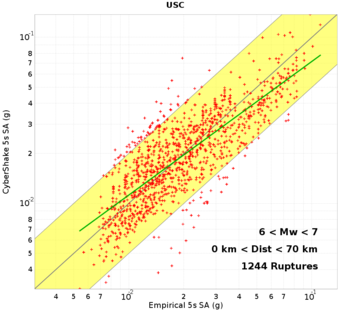
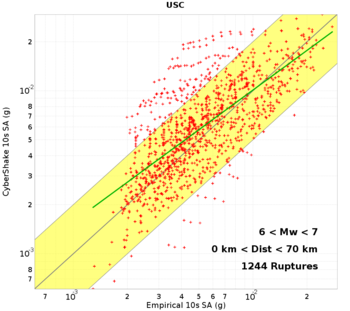
Below are GMPE scatter plots for v3.3.1 (G&P 2014) and v5.2.3 (G&P 2015) runs, for SBSM and USC at 3, 5, and 10 sec.
| Site/Rupture Generator | 3s, 6<M<7, dist<70km | 5s, 6<M<7, dist<70km | 10s, 6<M<7, dist<70km |
|---|---|---|---|
| SBSM, G&P 2014 | |||
| SBSM, G&P 2015 | |||
| USC, G&P 2014 | |||
| USC, G&P 2015 |
CyberShake vs CyberShake Scatter Plots
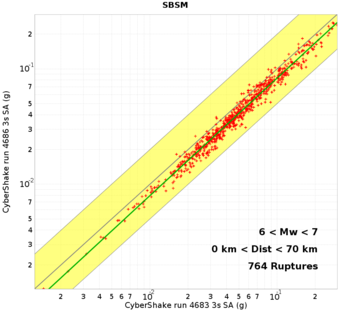
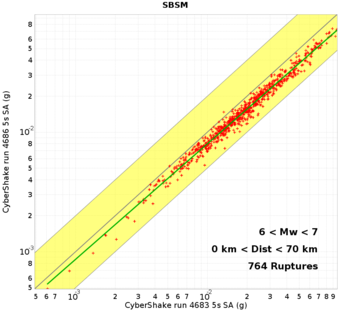
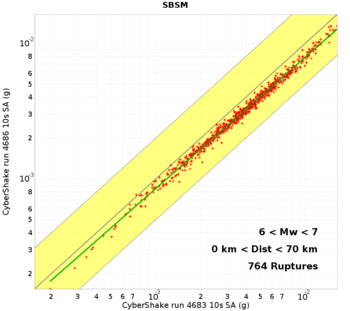
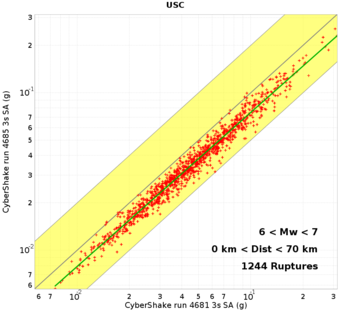
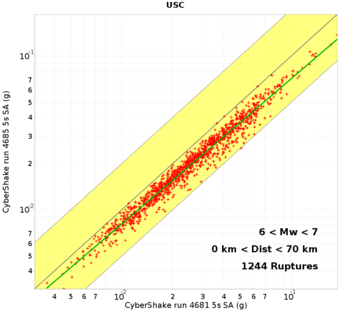
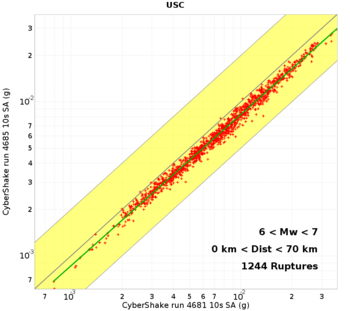
Below are CyberShake vs CyberShake scatter plots for v3.3.1 (x axis, G&P 2014) and v5.2.3 (y axis, G&P 2015) runs, for SBSM and USC at 3, 5, and 10 sec.
| Site/Rupture Generator | 3s, 6<M<7, dist<70km | 5s, 6<M<7, dist<70km | 10s, 6<M<7, dist<70km |
|---|---|---|---|
| SBSM | |||
| USC |
Comparison of small events for USC
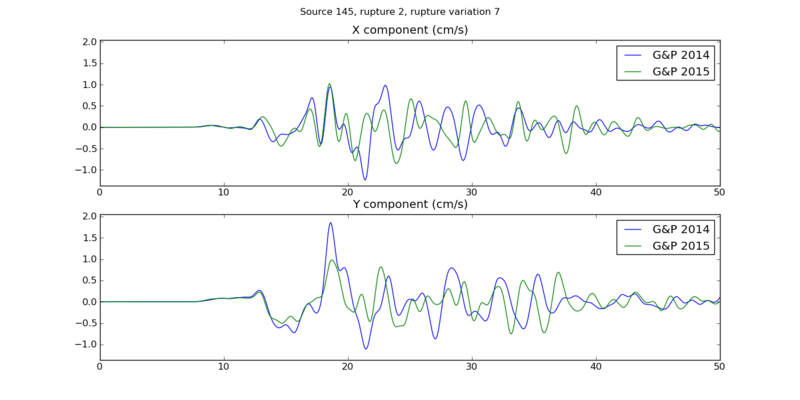
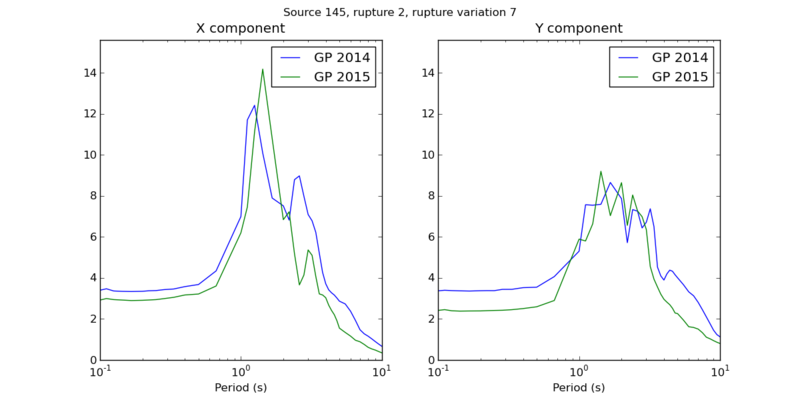
Below is a comparison of source 145, rupture 2 (M6.15) for USC, with G&P 2014 and 2015.
Seismogram plot:
PSA plot:
The two SRFs are available here (G&P 2014, v3.3.1) and here (G&P 2015, v5.2.3).
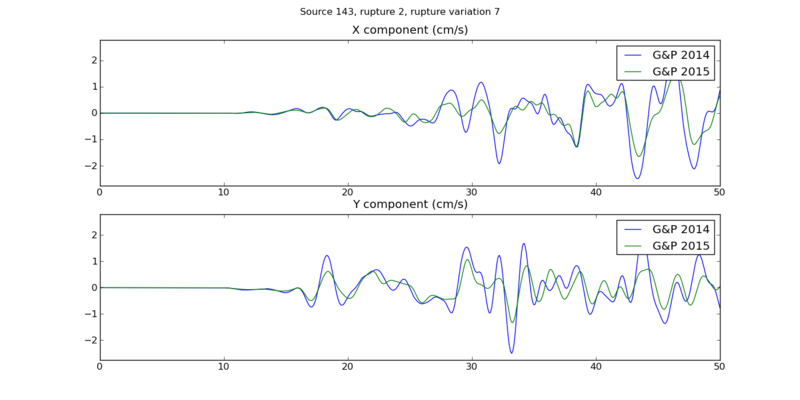
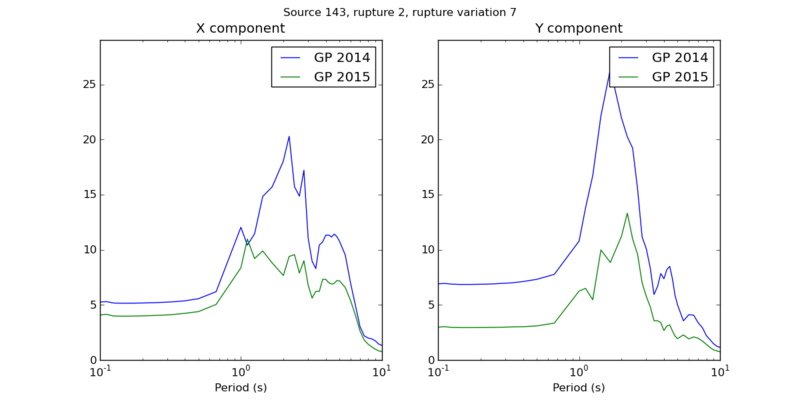
Below is a comparison of source 143, rupture 2 (M6.15) for USC, with G&P 2014 and 2015.
Seismogram plot:
PSA plot:
The two SRFs are available here (G&P 2014, v3.3.1) and here (G&P 2015, v5.2.3).
Comparison of source 115, rupture 6
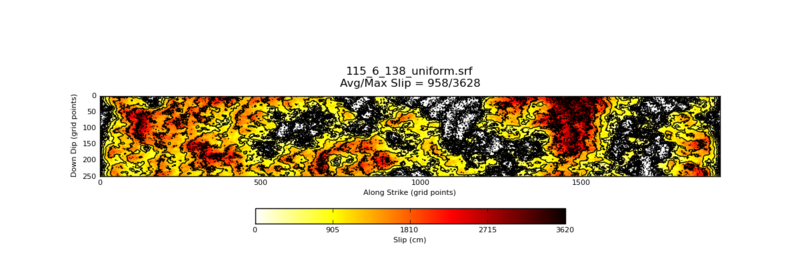
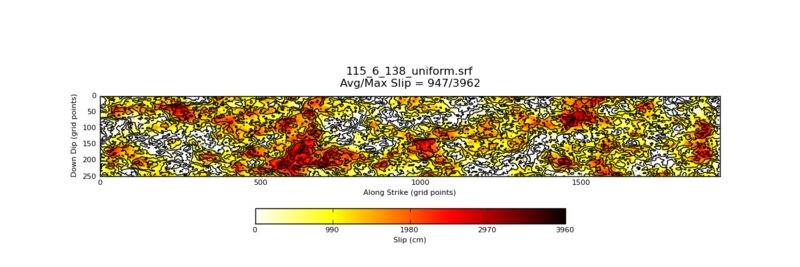
To dig in deeper, I selected a single event (source 115, rupture 6, rupture variation 138).
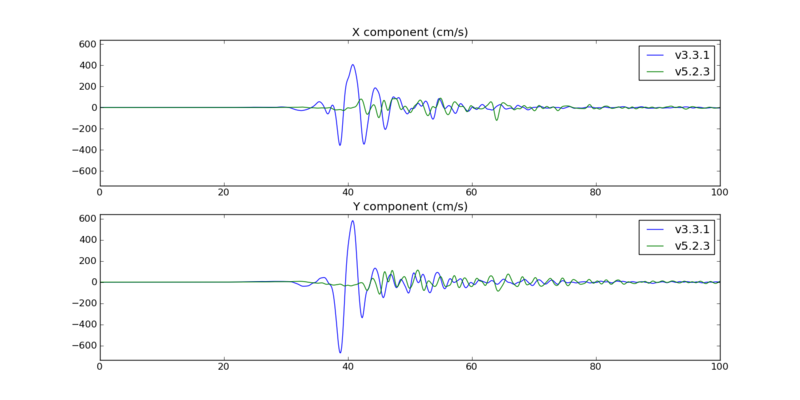
Below are v3.3.1 and v5.2.3 plots for this event. Note that even though both events have shypo=27.0, dhypo=12.5, the v3.3.1 hypocenter is at (-116.37060, 33.33710, 2.78240) while the v5.2.3 hypocenter is at (-116.43904, 33.39450, 9.38238).
A plot comparing the generated seismograms for both versions:
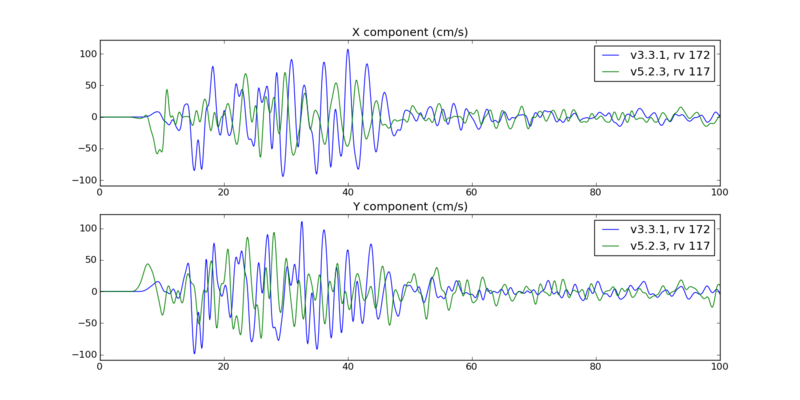
We repeated this for the two rupture variations which most closely match hypocenters, v3.3.1 rupture variation 172 and v5.2.3 rupture variation 117 (hypocenters ~0.2 km apart):
