Difference between revisions of "CS17.3-H"
| (17 intermediate revisions by the same user not shown) | |||
| Line 1: | Line 1: | ||
| − | + | We call the CyberShake Study 17.3 velocity model CVM CS17.3. CS17.3 is the name of a 175m resolution mesh tiled from CCA06, CenCal, CVM-S4.26-M01 with 10km smoothing on each horizontal interface used in the CyberShake Study 17.3, a Central California Seismic Hazard Model. SCEC plans to update the CS17.3 velocity model with improved Central California Basin Models developed by John Shaw and Andreas Plesch. Once the Harvard group's Santa Maria and San Joaquin Basin Models are integrated, UCVM users can access the updated version of the CVM called CS17.3-H | |
| − | == KML of | + | == Cross Section Plots == |
| − | *[http://hypocenter.usc.edu/research/ucvmc/UCVM_v18_5_Coverage_Regions_v4.kml KML File with Model Regions] | + | Plots and cross sections of CS173-H with basins added. |
| + | *[[UCVMC_CS17.3-H_plots]] | ||
| + | |||
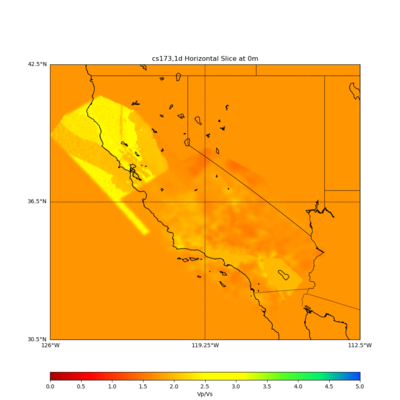
| + | == cs173 rho and vp/vs ratio maps == | ||
| + | |||
| + | {| | ||
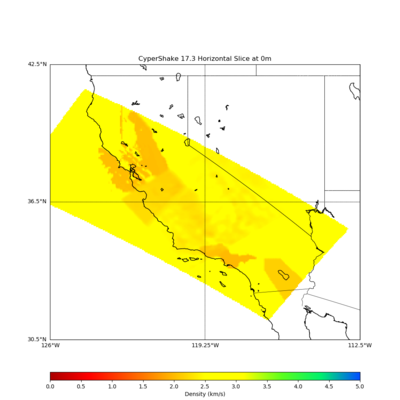
| + | | [[File:Cs173_rho_0m_map.png|thumb|400px|CS173 Density (rho) at Depth 0m (Density in g/cm^3)]] | ||
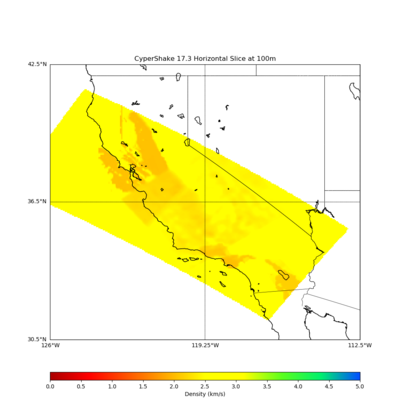
| + | | [[File:Cs173_rho_100m_map.png|thumb|400px|CS173 Density (rho) at Depth 100m (Density in g/cm^3)]] | ||
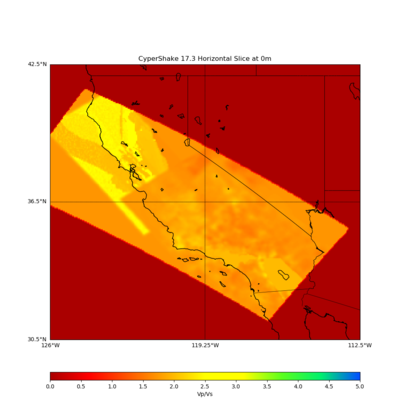
| + | | [[File:Cs173_poisson_0m_map.png|thumb|400px|CS173 Poisson (Vp/Vs) ratio depth 0m]] | ||
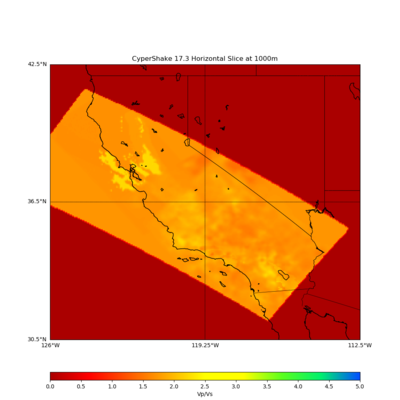
| + | | [[File:Cs173_poisson_1000m_map.png|thumb|400px|CS173 Poisson (Vp/Vs) ratio depth 1000m]] | ||
| + | | [[File:Cs173_poisson_1d_0m_map.png|thumb|400px|CS173 and 1D background model (Vp/Vs ratio depth 0]] | ||
| + | |} | ||
| + | |||
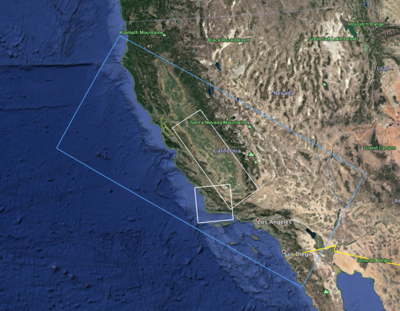
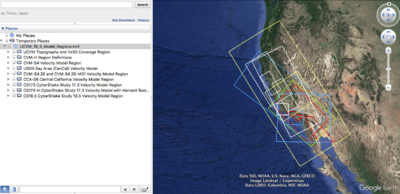
| + | == KML of CS17.3-H and other UCVM Registered Models == | ||
| + | *[http://hypocenter.usc.edu/research/ucvmc/KML/UCVM_v18_5_Coverage_Regions_v4.kml KML File with Model Regions] | ||
{| | {| | ||
| [[File:Cs173-H_regions_basins.png|thumb|400px|CS173-H Model Region (blue rectangle), San Joaquin Basin (top white rectangle), Santa Maria Basin (left white square)]] | | [[File:Cs173-H_regions_basins.png|thumb|400px|CS173-H Model Region (blue rectangle), San Joaquin Basin (top white rectangle), Santa Maria Basin (left white square)]] | ||
| − | | [[File:UCVM Models v185.png|thumb|400px|UCVM | + | | [[File:UCVM Models v185.png|thumb|400px|UCVM Velocity Model Regions]] |
|} | |} | ||
| Line 15: | Line 29: | ||
{| | {| | ||
| − | | [[File:Vs3 ucvm etree.png|thumb|400px|Vs30 from | + | | [[File:Vs3 ucvm etree.png|thumb|400px|Vs30 from UCVM Etree Based on Wills 2006 and Wald Topography relationship]] |
| − | | [[Image:Vs30_cs173.png|thumb|400px|Vs30 from slowness formula]] | + | | [[Image:Vs30_cs173.png|thumb|400px|Vs30 from models using slowness formula]] |
|} | |} | ||
Still, to be done, calculate vs30 map from model with Ely GTL (how to add Ely GTL to model, using slowness formula) | Still, to be done, calculate vs30 map from model with Ely GTL (how to add Ely GTL to model, using slowness formula) | ||
| + | |||
| + | == Identify the density algorithm used in CVM-S4.26 and CCA06 == | ||
| + | We tested to density algorithms and compared them to the density values we get from various CVMs in order to confirm how density was calculated for the tomography improved CVMS done by Tom Jordan's Full 3D tomography group. We tested two density scaling relationships against density values from CVM-S4.26, CCA06, and USGS Bay Area (CenCal)models. | ||
| + | |||
| + | Results comparing CVM's Density values to Density derived from Vp values | ||
| + | {| | ||
| + | | [[File:Vs3 ucvm etree.png|thumb|400px|Vs30 from UCVM Etree Based on Wills 2006 and Wald Topography relationship]] | ||
| + | | [[Image:Vs30_cs173.png|thumb|400px|Vs30 from models using slowness formula]] | ||
| + | | [[Image:Vs30_cs173.png|thumb|400px|Vs30 from models using slowness formula]] | ||
| + | |} | ||
== Vp versus Density (rho) Map from CS17.3 == | == Vp versus Density (rho) Map from CS17.3 == | ||
| Line 29: | Line 53: | ||
|} | |} | ||
| − | == | + | Researchers requested scatter plots of Vp versus Density scatter plots from CS173. Plot vp (vertical) and density (horizontal) (scaled from 0 to max value on each axis), at depths 0,10000,40000 |
| − | + | {| | |
| + | | [[Image:vp_vs_density_cs173.png|thumb|400px|Vp versus Density (Depth 0m) CS173]] | ||
| + | | [[Image:vp_density_10000.png|thumb|400px|Vp versus Density (Depth 10000m) CS173]] | ||
| + | | [[Image:vp_density_40000.png|thumb|400px|Vp versus Density (Depth 40000m) CS173]] | ||
| + | |} | ||
| + | |||
| + | == Scatter Plot Vp (X) from CVM-H v15.1 versus density == | ||
| + | {| | ||
| + | | [[File:Cvmh vp versus density 1000km.png|thumb|400px| CVM-H Vp (X-Axis) versus Density (rho) (Y-Axis) at Depth 1000m (Density in g/cm^3)]] | ||
| + | |} | ||
| − | == Document Density Formula for CCA06 == | + | == Document Density Formula for CVM-S4.26 and CCA06 == |
| − | + | The following scecpedia Wiki page that describes the density calculation done for cvms4.26 and CCA06 that uses vp and vs values | |
| + | [[UCVM_Density_Formula]] | ||
== Create a difference plot of densities == | == Create a difference plot of densities == | ||
| Line 39: | Line 73: | ||
== Notes on Central California Basin Model == | == Notes on Central California Basin Model == | ||
| − | *[http://hypocenter.usc.edu/research/ | + | Notes by Andreas Plesch on Basin Model (15MB pptx) |
| + | *[http://hypocenter.usc.edu/research/ucvmc/CS173-H/CCA_basin_integration.pptx CCA Basin Integration] | ||
== Related Entries == | == Related Entries == | ||
*[[CyberShake Study 17.3]] | *[[CyberShake Study 17.3]] | ||
*[[UCVM]] | *[[UCVM]] | ||
Latest revision as of 02:03, 31 May 2018
We call the CyberShake Study 17.3 velocity model CVM CS17.3. CS17.3 is the name of a 175m resolution mesh tiled from CCA06, CenCal, CVM-S4.26-M01 with 10km smoothing on each horizontal interface used in the CyberShake Study 17.3, a Central California Seismic Hazard Model. SCEC plans to update the CS17.3 velocity model with improved Central California Basin Models developed by John Shaw and Andreas Plesch. Once the Harvard group's Santa Maria and San Joaquin Basin Models are integrated, UCVM users can access the updated version of the CVM called CS17.3-H
Contents
- 1 Cross Section Plots
- 2 cs173 rho and vp/vs ratio maps
- 3 KML of CS17.3-H and other UCVM Registered Models
- 4 Vs30 Map from CS17.3
- 5 Identify the density algorithm used in CVM-S4.26 and CCA06
- 6 Vp versus Density (rho) Map from CS17.3
- 7 Scatter Plot Vp (X) from CVM-H v15.1 versus density
- 8 Document Density Formula for CVM-S4.26 and CCA06
- 9 Create a difference plot of densities
- 10 Notes on Central California Basin Model
- 11 Related Entries
Cross Section Plots
Plots and cross sections of CS173-H with basins added.
cs173 rho and vp/vs ratio maps
KML of CS17.3-H and other UCVM Registered Models
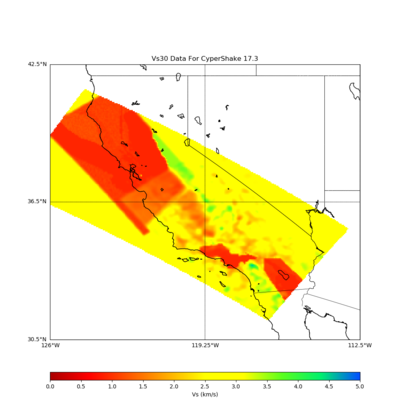
Vs30 Map from CS17.3
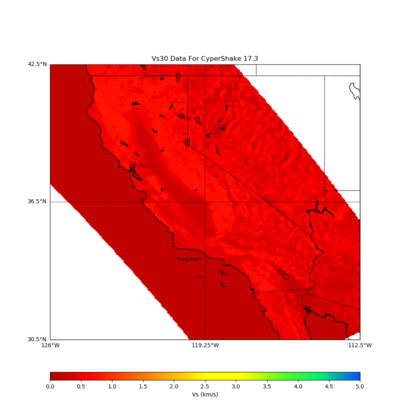
CS173 velocity model was defined by a mesh tiled from CCA06, CenCal, CVM-S4.26-M01 with 10km smoothing on each horizontal interface. We calculated Vs30 from this tiled model and plotted a Vs30 map for the region. We have a Central California Basin telecon and based on discussions, we want to produce some more plots of the CS173 velocity model to help with the analysis of it before and after the insertion of the San Joaquin Basin and the Santa Maria Basin.
- Extract from etree values (find method that gets vs30 from etree as used in ely gtl).
- Calculate vs30 map from model (using slowness formula)
Still, to be done, calculate vs30 map from model with Ely GTL (how to add Ely GTL to model, using slowness formula)
Identify the density algorithm used in CVM-S4.26 and CCA06
We tested to density algorithms and compared them to the density values we get from various CVMs in order to confirm how density was calculated for the tomography improved CVMS done by Tom Jordan's Full 3D tomography group. We tested two density scaling relationships against density values from CVM-S4.26, CCA06, and USGS Bay Area (CenCal)models.
Results comparing CVM's Density values to Density derived from Vp values
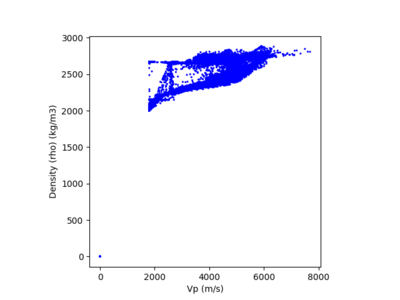
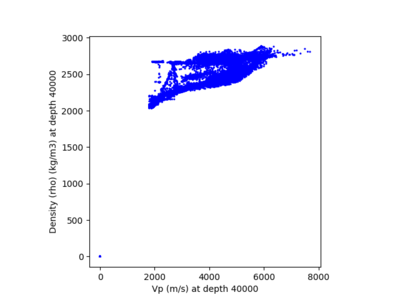
Vp versus Density (rho) Map from CS17.3
Researchers requested scatter plots of Vp versus Density scatter plots from CS173. Plot vp (vertical) and density (horizontal) (scaled from 0 to max value on each axis), at depths 0,10000,40000
Researchers requested scatter plots of Vp versus Density scatter plots from CS173. Plot vp (vertical) and density (horizontal) (scaled from 0 to max value on each axis), at depths 0,10000,40000
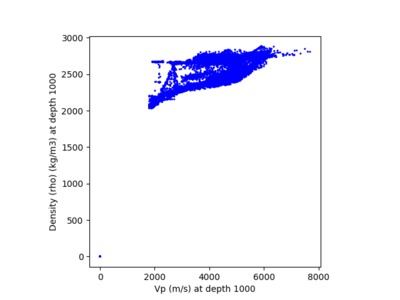
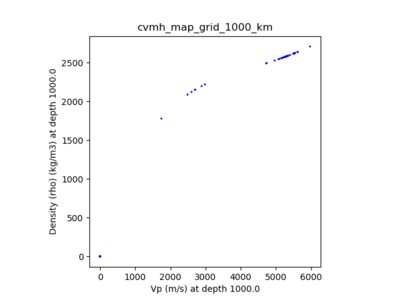
Scatter Plot Vp (X) from CVM-H v15.1 versus density
Document Density Formula for CVM-S4.26 and CCA06
The following scecpedia Wiki page that describes the density calculation done for cvms4.26 and CCA06 that uses vp and vs values UCVM_Density_Formula
Create a difference plot of densities
Create plots showing difference between cs173 model, and densities using density calculation, to determine if the density formula was used to create the density values in cs173. Also Create plots showing differences between CVM-S4.26 and formula (should be zero), and between CCA06, and formula.
Notes on Central California Basin Model
Notes by Andreas Plesch on Basin Model (15MB pptx)
