Difference between revisions of "CVM-H 15.1 Maps"
From SCECpedia
Jump to navigationJump to search| (19 intermediate revisions by the same user not shown) | |||
| Line 1: | Line 1: | ||
| − | == CVM-H 15.1 without Ely-Jordan GTL == | + | == Ely Jordan GTL Documentation == |
| + | *[http://hypocenter.usc.edu/research/UCVM/Ely-Vs30GTL.pdf Ely GTL Method Writeup] | ||
| + | *[http://hypocenter.usc.edu/research/UCVM/SeismicVelocityModel.webarchive Ely GTL Web archive] | ||
| + | |||
| + | == CVM-H Near Surface Plots == | ||
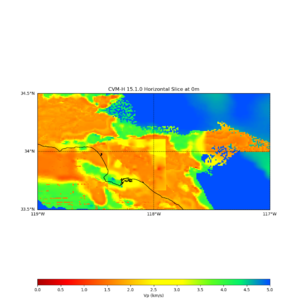
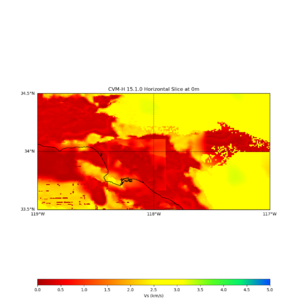
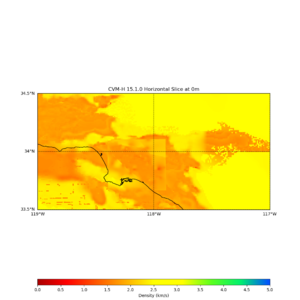
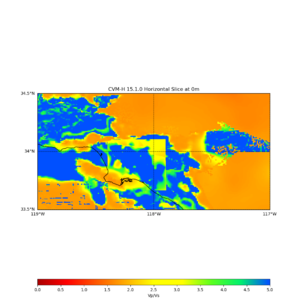
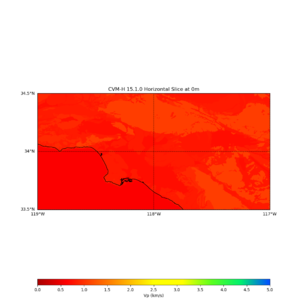
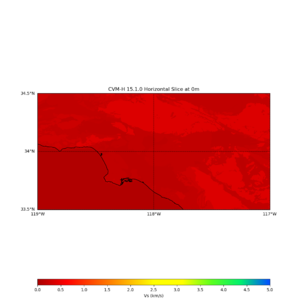
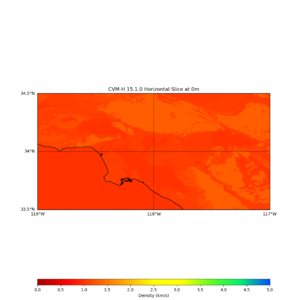
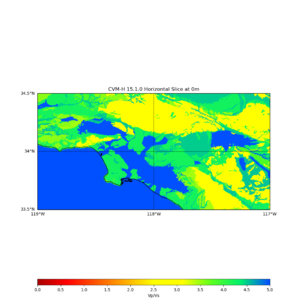
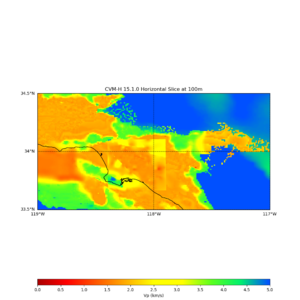
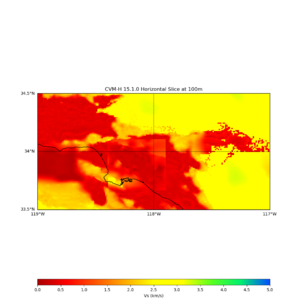
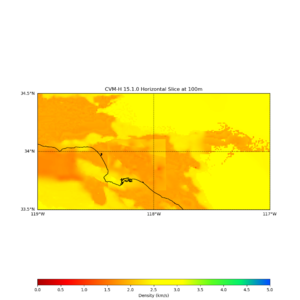
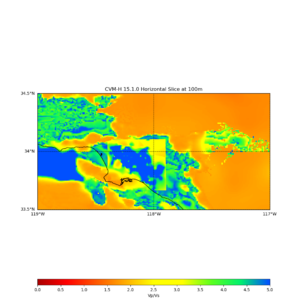
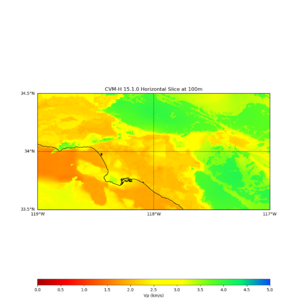
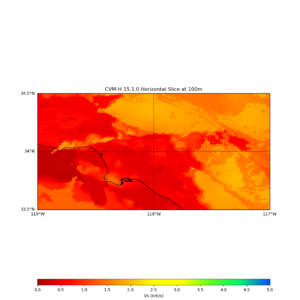
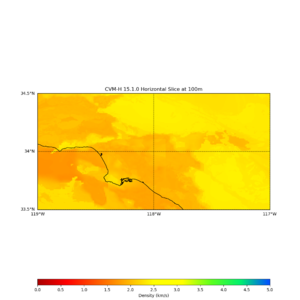
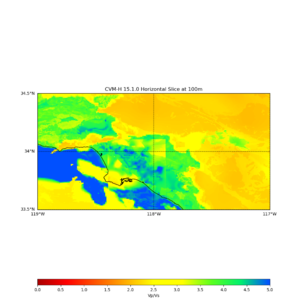
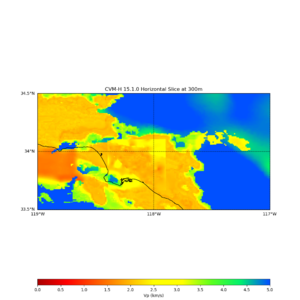
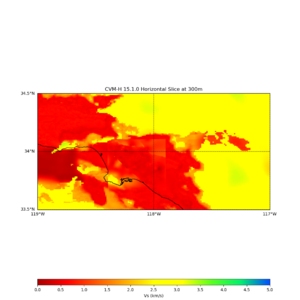
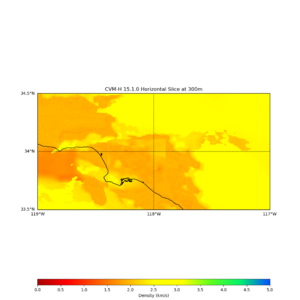
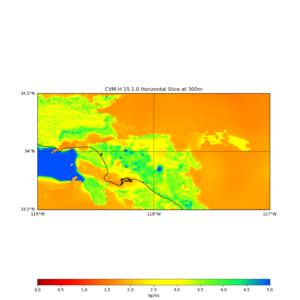
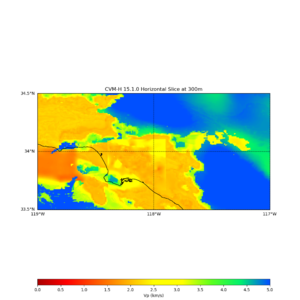
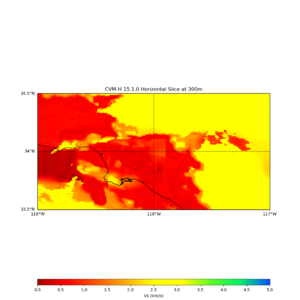
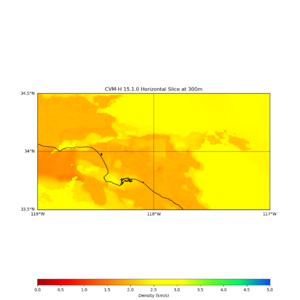
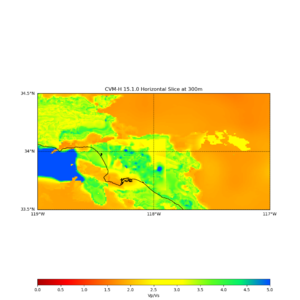
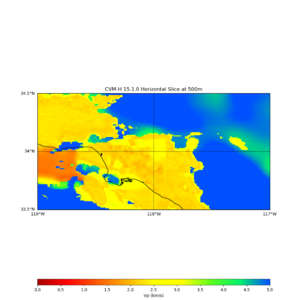
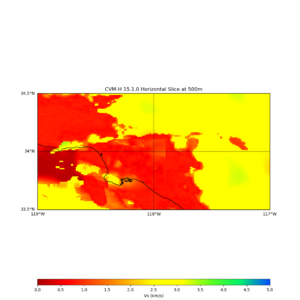
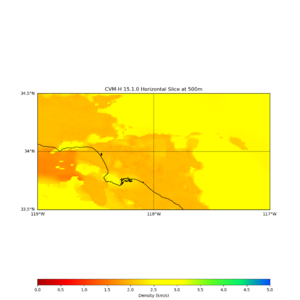
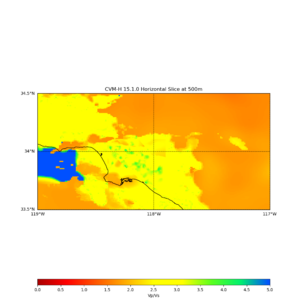
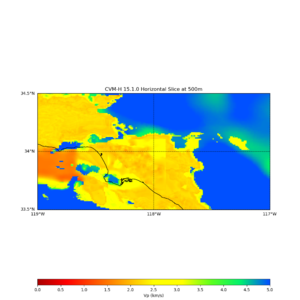
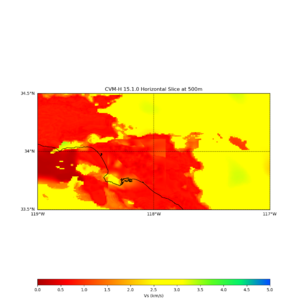
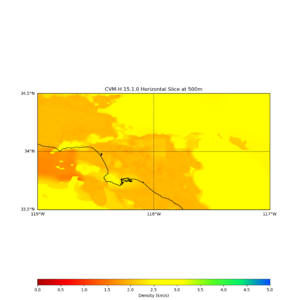
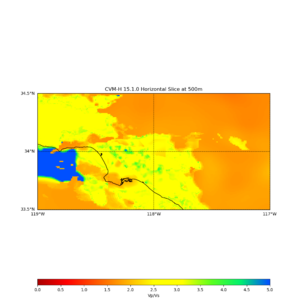
| + | The plots below show the characteristics of the CVM-H v15.1 velocity model for the Los Angeles region. The four columns show model properties including Vp, Vs, Density, and Vp/Vs Ratio. | ||
| + | There are multiple rows of data at depths 0m, 100m, 300m, and 500m. The expectation is that the GTL will affect the top 350m but not deeper. This plots the surface 0m, then 100m, 300m, and 500m. | ||
| + | There are two rows for each, one with the original CVM-H properties, and one with the Ely-Jordan GTL added. One consideration is that the CVM-H model is defined as query by elevation. UCVM accepts the query by depth, and converts it into a query by elevation internally. This could be a source of artifacts of properties at 0 depth. | ||
| + | |||
| + | == CVM-H 15.1 Near Surface Properties with and without optional Ely-Jordan GTL == | ||
{| class ="wikitable" | {| class ="wikitable" | ||
| − | |+ | + | |+ CVM-H v15.1 Properties (with and without the Ely-Jordan GTL) |
|- | |- | ||
| Depth | | Depth | ||
| Line 9: | Line 18: | ||
| Vp/Vs | | Vp/Vs | ||
|- | |- | ||
| − | | | + | | 0m - CVM-H |
| − | | [[cvmh_nogtl_vp_0_map.png]] | + | | [[Image:cvmh_nogtl_vp_0_map.png|thumb|300px]] |
| − | | [[cvmh_nogtl_vs_0_map.png ]] | + | | [[Image:cvmh_nogtl_vs_0_map.png|thumb|300px]] |
| − | | [[cvmh_nogtl_density_0_map.png ]] | + | | [[Image:cvmh_nogtl_density_0_map.png |thumb|300px]] |
| − | | [[cvmh_nogtl_poisson_0_map.png ]] | + | | [[Image:cvmh_nogtl_poisson_0_map.png |thumb|300px]] |
| + | |- | ||
| + | | 0m - ElyGTL | ||
| + | | [[Image:cvmh_gtl_vp_0_map.png|thumb|300px]] | ||
| + | | [[Image:cvmh_gtl_vs_0_map.png|thumb|300px]] | ||
| + | | [[Image:cvmh_gtl_density_0_map.png |thumb|300px]] | ||
| + | | [[Image:cvmh_gtl_poisson_0_map.png |thumb|300px]] | ||
| + | |- | ||
| + | | 100m - CVM-H | ||
| + | | [[Image:cvmh_nogtl_vp_100_map.png|thumb|300px]] | ||
| + | | [[Image:cvmh_nogtl_vs_100_map.png|thumb|300px]] | ||
| + | | [[Image:cvmh_nogtl_density_100_map.png |thumb|300px]] | ||
| + | | [[Image:cvmh_nogtl_poisson_100_map.png |thumb|300px]] | ||
| + | |- | ||
| + | | 100m - ElyGTL | ||
| + | | [[Image:cvmh_gtl_vp_100_map.png|thumb|300px]] | ||
| + | | [[Image:cvmh_gtl_vs_100_map.png|thumb|300px]] | ||
| + | | [[Image:cvmh_gtl_density_100_map.png |thumb|300px]] | ||
| + | | [[Image:cvmh_gtl_poisson_100_map.png |thumb|300px]] | ||
| + | |- | ||
| + | | 300m - CVM-H | ||
| + | | [[Image:cvmh_nogtl_vp_300_map.png|thumb|300px]] | ||
| + | | [[Image:cvmh_nogtl_vs_300_map.png|thumb|300px]] | ||
| + | | [[Image:cvmh_nogtl_density_300_map.png |thumb|300px]] | ||
| + | | [[Image:cvmh_nogtl_poisson_300_map.png |thumb|300px]] | ||
| + | |- | ||
| + | | 300m - ElyGTL | ||
| + | | [[Image:cvmh_gtl_vp_300_map.png|thumb|300px]] | ||
| + | | [[Image:cvmh_gtl_vs_300_map.png|thumb|300px]] | ||
| + | | [[Image:cvmh_gtl_density_300_map.png |thumb|300px]] | ||
| + | | [[Image:cvmh_gtl_poisson_300_map.png |thumb|300px]] | ||
| + | |- | ||
| + | | 500m - CVM-H | ||
| + | | [[Image:cvmh_nogtl_vp_500_map.png|thumb|300px]] | ||
| + | | [[Image:cvmh_nogtl_vs_500_map.png|thumb|300px]] | ||
| + | | [[Image:cvmh_nogtl_density_500_map.png |thumb|300px]] | ||
| + | | [[Image:cvmh_nogtl_poisson_500_map.png |thumb|300px]] | ||
| + | |- | ||
| + | | 500m - ElyGTL | ||
| + | | [[Image:cvmh_gtl_vp_500_map.png|thumb|300px]] | ||
| + | | [[Image:cvmh_gtl_vs_500_map.png|thumb|300px]] | ||
| + | | [[Image:cvmh_gtl_density_500_map.png |thumb|300px]] | ||
| + | | [[Image:cvmh_gtl_poisson_500_map.png |thumb|300px]] | ||
| + | |- | ||
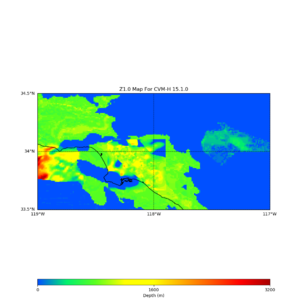
| + | | Z1.0 - CVM-H | ||
| + | | [[Image:cvmh_nogtl_z10_map.png | thumb|300px]] | ||
|- | |- | ||
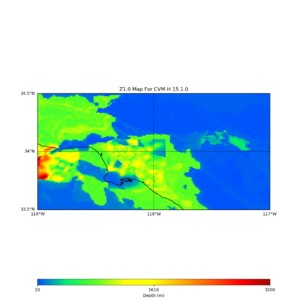
| − | | Z1.0 | + | | Z1.0 - ElyGTL |
| − | | | + | | [[Image:cvmh_gtl_z10_map.png | thumb|300px]] |
|- | |- | ||
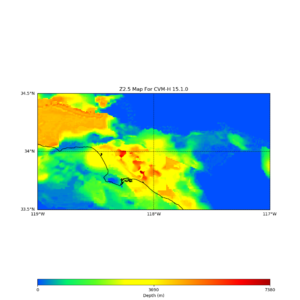
| − | | Z2.5 | + | | Z2.5 - CVM-H |
| − | |cvmh_nogtl_z25_map.png | + | | [[Image:cvmh_nogtl_z25_map.png | thumb|300px]] |
|- | |- | ||
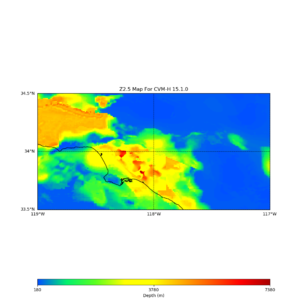
| − | | | + | | Z2.5 - ElyGTL |
| − | | | + | | [[Image:cvmh_gtl_z25_map.png | thumb|300px]] |
|- | |- | ||
| − | | Vs30 from Etree | + | | Vs30 from CVM-H |
| − | |cvmh_nogtl_vs30_etree_map.png | + | | [[Image:cvmh_nogtl_vs30_model_map.png |thumb|300px]] |
| + | |- | ||
| + | | Vs30 from ElyGTL | ||
| + | | [[Image:cvmh_gtl_vs30_model_map.png |thumb|300px]] | ||
| + | |- | ||
| + | | Vs30 from Etree in UCVM 18.5 using CVM-H | ||
| + | | [[Image:cvmh_nogtl_vs30_etree_map.png |thumb|300px]] | ||
| + | |- | ||
| + | | Vs30 from Etree in UCVM 18.5 using ElyGTL | ||
| + | | [[Image:cvmh_gtl_vs30_etree_map.png |thumb|300px]] | ||
|} | |} | ||
| − | + | *Plots, points (json format), and data (bin format) are posted online at: [http://hypocenter.usc.edu/research/UCVM/cvmh_no_ely_gtl/ Default CVM-H Map Plots and Data] | |
| + | *Plots, points (json format), and data (bin format) are posted online at: [http://hypocenter.usc.edu/research/UCVM/cvmh_ely_gtl/ CVM-H with ElyGTL Map Plots and Data] | ||
| + | |||
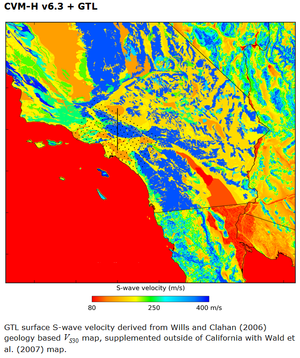
| + | == CVM-H GTL Plot == | ||
| + | *[[File:Cvm-h vs30gtl.png|thumb|300px|left]] | ||
== Related Entries == | == Related Entries == | ||
*[[UCVM]] | *[[UCVM]] | ||
Latest revision as of 16:42, 1 July 2018
Contents
Ely Jordan GTL Documentation
CVM-H Near Surface Plots
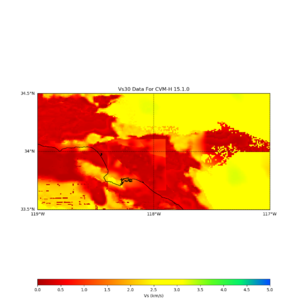
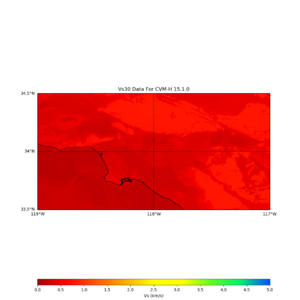
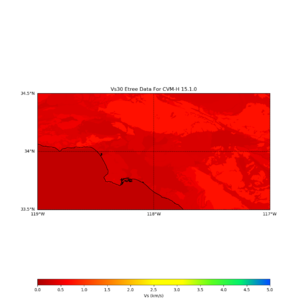
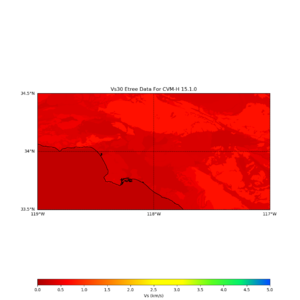
The plots below show the characteristics of the CVM-H v15.1 velocity model for the Los Angeles region. The four columns show model properties including Vp, Vs, Density, and Vp/Vs Ratio. There are multiple rows of data at depths 0m, 100m, 300m, and 500m. The expectation is that the GTL will affect the top 350m but not deeper. This plots the surface 0m, then 100m, 300m, and 500m. There are two rows for each, one with the original CVM-H properties, and one with the Ely-Jordan GTL added. One consideration is that the CVM-H model is defined as query by elevation. UCVM accepts the query by depth, and converts it into a query by elevation internally. This could be a source of artifacts of properties at 0 depth.
CVM-H 15.1 Near Surface Properties with and without optional Ely-Jordan GTL
| Depth | Vp | Vs | Density | Vp/Vs |
| 0m - CVM-H | ||||
| 0m - ElyGTL | ||||
| 100m - CVM-H | ||||
| 100m - ElyGTL | ||||
| 300m - CVM-H | ||||
| 300m - ElyGTL | ||||
| 500m - CVM-H | ||||
| 500m - ElyGTL | ||||
| Z1.0 - CVM-H | ||||
| Z1.0 - ElyGTL | ||||
| Z2.5 - CVM-H | ||||
| Z2.5 - ElyGTL | ||||
| Vs30 from CVM-H | ||||
| Vs30 from ElyGTL | ||||
| Vs30 from Etree in UCVM 18.5 using CVM-H | ||||
| Vs30 from Etree in UCVM 18.5 using ElyGTL |
- Plots, points (json format), and data (bin format) are posted online at: Default CVM-H Map Plots and Data
- Plots, points (json format), and data (bin format) are posted online at: CVM-H with ElyGTL Map Plots and Data
