Difference between revisions of "UCVMC How to process bin data"
From SCECpedia
Jump to navigationJump to search| Line 16: | Line 16: | ||
meta data contains many fields. Some of the fields are specific to the type | meta data contains many fields. Some of the fields are specific to the type | ||
| − | of the plot that were made. This plot is a plot of a horizontal slice, | + | of the plot that were made. This plot is a plot of a horizontal slice, therefore, it contains the following metadata |
lon_list | lon_list | ||
| Line 35: | Line 35: | ||
datapoints | datapoints | ||
depth | depth | ||
| + | |||
| + | (lon1,lat1) is the lower left corner of the plot and (lon2,lat2) is the upper right | ||
| + | corner of the plot. lon_list and lat_list are the ticks of the axis | ||
[http://hypocenter.usc.edu/research/UCVM/cvmh_no_ely_gtl/cvmh_nogtl_vs_0_map_meta.json metadata in json] | [http://hypocenter.usc.edu/research/UCVM/cvmh_no_ely_gtl/cvmh_nogtl_vs_0_map_meta.json metadata in json] | ||
Revision as of 21:11, 3 July 2018
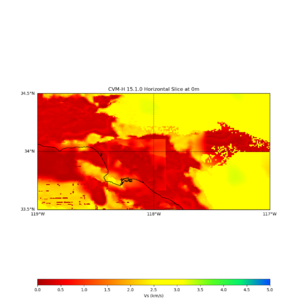
This is a horizontal plot
Plot
bin data file
metadata file
meta data contains many fields. Some of the fields are specific to the type of the plot that were made. This plot is a plot of a horizontal slice, therefore, it contains the following metadata
 lon_list
 lat_list
 lat1
 lon1
 lat2
 lon2
 datafile
 num_x
 num_y
 min
 max
 color
 data_type
 outfile
 cvm_selected
 datapoints
 depth
(lon1,lat1) is the lower left corner of the plot and (lon2,lat2) is the upper right corner of the plot. lon_list and lat_list are the ticks of the axis
