Difference between revisions of "UCVM svm1d"
From SCECpedia
Jump to navigationJump to search| Line 60: | Line 60: | ||
</pre> | </pre> | ||
| − | + | This plot shows the Z1.0 crossing values ranges from 0 to 80, | |
{| | {| | ||
| Line 73: | Line 73: | ||
|} | |} | ||
| − | with svm, | + | Horizontal plots ad 30m and 50m with cvms5 and svm, |
{| | {| | ||
| Line 80: | Line 80: | ||
|} | |} | ||
| − | + | Comparing at the same depth of 80m (there are very slight differences), | |
{| | {| | ||
| Line 87: | Line 87: | ||
|} | |} | ||
| − | + | Comparing at the same depth of 100m (wiki said they are identical image), | |
{| | {| | ||
Revision as of 21:12, 20 June 2019
Contents
GTL
Adding a new SVM gtl for UCVMC
- svmgtl
depth profiles
Target point: -118.4,34
echo "-118.4 34.0 " | basin_query -m cvms5 -f ../conf/ucvm.conf
returns the Z1.0 at 580.0
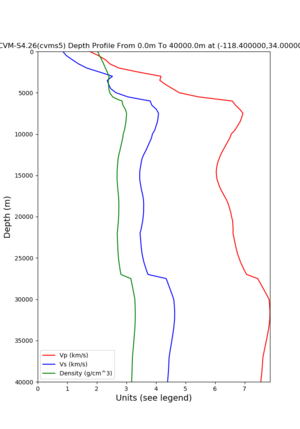
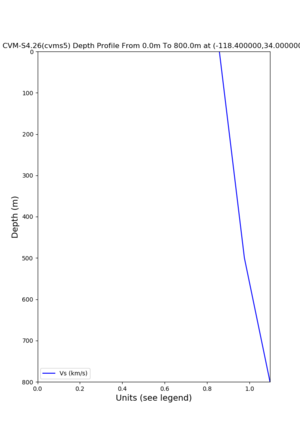
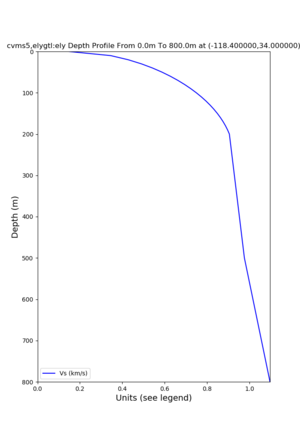
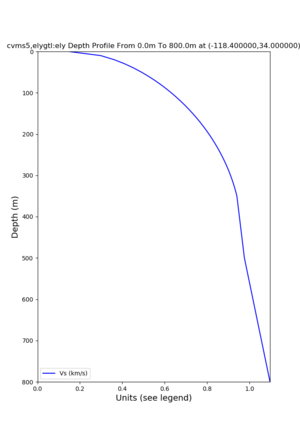
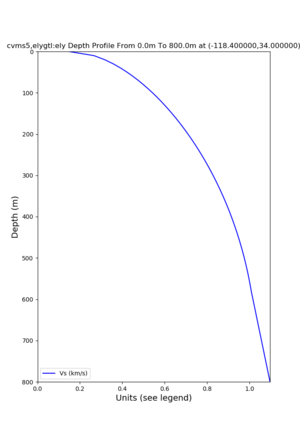
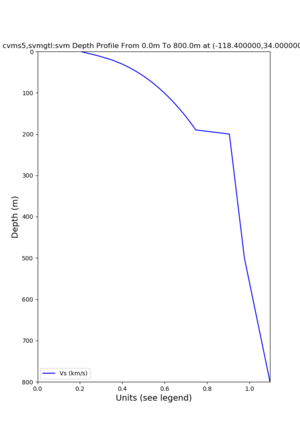
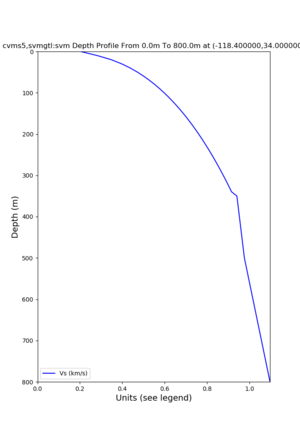
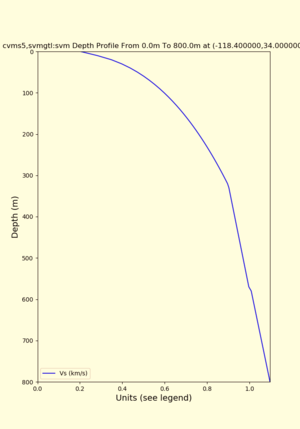
Profile plots,
commands used :
./plot_depth_profile.py -s 34,-118.4 -b 0  -e 40000 -d vs,vp,density -v 100 -c cvms5 -o cvms5_depth_nogtl_bkg.png
./plot_depth_profile.py -s 34,-118.4 -b 0  -e 800 -d vs -v 10 -c cvms5 -o cvms5_depth_nogtl_base.png
./plot_depth_profile.py -s 34,-118.4 -b 0  -e 800 -d vs -v 10 -c cvms5,elygtl:ely -z 0,200 -o cvms5_depth_elygtl_200.png
./plot_depth_profile.py -s 34,-118.4 -b 0  -e 800 -d vs -v 10 -c cvms5,elygtl:ely -z 0,350 -o cvms5_depth_elygtl_350.png
./plot_depth_profile.py -s 34,-118.4 -b 0  -e 800 -d vs -v 10 -c cvms5,elygtl:ely -Z 1000 -o cvms5_depth_elygtl_Z1.png
./plot_depth_profile.py -s 34,-118.4 -b 0  -e 800 -d vs -v 10 -c cvms5,svmgtl:svm -z 0,200 -o cvms5_depth_svmgtl_200.png
./plot_depth_profile.py -s 34,-118.4 -b 0  -e 800 -d vs -v 10 -c cvms5,svmgtl:svm -z 0,350 -o cvms5_depth_svmgtl_350.png
./plot_depth_profile.py -s 34,-118.4 -b 0  -e 800 -d vs -v 10 -c cvms5,svmgtl:svm -Z 1000 -o cvms5_depth_svmgtl_Z1.png
Near Garner Valley
Horizontal plots near Garner Valley,
Loc => -b 33.40,-116.859 -u 33.80,-116.30
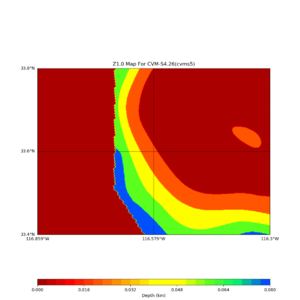
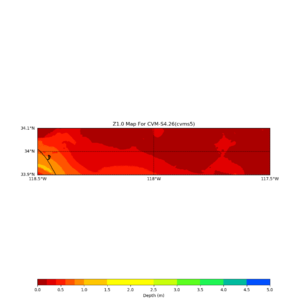
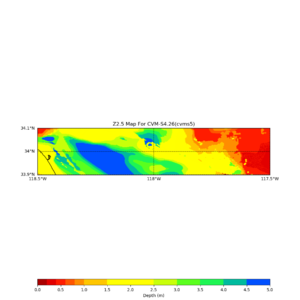
This plot shows the Z1.0 crossing values ranges from 0 to 80,
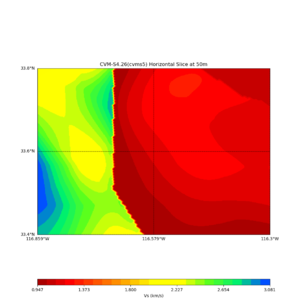
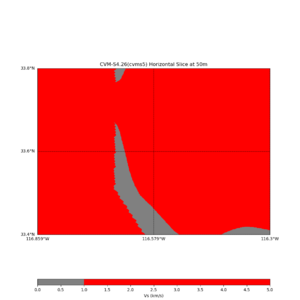
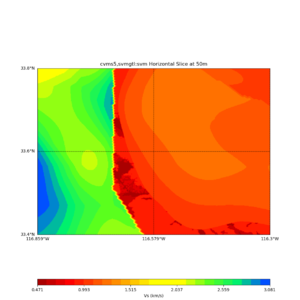
Horizontal plots at 50m depth with just cvms5,
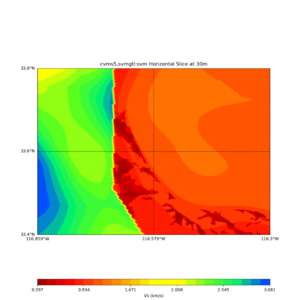
Horizontal plots ad 30m and 50m with cvms5 and svm,
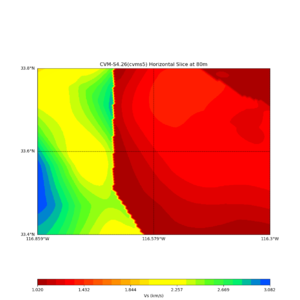
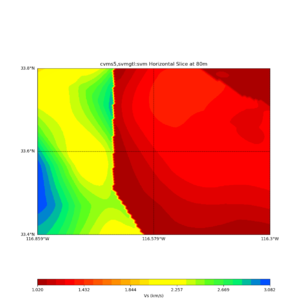
Comparing at the same depth of 80m (there are very slight differences),
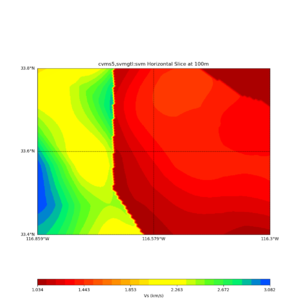
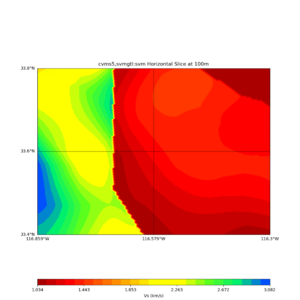
Comparing at the same depth of 100m (wiki said they are identical image),
Somewhere by the water
Near westside with cvms5, internal GTL disabled,
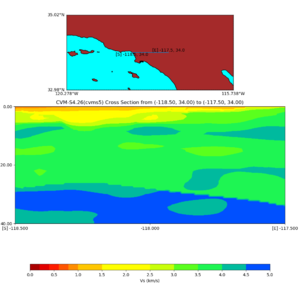
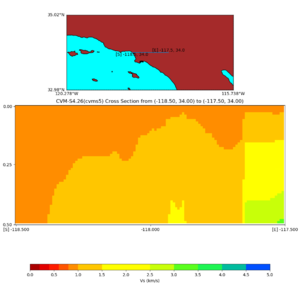
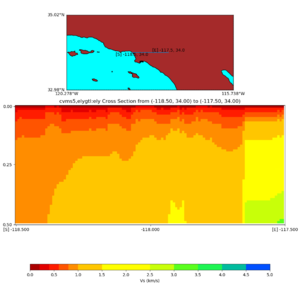
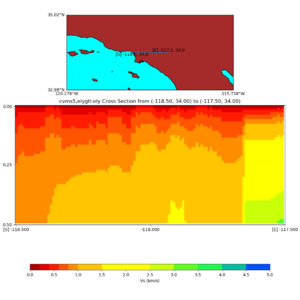
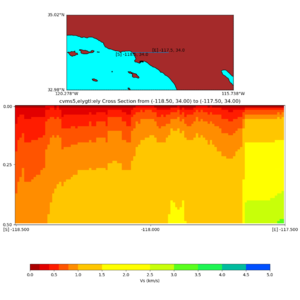
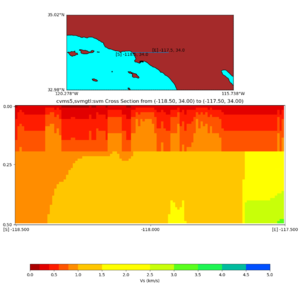
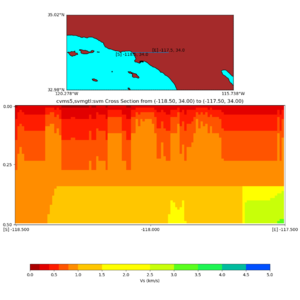
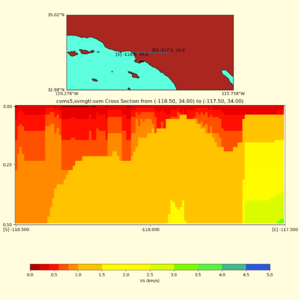
Depth cross plot,
sample commands used :
./plot_cross_section.py -b 34,-118.5 -u 34,-117.5 -h 700 -v 10 -d vs -c cvms5 -a d -s 0 -e 800 -o cvms5_cross_base.png
and,
./plot_cross_section.py -b 34,-118.5 -u 34,-117.5 -h 500 -v 10 -d vs -c cvms5,svmgtl:svm -a d -Z 1000 -s 0 -e 800 -o cvms5_cross_svmgtl_Z1.png
Additional Info
SVM interpolation function extracted by Elnaz from Jian's class_svm.py from https://github.com/jsh9/PySeismoSoil
// zmax would be the Z1.0 if there is one and vs30
// in data->gtl.vs

double calc_z1_from_Vs30(double vs30) {
  double z1 = 140.511*exp(-0.00303*vs30); // [m]
  return z1;
}

double calc_rho (double vs, double z) {
  if (z == 0.0) {
    z = 0.0001;
  }
  double lb = 1.65; //lower bound  [g/cm^3]
  double rho  = 1000.0 * max(lb, 1.0 + 1.0/ (0.614 + 58.7 * (log(z) + 1.095) / vs)); //[kg/m^3]
  return rho;
}


/* SVM interpolation method */
int ucvm_interp_svm(double zmin, double zmax, ucvm_ctype_t cmode, ucvm_point_t *pnt, ucvm_data_t *data) {

  // curve fitting parameters for SVM model
  double p1 = -2.1688E-04;
  double p2 =  0.5182    ;
  double p3 = 69.452     ;

  double r1 = -59.67     ;
  double r2 = -0.2722    ;
  double r3 = 11.132     ;

  double s1 =  4.110     ;
  double s2 = -1.0521E-04;
  double s3 = -10.827    ;
  double s4 = -7.6187E-03;

  double zstar = 2.5 ; // [m]
  double z1    = zmax; // z at which vs = 1000
  double vz1;

  double z     = data->depth; // interpolation depth

  double vs, k, n, vs0; // vs profiling parameters

  double vscap = 1000.0;
  double eta   = 0.9   ;
  double zeta, veta    ;

  double vs30   = data->gtl.vs;

  double nu = 0.3; // poisson ratio
  double vp_vs  = sqrt(2.0*(1.0-nu)/(1.0-2.0*nu));

  //~~~~~~~~~~~~~~~~~~~~~~~~~~~~~~~~~~~~~~~~~~~~
  switch (cmode) {
    case UCVM_COORD_GEO_DEPTH:
    case UCVM_COORD_GEO_ELEV:
    break;
    default:
    fprintf(stderr, "Unsupported coord type\n");
    return(UCVM_CODE_ERROR);
    break;
  }

  if (z < 0.0) {
    return(UCVM_CODE_NODATA);
  }

  // if no z1 data, compute empirically
  if (z1 == 0.0 || z1 == -1.0) {
    z1 = calc_z1_from_Vs30(vs30);
  }

  // query in crustal properties
  if (z >= z1) {
    data->cmb.vp     = data->crust.vp;
    data->cmb.vs     = data->crust.vs;
    data->cmb.rho    = data->crust.rho;
    data->cmb.source = UCVM_SOURCE_CRUST;
    return(UCVM_CODE_SUCCESS);
  }

  // z is between 0 and z1: query in SVM model
  vs0 = p1*pow(vs30,2.0) + p2*vs30 + p3;

  if (z1<=zstar) {
    vs  = min(vs0,vscap);
  }
  else { // z1 > zstar
    k   = exp(r1*pow(vs30,2.0) + r3);                    //  <<=== r2 ???
    n   = max(1.0, s1*exp(s2*vs30) + s3*exp(s4*vs30));
    vz1 = vs0*pow(1.0+k*(z1-zstar),1.0/n); // vs @ z1

    if (vz1 <= vscap) { // no need to cap the model
      if (z<=zstar) {
        vs = vs0;
      }
      else {
        vs = vs0*pow(1.0+k*(z-zstar),1.0/n);
      }
    }
    else { // vz1 > vscap -> need to cap the model with linear interpolation from zeta to z1
      veta = eta*vscap;
      zeta = (1.0/k)*(pow(veta/vs0,n)-1.0)+zstar; // depth at which vs = eta*vscap
      if (z <= zeta) {
        if (z<=zstar) {
          vs = vs0;
        }
        else {
          vs = vs0*pow(1.0+k*(z-zstar),1.0/n);
        }
      }
      else { // z>zeta -> linear interpolation
        vs   = veta + ((vcap-veta)/(z1-zeta))*(z-zeta);
      }
    }
  }

  data->cmb.vs     = vs;
  data->cmb.vp     = vp_vs * vs;
  data->cmb.rho    =  calc_rho(vs,z);
  data->cmb.source = data->gtl.source;
  return(UCVM_CODE_SUCCESS);
}
