Difference between revisions of "Testing UCVM Vs Values"
From SCECpedia
Jump to navigationJump to search| Line 17: | Line 17: | ||
</pre> | </pre> | ||
| − | |||
| − | |||
| − | |||
| + | [[Image:Locations.png|right|150px]] | ||
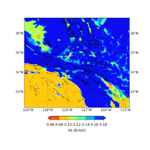
| + | The above points are plotted on this map. | ||
| + | == Map of Low Vs Values from UCVM == | ||
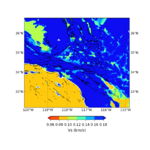
| + | This map shows Vs values for CVMS+elygtl (cvms5,elygtl:ely -z 0,1000). | ||
| + | [[Image:Fig slice vs 00km.png|right|150px]] | ||
== Related Entries == | == Related Entries == | ||
*[[UCVM]] | *[[UCVM]] | ||
Revision as of 05:17, 3 July 2020
Summary of testing low Vs values returned by UCVM for some velocity models when Ely GTL is applied
==
== UCVM users report low Vs values for the following points from CVM-S4.26 using elygtl.
lon, lat, Vs(m/s)
A: -115.1   32.6   93.916
B: -115.6   32.8   114.1
C: -115.78 33.2   90.0
D: -118.1   33.8   114.1
E: -118.0   34.8   119.234
F: -116.52 36.5   106.563
G: -119.5   36.0   114.1
The above points are plotted on this map.
Map of Low Vs Values from UCVM
This map shows Vs values for CVMS+elygtl (cvms5,elygtl:ely -z 0,1000).

