Difference between revisions of "Scenario ShakeMaps"
From SCECpedia
Jump to navigationJump to search| Line 2: | Line 2: | ||
The USGS has produced a series of scenario ShakeMaps for southern California posted here: [https://usgs.maps.arcgis.com/apps/webappviewer/index.html?id=14d2f75c7c4f4619936dac0d14e1e468 USGS Scenario ShakeMap archive.] | The USGS has produced a series of scenario ShakeMaps for southern California posted here: [https://usgs.maps.arcgis.com/apps/webappviewer/index.html?id=14d2f75c7c4f4619936dac0d14e1e468 USGS Scenario ShakeMap archive.] | ||
| + | == UCERF Earthquake Probabilities == | ||
Using a Newport Inglewood M7.2 and the first shock, UCERF probabilities for subsequent events are: | Using a Newport Inglewood M7.2 and the first shock, UCERF probabilities for subsequent events are: | ||
<pre> | <pre> | ||
| Line 14: | Line 15: | ||
</pre> | </pre> | ||
| + | == USGS Scenario ShakeMaps for selecte Events == | ||
{| class="wikitable" | {| class="wikitable" | ||
|- | |- | ||
Revision as of 18:50, 25 September 2023
Contents
Scenario ShakeMaps for Southern California
The USGS has produced a series of scenario ShakeMaps for southern California posted here: USGS Scenario ShakeMap archive.
UCERF Earthquake Probabilities
Using a Newport Inglewood M7.2 and the first shock, UCERF probabilities for subsequent events are:
Newport Inglewood: Main Shock
Palos Verdes: 2.01%
Compton: 1.58%
Anaheim: 0.38%
Newport-Inglewood (another rupture): 0.32%
Hollywood: 0.28%
Redondo Canyon: 0.27%
Santa Monica: 0.25%
USGS Scenario ShakeMaps for selecte Events
| Scenario EQ | UCERF3 Prob (%) | ShakeMap |
|---|---|---|
| Newport Inglewood: | First Event | 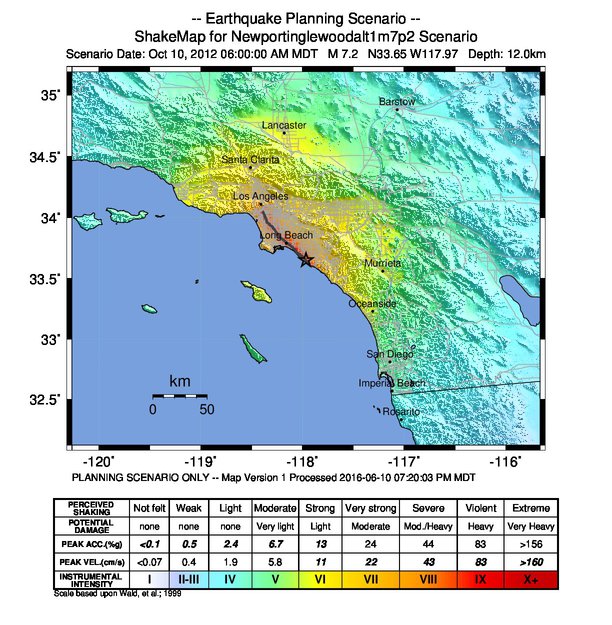
|
| Palos Verdes | 2.01% | 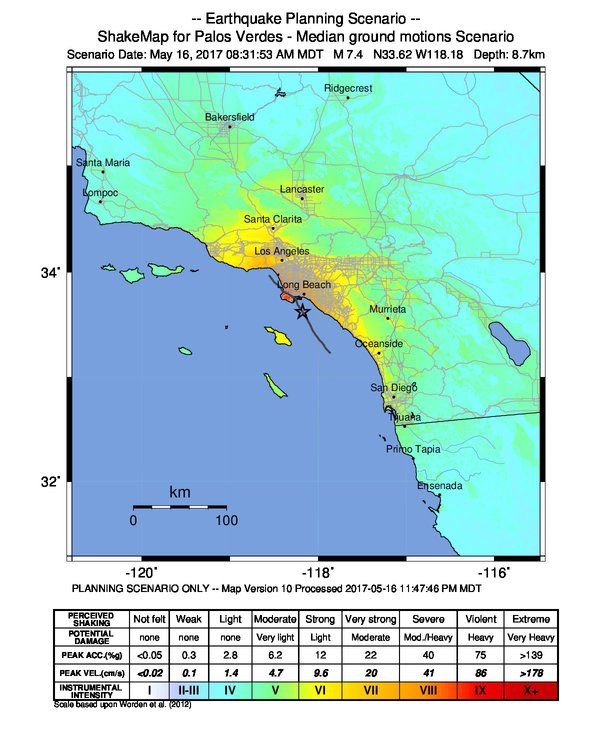
|
| Compton | 1.58% | 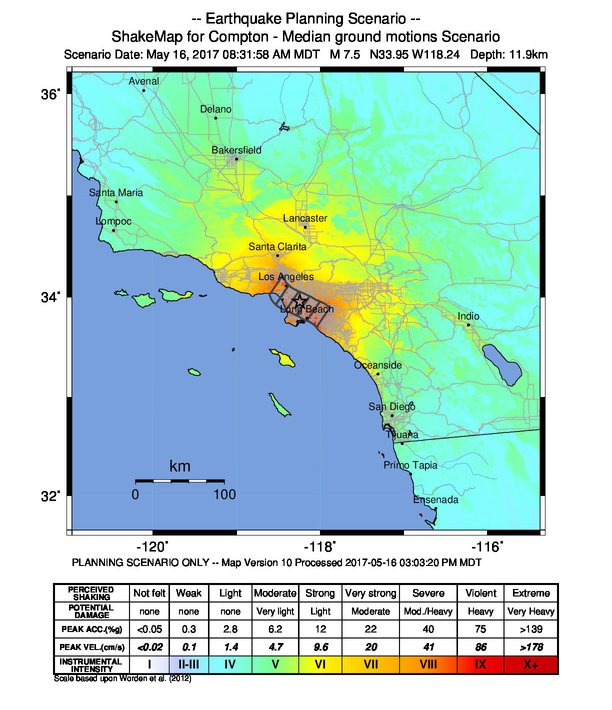
|
| Anaheim | 0.38% | 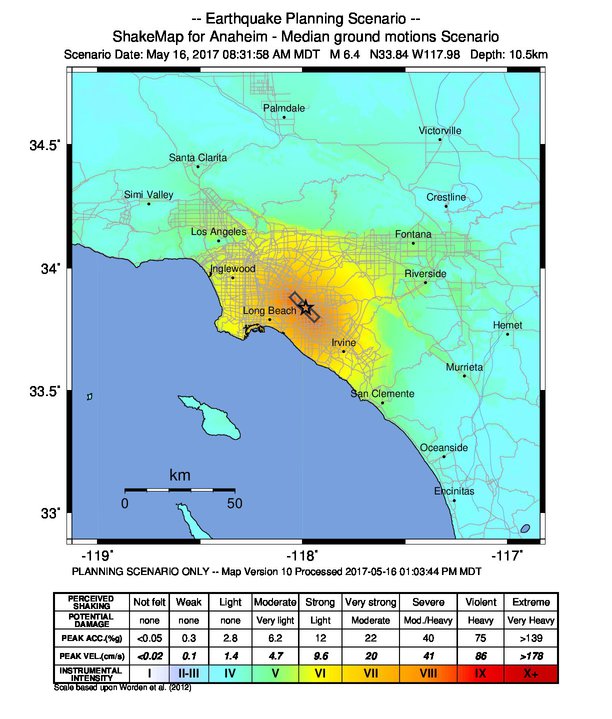
|
| Hollywood | 0.28% | 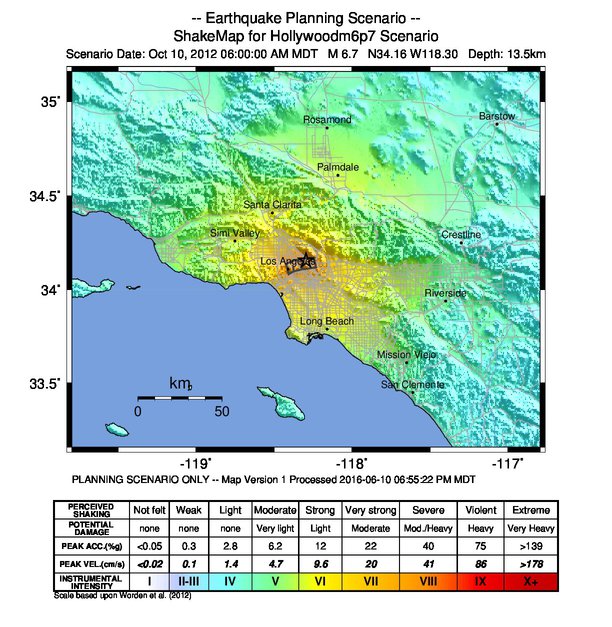
|
| Redondo Canyon | 0.27% | 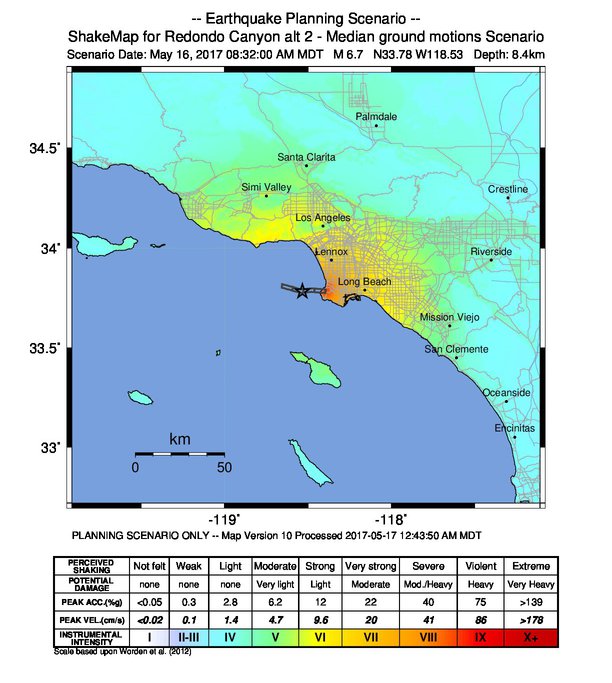
|
| Santa Monica | 0.25% | 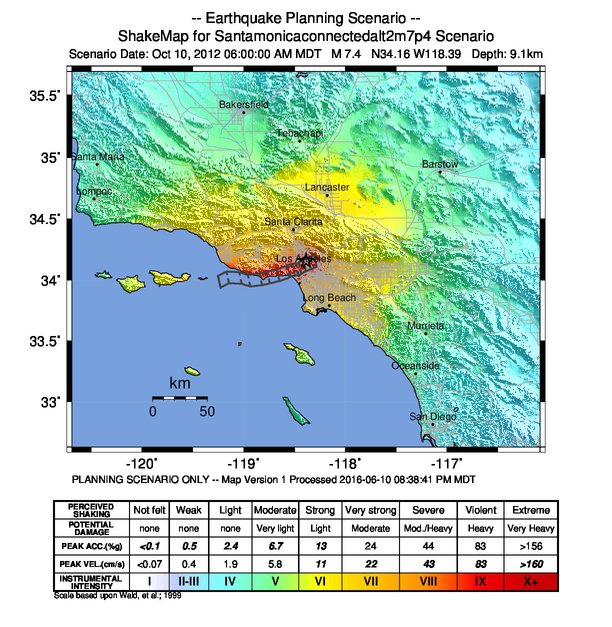
|
| Puente Hills | <0.25% | 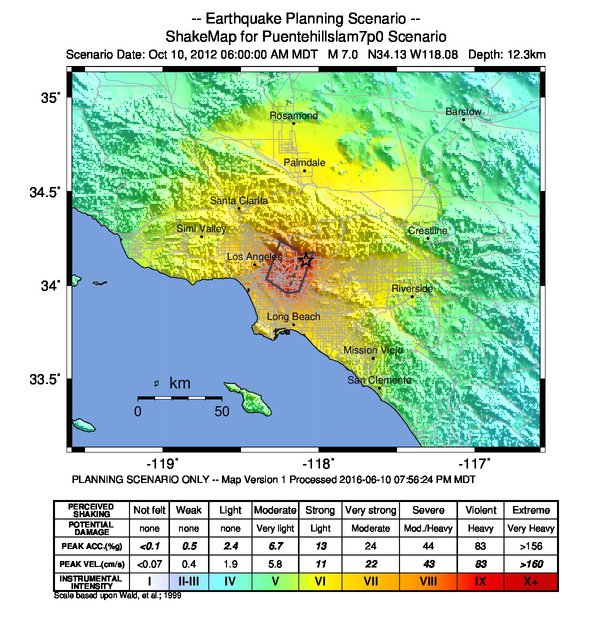
|