Difference between revisions of "GoF Map Plotter"
From SCECpedia
Jump to navigationJump to search| (2 intermediate revisions by one other user not shown) | |||
| Line 12: | Line 12: | ||
= Download = | = Download = | ||
| − | The tool can be downloaded from | + | The tool can be downloaded from: |
| + | http://hypocenter.usc.edu/research/tars/gof_map_plot.zip | ||
= Usage = | = Usage = | ||
<pre> | <pre> | ||
| − | usage: dopvm.py [inputfile] <zone> <ncol> <s_col> <s_label> <o_col> <o_label> <gof> <clabel> <units> <cmult> | + | usage: dopvm.py [inputfile] <zone> <ncol> <s_col> <s_label> <o_col> <o_label> <gof> <clabel> <units> <cmult> <display> |
[inputfile] is a single input file that needs to be processed. (Required) | [inputfile] is a single input file that needs to be processed. (Required) | ||
| Line 32: | Line 33: | ||
<units> Color bar units. | <units> Color bar units. | ||
<cmult> Color bar multiplier. | <cmult> Color bar multiplier. | ||
| + | <display> Display plots on screen T/F. (Default False) | ||
</pre> | </pre> | ||
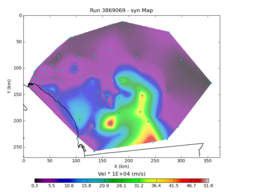
[[File:3869069_syn_map.png|256px|thumb|right|GoF Map Plotter PGV map.]] | [[File:3869069_syn_map.png|256px|thumb|right|GoF Map Plotter PGV map.]] | ||
| Line 37: | Line 39: | ||
<pre> | <pre> | ||
| − | dopvm.py pgv_gof.txt 11 2 7 2 "syn" 3 "obs" "false" "Vel" "m/s" 10000 | + | dopvm.py pgv_gof.txt 11 2 7 2 "syn" 3 "obs" "false" "Vel" "m/s" 10000 "true" |
</pre> | </pre> | ||
Latest revision as of 00:24, 6 June 2013
Overview
GoF Map Plotter is a set of codes for producing map plot with GoF values as overlays. These plots are similar to the ones produced by Mayhew-Olsen in their Goodness-of-fit paper.
The tool makes use of standard software packages including:
- Python v2.6+
- Numpy
- Matplotlib
- Pyproj
Download
The tool can be downloaded from: http://hypocenter.usc.edu/research/tars/gof_map_plot.zip
Usage
usage: dopvm.py [inputfile] <zone> <ncol> <s_col> <s_label> <o_col> <o_label> <gof> <clabel> <units> <cmult> <display>

        [inputfile]     is a single input file that needs to be processed. (Required)
	<zone> 		is the UTM zone where stations are located. (Default zone 11)
	       		(only single UTM zone can be handled during a run)
	<ncols> 	Number of columns of data. (Default 1)
	<scode_col>	Site code column number.
	<s_col> 	Synthetic data column number. (Default 2)
	<s_label> 	Label for Synthetic data.
	<o_col> 	Observed data column number. (Default 3, if ncols >1)
	<o_label> 	Observed data label
	<gof> 		Calculate GoF for s_col and o_col and plot map. T/F (Default False)
	<clabel>	Color bar label.
	<units>		Color bar units.
	<cmult>		Color bar multiplier.
	<display>	Display plots on screen T/F. (Default False)
Example:
dopvm.py pgv_gof.txt 11 2 7 2 "syn" 3 "obs" "false" "Vel" "m/s" 10000 "true"
 Listing of pgv_gof.txt:

 33.57526 -116.22584 0.000145 0.000683 m/s 62.8 km CI:TOR:peak ground velocity smi://caltech.gps.edu/onsite/cinnabar/vs/18446744071631306795 CI 10931805
 34.15738 -115.14513 0.000031 0.000071 m/s 167.4 km CI:IRM:peak ground velocity smi://caltech.gps.edu/onsite/cinnabar/vs/18446744071631306719 CI 10931805
 ...
 ...
