Difference between revisions of "CyberShake 1D Model"
From SCECpedia
Jump to navigationJump to search| Line 10: | Line 10: | ||
[http://hypocenter.usc.edu/research/plots/1dcybershake/plot_CVM-S_Vs_avg.pdf Vs average plot] <br /> | [http://hypocenter.usc.edu/research/plots/1dcybershake/plot_CVM-S_Vs_avg.pdf Vs average plot] <br /> | ||
[http://hypocenter.usc.edu/research/plots/1dcybershake/plot_CVM-S_Rho_avg.pdf Rho average plot] | [http://hypocenter.usc.edu/research/plots/1dcybershake/plot_CVM-S_Rho_avg.pdf Rho average plot] | ||
| + | |||
| + | [[Image:plot_CVM-S_Vs_avg.pdf|right|150px]] | ||
=== CVM-S4.26 === | === CVM-S4.26 === | ||
Revision as of 16:10, 24 January 2014
1D Model Selection for CyberShake
Currently, there are multiple alternative 1D models being evaluated for the next CyberShake run.
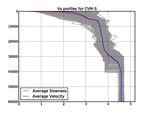
Below are plots averaging each CVM (CVM-S4, CVM-S4.26, and CVM-H 11.9.1 with GTL) over the 286 stations included within the last CyberShake 13.4 study.
CVM-S
Vp average plot
Vs average plot
Rho average plot
CVM-S4.26
Vp average plot
Vs average plot
Rho average plot