Difference between revisions of "CyberShake Deterministic MCEr Calculations"
(Created page with 'Original CyberShake MCEr results have been presented which include all UCERF2 ruptures, including aleatory magnitude variability. Is has come to our attention that the NSHMP does…') |
|||
| (13 intermediate revisions by 2 users not shown) | |||
| Line 1: | Line 1: | ||
| − | Original CyberShake MCEr results have been presented which include all UCERF2 ruptures, including aleatory magnitude variability. | + | Original CyberShake MCEr results have been presented which include all UCERF2 ruptures in deterministic calculations, including aleatory magnitude variability. It has come to our attention that the NSHMP does not include aleatory magnitude variability when calculating deterministic hazard spectrum and we have modified our calculation procedure to remove the aleatory variability. These results are not yet final, pending receiving a list of sources/magnitudes used by the NSHMP for UCERF2 based deterministic calculations. Once we have that list we can verify our approach. |
| − | For more background on a the algorithm to remove aleatory magnitude variability, see [CyberShake_UCERF3_Migration#Aleatory_Magnitude_Variability_Test] | + | For more background on a the algorithm to remove aleatory magnitude variability, see [[CyberShake_UCERF3_Migration#Aleatory_Magnitude_Variability_Test|this page]]. |
| + | |||
| + | == Initial results, 2s RotD100 == | ||
| + | |||
| + | {| border="1" | ||
| + | ! Dataset | ||
| + | ! Probabilistic MCER (UNCHANGED) | ||
| + | ! Deterministic MCER | ||
| + | ! Deterministic Lower Limit (UNCHANGED) | ||
| + | ! Combined MCER results | ||
| + | |- | ||
| + | ! Original CyberShake 2s | ||
| + | | [[File:Det_demo_orig_prob_mcer_psv_contours.png|thumb|250px]] | ||
| + | | [[File:Det_demo_orig_det_mcer_psv_contours.png|thumb|250px]] | ||
| + | | [[File:Det_demo_orig_det_lower_limit_psv_contours.png|thumb|250px]] | ||
| + | | [[File:Det_demo_orig_combined_mcer_psv_contours.png|thumb|250px]] | ||
| + | |- | ||
| + | ! New Deterministic Algorithm, 2s | ||
| + | | [[File:Det_demo_new_prob_mcer_psv_contours.png|thumb|250px]] | ||
| + | | [[File:Det_demo_new_det_mcer_psv_contours.png|thumb|250px]] | ||
| + | | [[File:Det_demo_new_det_lower_limit_psv_contours.png|thumb|250px]] | ||
| + | | [[File:Det_demo_new_combined_mcer_psv_contours.png|thumb|250px]] | ||
| + | |} | ||
| + | |||
| + | === Governing Scatter Plots === | ||
| + | |||
| + | I have generated a new set of plots which shows the value that governs at each CyberShake site. This shows where the (now lower) deterministic values govern the MCEr value at 2s. | ||
| + | |||
| + | As a reminder, the final combined MCEr value is min(probabilistic, max(deterministic, deterministic_lower_limit)). | ||
| + | |||
| + | '''<span style="color: blue">BLUE: Probabilistic Value Governs</span>''' | ||
| + | |||
| + | '''<span style="color: red">RED: Deterministic Value Governs</span>''' | ||
| + | |||
| + | '''<span style="color: gray">GRAY: Deterministic Lower Limit Value Governs</span>''' | ||
| + | |||
| + | ==== Original Governing Scatter ==== | ||
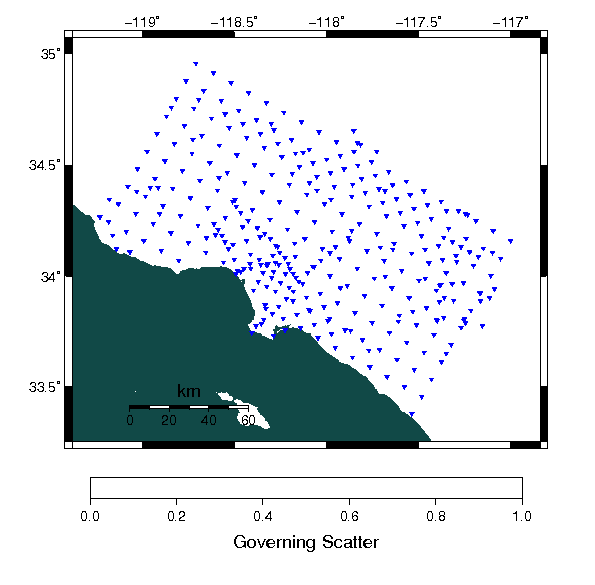
| + | As you can see below, originally all sites were governed by the probabilistic values (all sites are blue). | ||
| + | |||
| + | [[File:Det_demo_orig_overning_scatter_psv.png]] | ||
| + | |||
| + | ==== New Deterministic Algorithm Governing Scatter ==== | ||
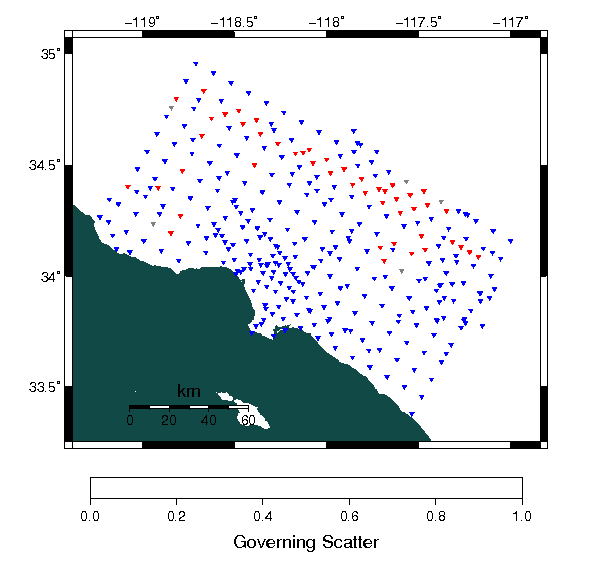
| + | Now a number of sites are governed by the deterministic values (both red, deterministic value, and gray, deterministic lower limit), especially along the San Andreas Fault. | ||
| + | |||
| + | [[File:Det_demo_new_overning_scatter_psv.png]] | ||
| + | |||
| + | == Description of MCER Methods == | ||
| + | |||
| + | *Probabilistic MCEr: | ||
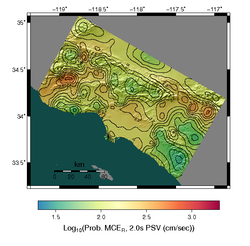
| + | This is computed from long term time independent probabilistic RotD100 hazard curves. For GMPE based calculations, we scale the RotD50 curves (the NGA-W2 models only provide RotD50) to RotD100 using empirical scaling relationships. For CyberShake, we extract RotD100 directly from the seismograms and compute hazard curves directly using those PSA values. We then compute a Risk Targeted Ground Motion (RTGM) value for each hazard curve, which is the probabilisitic MCEr value at the given period. If you aren't familiar with RTGM, I'll do my best to describe it. It replaces prior uniform hazard spectrum (UHS) results (such as 2% in 50 years) with a fixed risk value (x% probability of collapse), and convolves each hazard curve with a fragility function, using the entire hazard curve as opposed to a single UHS value. | ||
| + | |||
| + | *Deterministic MCEr: | ||
| + | |||
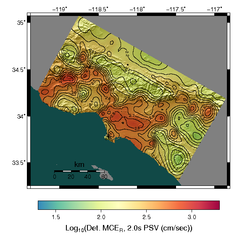
| + | As you suspected, the updated deterministic results are calculated by removing the aleatory magnitude variability. I use the CyberShake rupture with highest probability as the deterministic rupture from each characteristic UCERF2 source (floating rupture sources don't include this variability and are used as is). We then calculate the 84th percentile RotD100 PSA value from all of the rupture variations for each deterministic rupture, select the greatest for an individual site, which is the Deterministic MCEr value. | ||
| + | |||
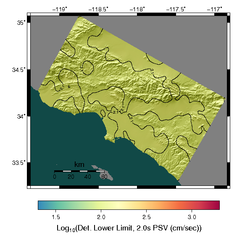
| + | *Deterministic Lower Limit: | ||
| + | |||
| + | The building code specifies a lower limit to the deterministic value. This is period dependent is calculated from Vs30 and T sub L data (I'm not exactly sure what the latter is but I received this data from people at USGS Golden). | ||
| + | |||
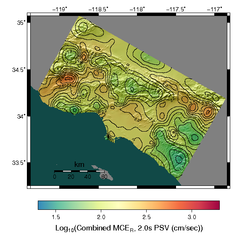
| + | *Combined MCEr: | ||
| + | |||
| + | We combined MCEr at each site/period as: | ||
| + | |||
| + | Combined MCEr = min[Prob. MCEr, max(Det. MCEr, Det. Lower Limit)] | ||
| + | |||
| + | The Governing Scatter plots at the bottom of that wiki page shows which of those values governs at each CyberShake site. | ||
| + | |||
| + | == MCER Map Description == | ||
| + | CyberShake Study 15.4 probabilistic Maximum Considered Earthquake Response (MCEr) map for the Los Angeles region. MCEr is used by structural engineers to design earthquake resilient buildings compliant with the International Building Code. Warm colors, representing areas of higher risk, correspond to sedimentary basins near Ventura (left center), Los Angeles (center), and San Bernardino (right center). | ||
| + | |||
| + | == Related Pages == | ||
| + | *[[CyberShake]] | ||
Latest revision as of 18:19, 16 October 2015
Original CyberShake MCEr results have been presented which include all UCERF2 ruptures in deterministic calculations, including aleatory magnitude variability. It has come to our attention that the NSHMP does not include aleatory magnitude variability when calculating deterministic hazard spectrum and we have modified our calculation procedure to remove the aleatory variability. These results are not yet final, pending receiving a list of sources/magnitudes used by the NSHMP for UCERF2 based deterministic calculations. Once we have that list we can verify our approach.
For more background on a the algorithm to remove aleatory magnitude variability, see this page.
Contents
Initial results, 2s RotD100
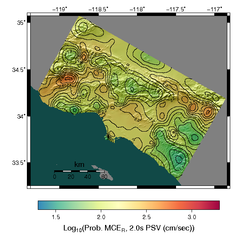
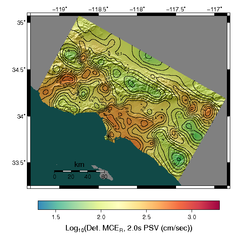
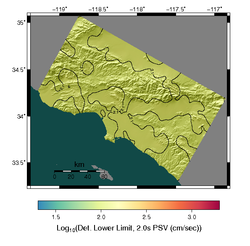
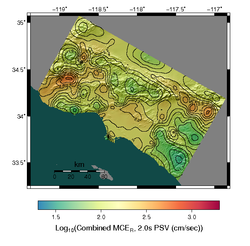
| Dataset | Probabilistic MCER (UNCHANGED) | Deterministic MCER | Deterministic Lower Limit (UNCHANGED) | Combined MCER results |
|---|---|---|---|---|
| Original CyberShake 2s | ||||
| New Deterministic Algorithm, 2s |
Governing Scatter Plots
I have generated a new set of plots which shows the value that governs at each CyberShake site. This shows where the (now lower) deterministic values govern the MCEr value at 2s.
As a reminder, the final combined MCEr value is min(probabilistic, max(deterministic, deterministic_lower_limit)).
BLUE: Probabilistic Value Governs
RED: Deterministic Value Governs
GRAY: Deterministic Lower Limit Value Governs
Original Governing Scatter
As you can see below, originally all sites were governed by the probabilistic values (all sites are blue).
New Deterministic Algorithm Governing Scatter
Now a number of sites are governed by the deterministic values (both red, deterministic value, and gray, deterministic lower limit), especially along the San Andreas Fault.
Description of MCER Methods
- Probabilistic MCEr:
This is computed from long term time independent probabilistic RotD100 hazard curves. For GMPE based calculations, we scale the RotD50 curves (the NGA-W2 models only provide RotD50) to RotD100 using empirical scaling relationships. For CyberShake, we extract RotD100 directly from the seismograms and compute hazard curves directly using those PSA values. We then compute a Risk Targeted Ground Motion (RTGM) value for each hazard curve, which is the probabilisitic MCEr value at the given period. If you aren't familiar with RTGM, I'll do my best to describe it. It replaces prior uniform hazard spectrum (UHS) results (such as 2% in 50 years) with a fixed risk value (x% probability of collapse), and convolves each hazard curve with a fragility function, using the entire hazard curve as opposed to a single UHS value.
- Deterministic MCEr:
As you suspected, the updated deterministic results are calculated by removing the aleatory magnitude variability. I use the CyberShake rupture with highest probability as the deterministic rupture from each characteristic UCERF2 source (floating rupture sources don't include this variability and are used as is). We then calculate the 84th percentile RotD100 PSA value from all of the rupture variations for each deterministic rupture, select the greatest for an individual site, which is the Deterministic MCEr value.
- Deterministic Lower Limit:
The building code specifies a lower limit to the deterministic value. This is period dependent is calculated from Vs30 and T sub L data (I'm not exactly sure what the latter is but I received this data from people at USGS Golden).
- Combined MCEr:
We combined MCEr at each site/period as:
Combined MCEr = min[Prob. MCEr, max(Det. MCEr, Det. Lower Limit)]
The Governing Scatter plots at the bottom of that wiki page shows which of those values governs at each CyberShake site.
MCER Map Description
CyberShake Study 15.4 probabilistic Maximum Considered Earthquake Response (MCEr) map for the Los Angeles region. MCEr is used by structural engineers to design earthquake resilient buildings compliant with the International Building Code. Warm colors, representing areas of higher risk, correspond to sedimentary basins near Ventura (left center), Los Angeles (center), and San Bernardino (right center).
