Difference between revisions of "CyberShake 1.0"
| (11 intermediate revisions by the same user not shown) | |||
| Line 5: | Line 5: | ||
Data products from this study are available [[CyberShake 1.0 Data Products | here]]. | Data products from this study are available [[CyberShake 1.0 Data Products | here]]. | ||
| − | The Hazard Dataset ID for this study is 1. | + | The SQLite database for this study is available at /home/scec-04/tera3d/CyberShake/sqlite_studies/study_1_0/study_1_0.sqlite . It can be accessed using a SQLite client. |
| + | |||
| + | The Hazard Dataset ID for this study is 1. The previously computed sites were done with ERF_ID=34 instead of 35 (the only difference is that 34 is just So Cal, and 35 is statewide), and those have a Hazard Dataset ID of 13. | ||
== Computational Status == | == Computational Status == | ||
Study 1.0 began Thursday, April 16, 2009 at 11:40, and ended on Wednesday, June 10, 2009 at 06:03 (56.8 days; 1314.4 hrs) | Study 1.0 began Thursday, April 16, 2009 at 11:40, and ended on Wednesday, June 10, 2009 at 06:03 (56.8 days; 1314.4 hrs) | ||
| + | |||
| + | == Sites == | ||
| + | |||
| + | A KML file with all the sites is available here: [http://scecdata.usc.edu/cybershake/sites.kml Sites KML] | ||
| + | |||
| + | == Workflow tools == | ||
| + | |||
| + | We used Condor glideins and clustering to reduce the number of submitted jobs. | ||
| + | |||
| + | Here's a schematic of the workflow: [[File:CyberShake_1.0_workflow_schematic.jpg]] | ||
== Performance Metrics == | == Performance Metrics == | ||
| + | |||
| + | These are plots of the jobs and cores used through June 10: | ||
| + | |||
| + | {| | ||
| + | | [[File:CyberShake_1.0_jobs.png|thumb|400px]] | ||
| + | | [[File:CyberShake_1.0_cores.png|thumb|400px]] | ||
| + | |} | ||
| + | |||
| + | === Application-level metrics === | ||
| + | |||
| + | *Hazard curves calculated for 223 sites | ||
| + | *Elapsed time: 54 days, 18 hours (1314.5 hours) | ||
| + | *Downtime (periods when blocked from running for >24 hours): 107.5 hours | ||
| + | *Uptime: 1207 hours | ||
| + | *Site completed every 5.36 hours | ||
| + | *Average post-processing took 11.07 hours | ||
| + | *Averaged 3.8 million tasks/day (44 tasks/sec) | ||
| + | |||
| + | *16 top-level SGT workflows, with 223 sub workflows | ||
| + | *223 top-level PP workflows, with about 18063 sub workflows | ||
| + | |||
| + | *Averaged running on 4424 cores (peak 14544, 23% of Ranger) | ||
| + | |||
| + | === File metrics === | ||
| + | |||
| + | *Temp files: 2 million files, 165.3 TB (velocity meshes, temporary SGTs, extracted SGTs, 760 GB/site) | ||
| + | *Output files: 190 million files, 10.6 TB (SGTs, seismograms, PSA files, 50 GB/site) | ||
| + | *File transfers: 35,000 zipped files, 1.8 TB (156 files, 8 GB/site) | ||
| + | |||
| + | === Job metrics === | ||
| + | |||
| + | *About 192 million tasks (861,000 tasks/site) | ||
| + | *3,893,665 Condor jobs | ||
| + | |||
| + | *Average of 9 jobs running on Ranger (peak 40) | ||
Latest revision as of 16:53, 7 May 2021
CyberShake 1.0 refers to our first CyberShake study which calculated a full hazard map (223 sites + 49 previously computed sites) for Southern California. This study used Graves & Pitarka (2007) rupture variations, Rob Graves' emod3d code for SGT generation, and the CVM-S velocity model. Both the SGTs and post-processing was done on TACC Ranger.
Contents
Data Products
Data products from this study are available here.
The SQLite database for this study is available at /home/scec-04/tera3d/CyberShake/sqlite_studies/study_1_0/study_1_0.sqlite . It can be accessed using a SQLite client.
The Hazard Dataset ID for this study is 1. The previously computed sites were done with ERF_ID=34 instead of 35 (the only difference is that 34 is just So Cal, and 35 is statewide), and those have a Hazard Dataset ID of 13.
Computational Status
Study 1.0 began Thursday, April 16, 2009 at 11:40, and ended on Wednesday, June 10, 2009 at 06:03 (56.8 days; 1314.4 hrs)
Sites
A KML file with all the sites is available here: Sites KML
Workflow tools
We used Condor glideins and clustering to reduce the number of submitted jobs.
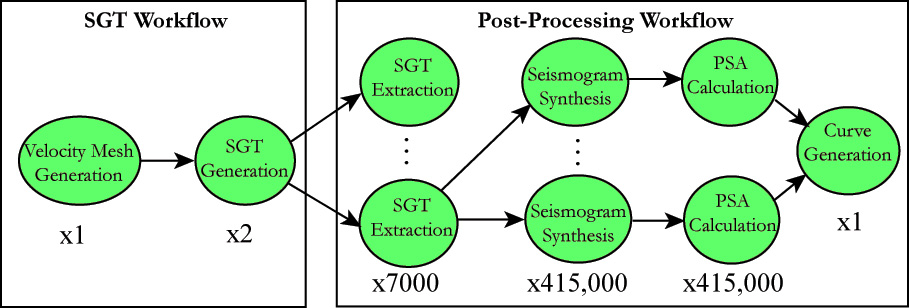
Here's a schematic of the workflow: 
Performance Metrics
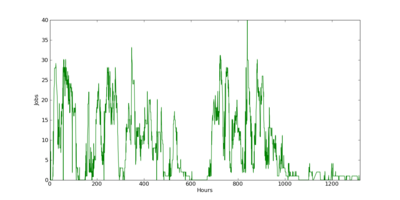
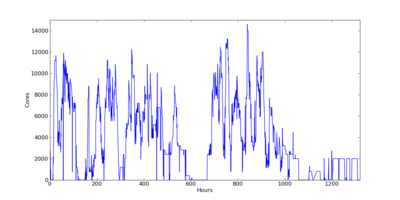
These are plots of the jobs and cores used through June 10:
Application-level metrics
- Hazard curves calculated for 223 sites
- Elapsed time: 54 days, 18 hours (1314.5 hours)
- Downtime (periods when blocked from running for >24 hours): 107.5 hours
- Uptime: 1207 hours
- Site completed every 5.36 hours
- Average post-processing took 11.07 hours
- Averaged 3.8 million tasks/day (44 tasks/sec)
- 16 top-level SGT workflows, with 223 sub workflows
- 223 top-level PP workflows, with about 18063 sub workflows
- Averaged running on 4424 cores (peak 14544, 23% of Ranger)
File metrics
- Temp files: 2 million files, 165.3 TB (velocity meshes, temporary SGTs, extracted SGTs, 760 GB/site)
- Output files: 190 million files, 10.6 TB (SGTs, seismograms, PSA files, 50 GB/site)
- File transfers: 35,000 zipped files, 1.8 TB (156 files, 8 GB/site)
Job metrics
- About 192 million tasks (861,000 tasks/site)
- 3,893,665 Condor jobs
- Average of 9 jobs running on Ranger (peak 40)

