Difference between revisions of "Broadband Data Products"
| (9 intermediate revisions by the same user not shown) | |||
| Line 6: | Line 6: | ||
=== Station Map === | === Station Map === | ||
| + | |||
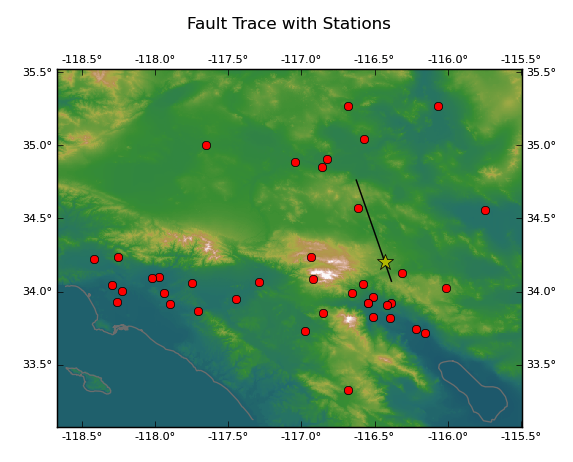
| + | A map showing the fault trace along with the stations for which ground motions are calculated. The yellow star shows the hypocenter location. | ||
[[File:Station_map_landers-cut.png]] | [[File:Station_map_landers-cut.png]] | ||
| Line 15: | Line 17: | ||
=== Velocity and Acceleration Seismograms === | === Velocity and Acceleration Seismograms === | ||
| − | The Broadband Platform will produce both velocity and acceleration seismograms in BBP format. An example is shown below. | + | The Broadband Platform will produce both velocity and acceleration seismograms in BBP format for each station. An example is shown below. |
# Sim NGAH, stat=2001-SCE | # Sim NGAH, stat=2001-SCE | ||
| Line 31: | Line 33: | ||
1.023500e+02 9.947520e-04 2.843150e-06 -1.606000e-03 | 1.023500e+02 9.947520e-04 2.843150e-06 -1.606000e-03 | ||
1.023750e+02 9.947520e-04 2.843150e-06 -1.606000e-03 | 1.023750e+02 9.947520e-04 2.843150e-06 -1.606000e-03 | ||
| + | |||
| + | === RotD50 for Each Station === | ||
| + | |||
| + | A file containing the RotD50 values for 63 periods from 0.01s to 10s. | ||
| + | |||
| + | # Psa5_N Psa5_E RotD50 | ||
| + | # 63 0.0500 | ||
| + | 0.0100 .45593E+00 .42564E+00 .40887E+00 | ||
| + | 0.0110 .45659E+00 .42605E+00 .40943E+00 | ||
| + | 0.0120 .45732E+00 .42650E+00 .41005E+00 | ||
| + | 0.0130 .45812E+00 .42700E+00 .41074E+00 | ||
| + | 0.0150 .45994E+00 .42813E+00 .41192E+00 | ||
| + | ... | ||
| + | ... | ||
| + | 6.0000 .21332E-01 .63760E-02 .15788E-01 | ||
| + | 6.5000 .19264E-01 .61713E-02 .14437E-01 | ||
| + | 7.5000 .15063E-01 .50374E-02 .11496E-01 | ||
| + | 8.5000 .11519E-01 .37930E-02 .88838E-02 | ||
| + | 10.0000 .77129E-02 .28189E-02 .59970E-02 | ||
== Validation Simulations == | == Validation Simulations == | ||
| Line 37: | Line 58: | ||
=== Seismogram Comparison Plots === | === Seismogram Comparison Plots === | ||
| + | |||
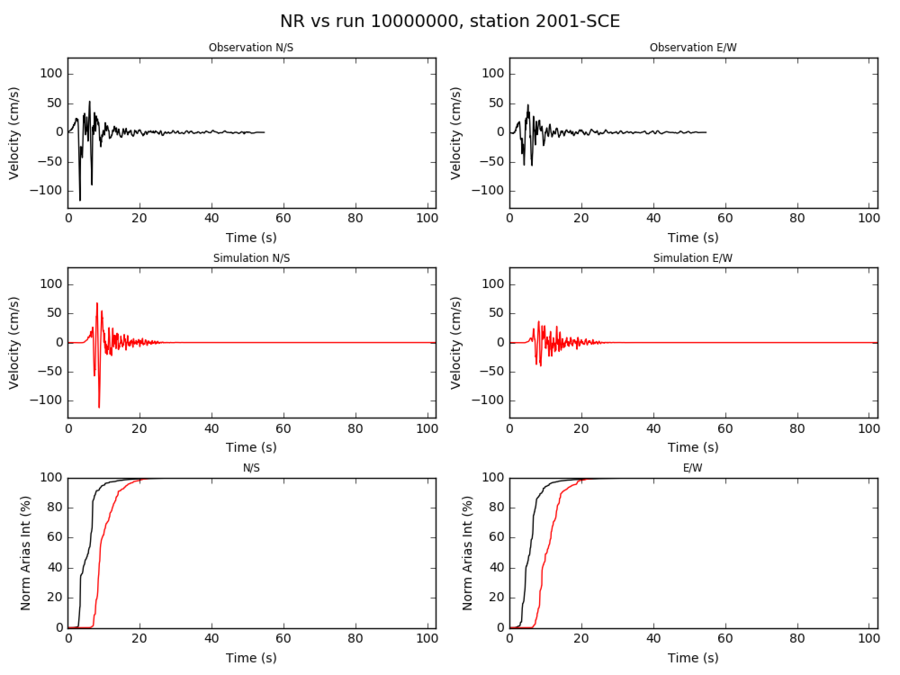
| + | Plots showing calculated data (in red) along with observation data (in black). The two bottom plots show a comparison of the arias duration between simulations and recorded data. | ||
| + | |||
| + | [[File:NR_10000000_2001-SCE_overlay.png|900px]] | ||
=== PSA Comparison Plots === | === PSA Comparison Plots === | ||
| Line 53: | Line 78: | ||
[[File:Gof-dist-log-NR-10000000-rotd50.png|900px]] | [[File:Gof-dist-log-NR-10000000-rotd50.png|900px]] | ||
| + | |||
| + | === Anderson GOF === | ||
| + | |||
| + | The Anderson GOF produces plots showing results from the following 10 metrics: | ||
| + | |||
| + | {| class="wikitable" | ||
| + | |+Anderson GOF Metrics | ||
| + | |- | ||
| + | |Index | ||
| + | |Metric | ||
| + | |- | ||
| + | |C1 | ||
| + | |Arias Duration | ||
| + | |- | ||
| + | |C2 | ||
| + | |Energy Duration | ||
| + | |- | ||
| + | |C3 | ||
| + | |Arias Intensity | ||
| + | |- | ||
| + | |C4 | ||
| + | |Energy Integral | ||
| + | |- | ||
| + | |C5 | ||
| + | |Peak Acceleration | ||
| + | |- | ||
| + | |C6 | ||
| + | |Peak Velocity | ||
| + | |- | ||
| + | |C7 | ||
| + | |Peak Displacement | ||
| + | |- | ||
| + | |C8 | ||
| + | |Response Spectra | ||
| + | |- | ||
| + | |C9 | ||
| + | |Fourier Spectra | ||
| + | |- | ||
| + | |C10 | ||
| + | |Cross Correlation | ||
| + | |} | ||
| + | |||
| + | ==== Per Station Plots ==== | ||
| + | |||
| + | [[File:Gof-NR-10000000-anderson-2004-JGB.png]] | ||
| + | |||
| + | ==== Summary Plots ==== | ||
| + | |||
| + | [[File:Gof-NR-10000000-anderson-summary.png]] | ||
| + | |||
| + | === RotD100/RotD50 Ratio Plot === | ||
| + | |||
| + | [[File:Gof-NR-10000000_r0-120-rd100.png]] | ||
| + | |||
| + | === RZZ2015 Plots === | ||
| + | |||
| + | The Broadband Platform will generate one RZZ2015 plot per component, per station. In these plots, simulated data is presented in red while observed data is shown in black. | ||
| + | |||
| + | [[File:10000000.rzz2015.2001-SCE.001.png|900px]] | ||
| + | |||
| + | == References == | ||
| + | |||
| + | # Anderson, J. G (2004) Quantitative Measure of the Goodness-of-Fit of Synthetic Seismograms, 13th World Conference on Earthquake Engineering, Vancouver, Canada, August 1-6, 2004, Paper No. 243. | ||
Latest revision as of 20:19, 24 May 2016
This page contains a basic description of some of the data products produced by the Broadband Platform while running a simulation. All the data products described below will be in the outdata directory after a simulation completes.
Scenario Simulations
Scenario simulations are hypothetical simulations, what-if scenarios. Users provide a source description file describing the rupture and a station list file containing stations for which ground motions will be calculated.
Station Map
A map showing the fault trace along with the stations for which ground motions are calculated. The yellow star shows the hypocenter location.
Rupture Model
Velocity and Acceleration Seismograms
The Broadband Platform will produce both velocity and acceleration seismograms in BBP format for each station. An example is shown below.
# Sim NGAH, stat=2001-SCE
#    time(sec)      N-S(cm/s)      E-W(cm/s)      U-D(cm/s)
0.000000e+00    -4.532020e-05   2.096500e-05    1.781130e-04
2.500000e-02    -8.685250e-05   4.299330e-05    3.587300e-04
5.000000e-02    -1.234730e-04   6.599000e-05    5.400660e-04
7.500000e-02    -1.540990e-04   8.986040e-05    7.203370e-04
1.000000e-01    -1.777220e-04   1.145130e-04    8.978090e-04
...
...
1.022750e+02	9.947510e-04	2.843360e-06	-1.606000e-03
1.023000e+02	9.947510e-04	2.843220e-06	-1.606000e-03
1.023250e+02	9.947520e-04	2.843170e-06	-1.606000e-03
1.023500e+02	9.947520e-04	2.843150e-06	-1.606000e-03
1.023750e+02	9.947520e-04	2.843150e-06	-1.606000e-03
RotD50 for Each Station
A file containing the RotD50 values for 63 periods from 0.01s to 10s.
#  Psa5_N Psa5_E RotD50
#     63    0.0500
   0.0100 .45593E+00 .42564E+00 .40887E+00
   0.0110 .45659E+00 .42605E+00 .40943E+00
   0.0120 .45732E+00 .42650E+00 .41005E+00
   0.0130 .45812E+00 .42700E+00 .41074E+00
   0.0150 .45994E+00 .42813E+00 .41192E+00
...
...
   6.0000 .21332E-01 .63760E-02 .15788E-01
   6.5000 .19264E-01 .61713E-02 .14437E-01
   7.5000 .15063E-01 .50374E-02 .11496E-01
   8.5000 .11519E-01 .37930E-02 .88838E-02
  10.0000 .77129E-02 .28189E-02 .59970E-02
Validation Simulations
Validation simulations can be used to calculate seismograms from historical events and compare these again recorded ground motion data, allowing scientists to develop and validate their methods. For this reason, only locations where recorded ground motions are available can be used. In addition to all data products described above for scenario simulations, the following data products will also be calculated:
Seismogram Comparison Plots
Plots showing calculated data (in red) along with observation data (in black). The two bottom plots show a comparison of the arias duration between simulations and recorded data.
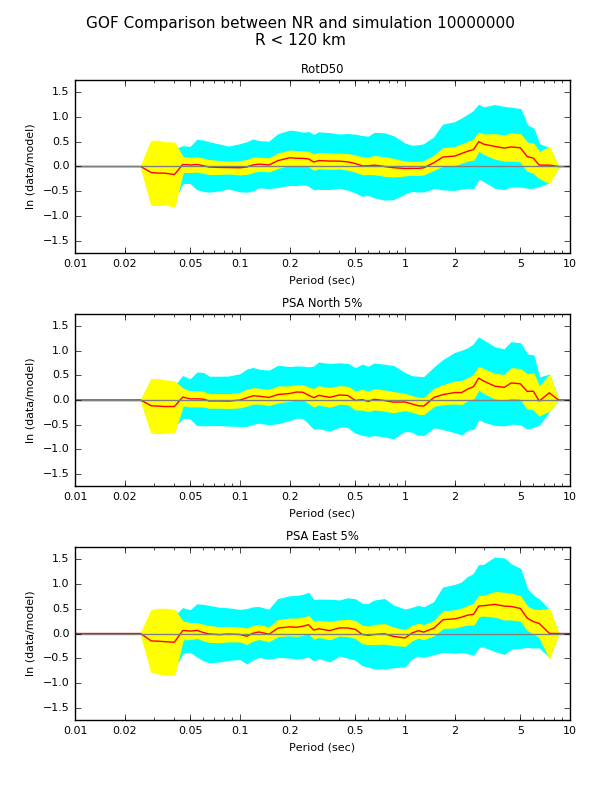
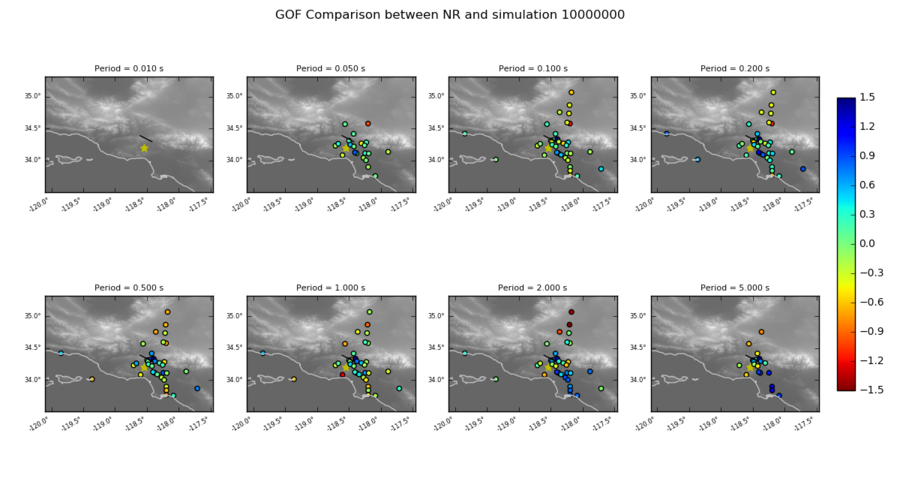
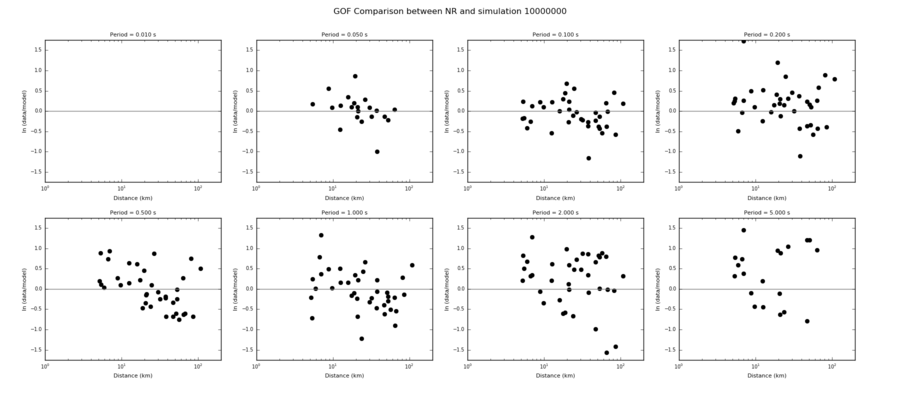
PSA Comparison Plots
Goodness-of-Fit Plot
Map Goodness-of-Fit Plot
Distance Goodness-of-Fit Plot
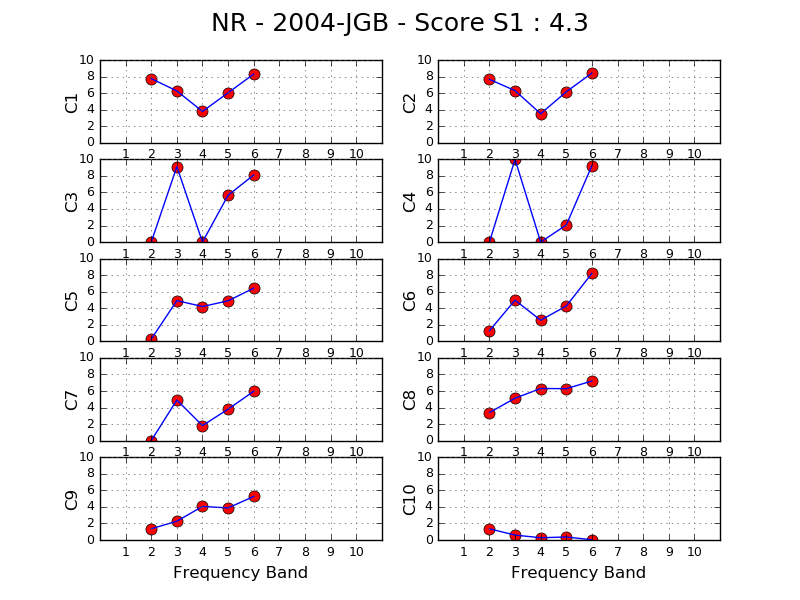
Anderson GOF
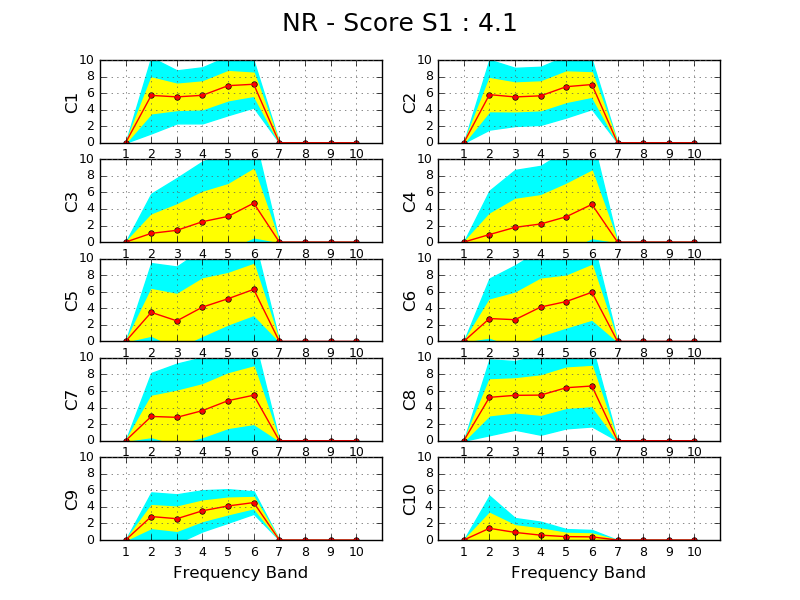
The Anderson GOF produces plots showing results from the following 10 metrics:
| Index | Metric |
| C1 | Arias Duration |
| C2 | Energy Duration |
| C3 | Arias Intensity |
| C4 | Energy Integral |
| C5 | Peak Acceleration |
| C6 | Peak Velocity |
| C7 | Peak Displacement |
| C8 | Response Spectra |
| C9 | Fourier Spectra |
| C10 | Cross Correlation |
Per Station Plots
Summary Plots
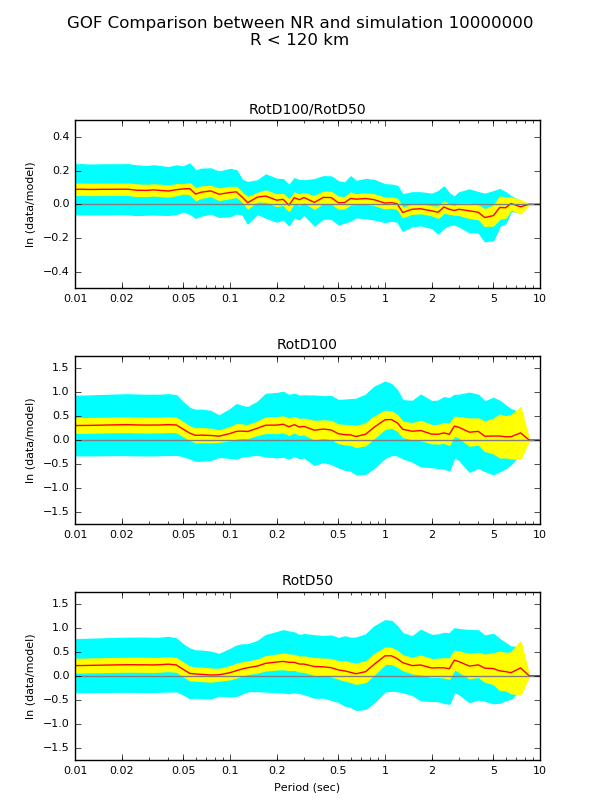
RotD100/RotD50 Ratio Plot
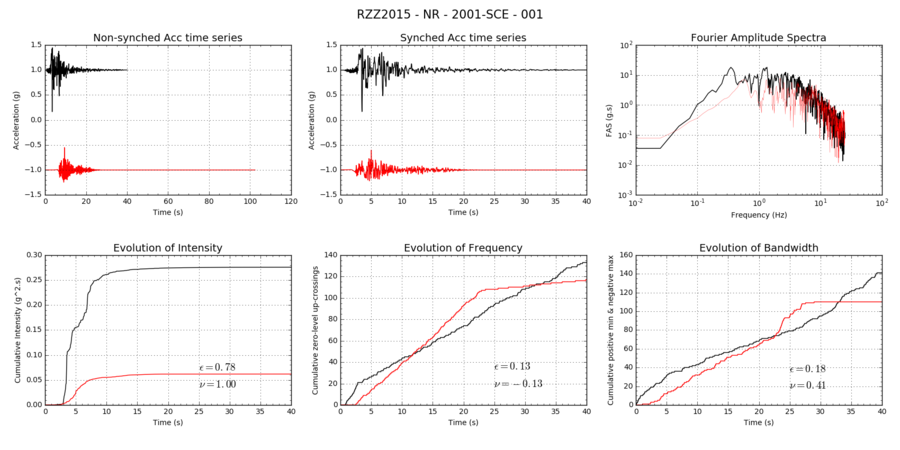
RZZ2015 Plots
The Broadband Platform will generate one RZZ2015 plot per component, per station. In these plots, simulated data is presented in red while observed data is shown in black.
References
- Anderson, J. G (2004) Quantitative Measure of the Goodness-of-Fit of Synthetic Seismograms, 13th World Conference on Earthquake Engineering, Vancouver, Canada, August 1-6, 2004, Paper No. 243.
