Difference between revisions of "CCA N SAF Tests"
(→s1207) |
|||
| (7 intermediate revisions by 2 users not shown) | |||
| Line 5: | Line 5: | ||
== Parkfield == | == Parkfield == | ||
| − | The CyberShake Parkfield site is ~138 km from the N. SAF in UCERF2 | + | The CyberShake Parkfield site is ~138 km from the N. SAF in UCERF2 with Z2.5=3.28km in the CCA 3-D model. These were done with the wrong impulse. |
{| | {| | ||
| Line 15: | Line 15: | ||
| [[File:PARK_run4675_5s_RotD50.png|thumb|350px|w/ N.SAF (black) vs w/o (blue)]] | | [[File:PARK_run4675_5s_RotD50.png|thumb|350px|w/ N.SAF (black) vs w/o (blue)]] | ||
| [[File:PARK_run4675_10s_RotD50.png|thumb|350px|w/ N.SAF (black) vs w/o (blue)]] | | [[File:PARK_run4675_10s_RotD50.png|thumb|350px|w/ N.SAF (black) vs w/o (blue)]] | ||
| + | |- | ||
| + | ! CCA 3-D Model | ||
| + | | [[File:PARK_run4715_2s_RotD50.png|thumb|350px|w/ N.SAF (black) vs w/o (blue)]] | ||
| + | | [[File:PARK_run4715_3s_RotD50.png|thumb|350px|w/ N.SAF (black) vs w/o (blue)]] | ||
| + | | [[File:PARK_run4715_5s_RotD50.png|thumb|350px|w/ N.SAF (black) vs w/o (blue)]] | ||
| + | | [[File:PARK_run4715_10s_RotD50.png|thumb|350px|w/ N.SAF (black) vs w/o (blue)]] | ||
| + | |} | ||
| + | |||
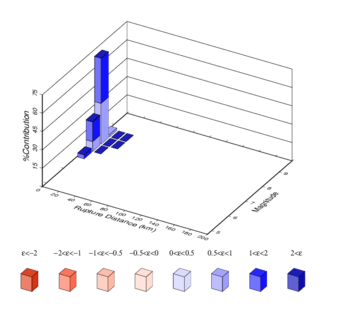
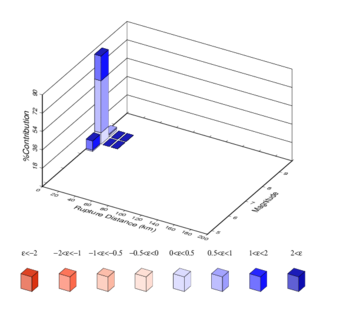
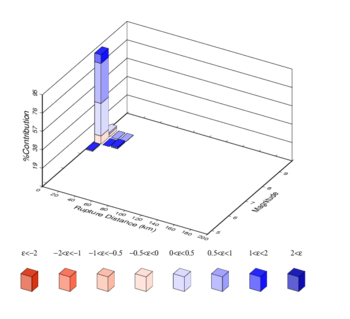
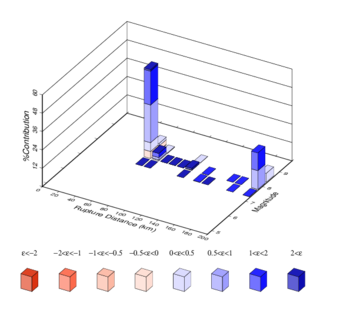
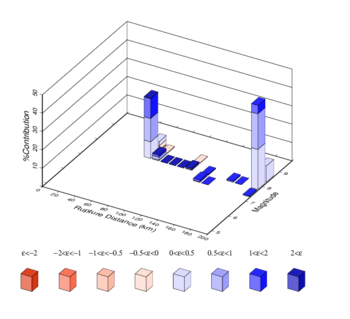
| + | Here are disaggregation plots at 3, 5, and 10 sec for the CCA 3-D model. | ||
| + | |||
| + | {| | ||
| + | | [[File:PARK_ERF36_Run4715_DisaggPOE_4.0E-4_SA_3sec.png|thumb|350px|3 sec]] | ||
| + | | [[File:PARK_ERF36_Run4715_DisaggPOE_4.0E-4_SA_5sec.png|thumb|350px|5 sec]] | ||
| + | | [[File:PARK_ERF36_Run4715_DisaggPOE_4.0E-4_SA_10sec.png|thumb|350px|10 sec]] | ||
|} | |} | ||
== s1207 == | == s1207 == | ||
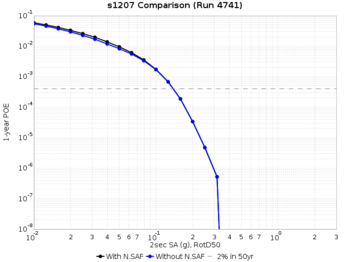
| − | The CyberShake s1207 site is ~198 km from the N. SAF in UCERF2 | + | The CyberShake s1207 site is ~198 km from the N. SAF in UCERF2 with Z2.5=8.34km in the CCA 3-D model. This includes the correct impulse, and the USGS Bay Area model in northern CA. |
| + | |||
| + | {| | ||
| + | ! Velocity Model !! 2 sec !! 3 sec !! 5 sec !! 10 sec | ||
| + | |- | ||
| + | ! CCA 3-D Model | ||
| + | | [[File:S1207_run4741_2s_RotD50.png|thumb|350px|w/ N.SAF (black) vs w/o (blue)]] | ||
| + | | [[File:S1207_run4741_3s_RotD50.png|thumb|350px|w/ N.SAF (black) vs w/o (blue)]] | ||
| + | | [[File:S1207_run4741_5s_RotD50.png|thumb|350px|w/ N.SAF (black) vs w/o (blue)]] | ||
| + | | [[File:S1207_run4741_10s_RotD50.png|thumb|350px|w/ N.SAF (black) vs w/o (blue)]] | ||
| + | |} | ||
| + | |||
| + | Here are disaggregation plots at 3, 5, and 10 sec for the CCA 3-D model. | ||
| + | |||
| + | {| | ||
| + | | [[File:S1207_ERF36_Run4741_DisaggPOE_4.0E-4_SA_3sec.png|thumb|350px|3 sec]] | ||
| + | | [[File:S1207_ERF36_Run4741_DisaggPOE_4.0E-4_SA_5sec.png|thumb|350px|5 sec]] | ||
| + | | [[File:S1207_ERF36_Run4741_DisaggPOE_4.0E-4_SA_10sec.png|thumb|350px|10 sec]] | ||
| + | |} | ||
| + | |||
| + | == s1252 == | ||
| + | |||
| + | The CyberShake s1252 site is ~193 km from the N. SAF in UCERF2 with Z2.5=6.4km in the CCA 3-D model | ||
| + | |||
| + | {| | ||
| + | ! Velocity Model !! 2 sec !! 3 sec !! 5 sec !! 10 sec | ||
| + | |- | ||
| + | ! CCA 3-D Model | ||
| + | | [[File:S1252_run4719_2s_RotD50.png|thumb|350px|w/ N.SAF (black) vs w/o (blue)]] | ||
| + | | [[File:S1252_run4719_3s_RotD50.png|thumb|350px|w/ N.SAF (black) vs w/o (blue)]] | ||
| + | | [[File:S1252_run4719_5s_RotD50.png|thumb|350px|w/ N.SAF (black) vs w/o (blue)]] | ||
| + | | [[File:S1252_run4719_10s_RotD50.png|thumb|350px|w/ N.SAF (black) vs w/o (blue)]] | ||
| + | |- | ||
| + | ! S4.26 no GTL | ||
| + | | [[File:S1252_run4723_2s_RotD50.png|thumb|350px|w/ N.SAF (black) vs w/o (blue)]] | ||
| + | | [[File:S1252_run4723_3s_RotD50.png|thumb|350px|w/ N.SAF (black) vs w/o (blue)]] | ||
| + | | [[File:S1252_run4723_5s_RotD50.png|thumb|350px|w/ N.SAF (black) vs w/o (blue)]] | ||
| + | | [[File:S1252_run4723_10s_RotD50.png|thumb|350px|w/ N.SAF (black) vs w/o (blue)]] | ||
| + | |} | ||
| + | |||
| + | == s1250 == | ||
| + | |||
| + | The CyberShake s1252 site is ~192 km from the N. SAF in UCERF2 with Z2.5=4.24km in the CCA 3-D model | ||
{| | {| | ||
| Line 25: | Line 81: | ||
|- | |- | ||
! CCA 3-D Model | ! CCA 3-D Model | ||
| − | | [[File: | + | | [[File:S1250_run4725_2s_RotD50.png|thumb|350px|w/ N.SAF (black) vs w/o (blue)]] |
| − | | [[File: | + | | [[File:S1250_run4725_3s_RotD50.png|thumb|350px|w/ N.SAF (black) vs w/o (blue)]] |
| − | | [[File: | + | | [[File:S1250_run4725_5s_RotD50.png|thumb|350px|w/ N.SAF (black) vs w/o (blue)]] |
| − | | [[File: | + | | [[File:S1250_run4725_10s_RotD50.png|thumb|350px|w/ N.SAF (black) vs w/o (blue)]] |
| + | |- | ||
| + | ! S4.26 no GTL | ||
| + | | [[File:S1250_run4724_2s_RotD50.png|thumb|350px|w/ N.SAF (black) vs w/o (blue)]] | ||
| + | | [[File:S1250_run4724_3s_RotD50.png|thumb|350px|w/ N.SAF (black) vs w/o (blue)]] | ||
| + | | [[File:S1250_run4724_5s_RotD50.png|thumb|350px|w/ N.SAF (black) vs w/o (blue)]] | ||
| + | | [[File:S1250_run4724_10s_RotD50.png|thumb|350px|w/ N.SAF (black) vs w/o (blue)]] | ||
|} | |} | ||
Latest revision as of 02:55, 16 December 2016
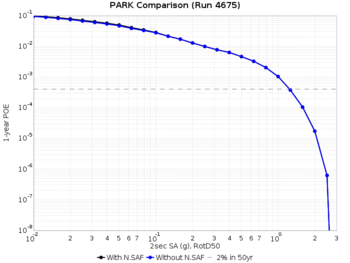
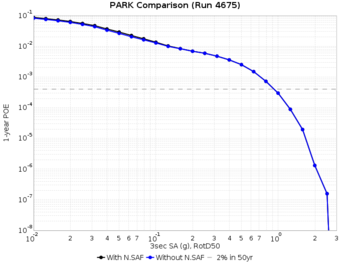
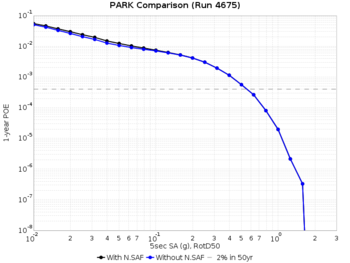
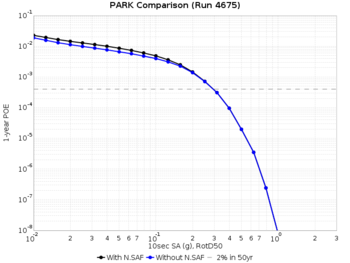
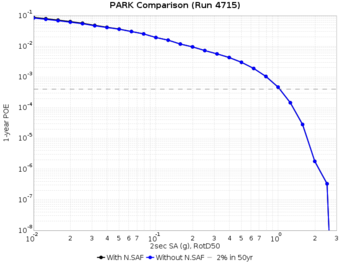
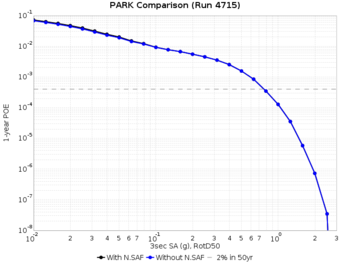
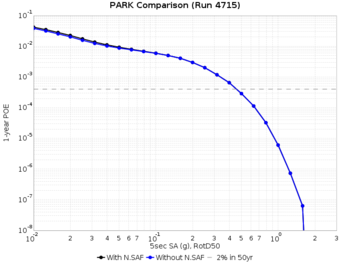
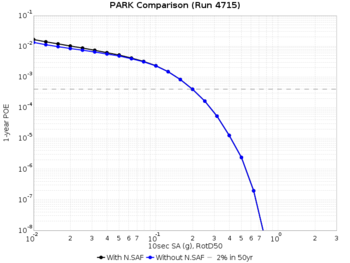
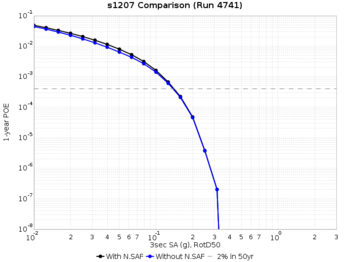
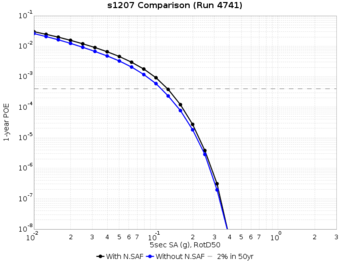
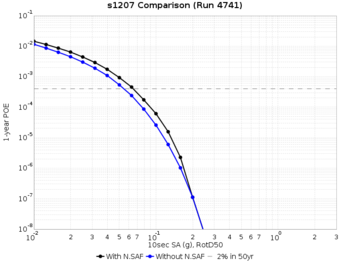
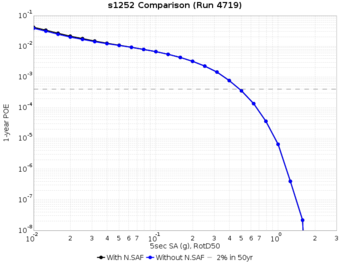
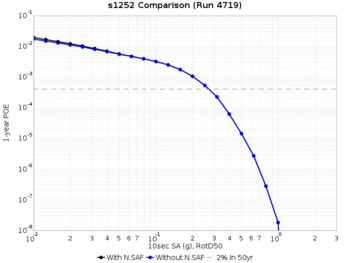
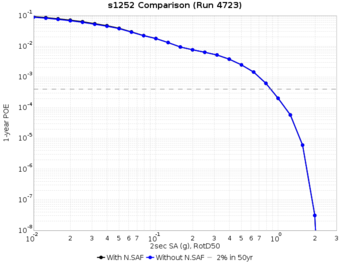
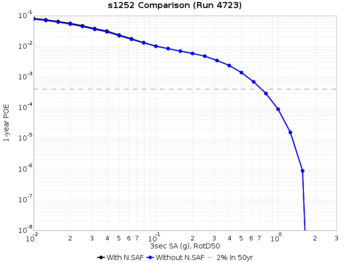
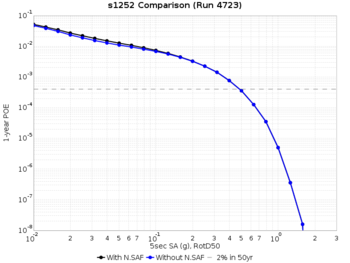
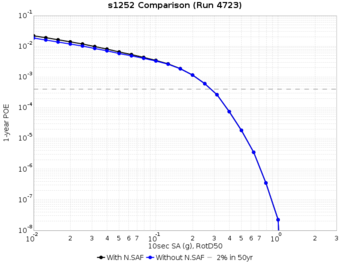
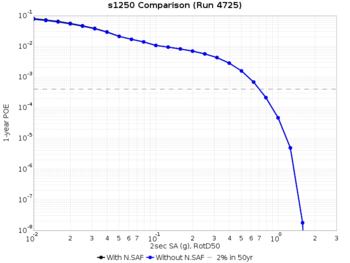
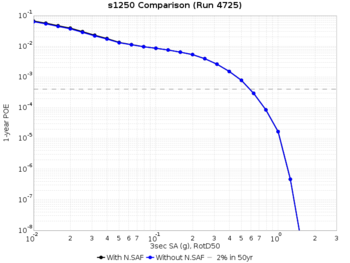
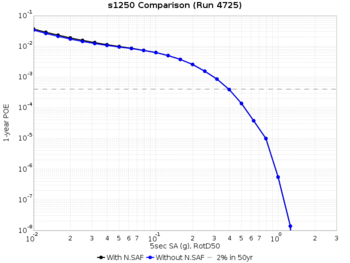
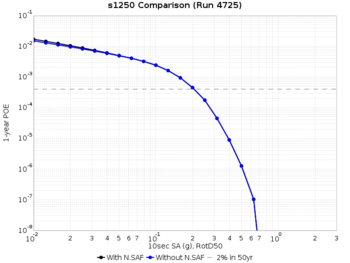
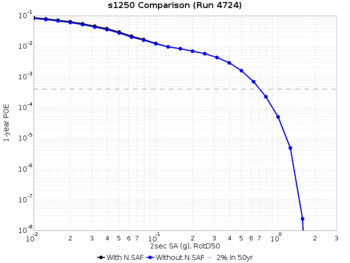
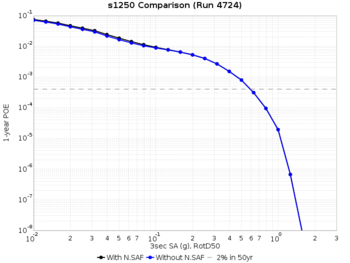
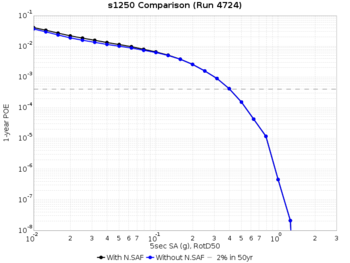
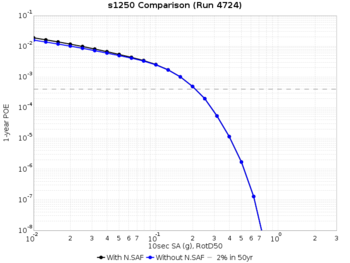
Sites in the Northwest part of the CCA model region are within 200km of UCERF2 N. San Andreas events, while those in the Southeast are further away. Therefore, only some sites in the CCA model include N. SAF events with the default 200km cutoff distance. We wish to explore the affect of this cutoff distance by computing hazard curves at sites which are just under 200 KM from the N. SAF both with and without those events.
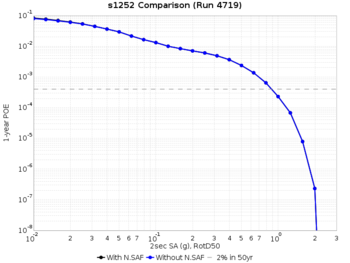
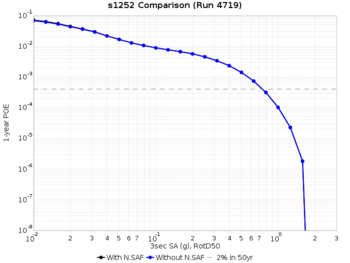
The gray dashed line in all plots highlights the 2% in 50 year level.
Contents
Parkfield
The CyberShake Parkfield site is ~138 km from the N. SAF in UCERF2 with Z2.5=3.28km in the CCA 3-D model. These were done with the wrong impulse.
| Velocity Model | 2 sec | 3 sec | 5 sec | 10 sec |
|---|---|---|---|---|
| CCA 1-D Model | ||||
| CCA 3-D Model |
Here are disaggregation plots at 3, 5, and 10 sec for the CCA 3-D model.
s1207
The CyberShake s1207 site is ~198 km from the N. SAF in UCERF2 with Z2.5=8.34km in the CCA 3-D model. This includes the correct impulse, and the USGS Bay Area model in northern CA.
| Velocity Model | 2 sec | 3 sec | 5 sec | 10 sec |
|---|---|---|---|---|
| CCA 3-D Model |
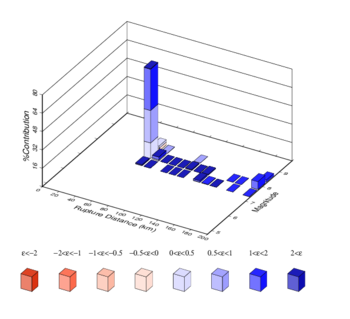
Here are disaggregation plots at 3, 5, and 10 sec for the CCA 3-D model.
s1252
The CyberShake s1252 site is ~193 km from the N. SAF in UCERF2 with Z2.5=6.4km in the CCA 3-D model
| Velocity Model | 2 sec | 3 sec | 5 sec | 10 sec |
|---|---|---|---|---|
| CCA 3-D Model | ||||
| S4.26 no GTL |
s1250
The CyberShake s1252 site is ~192 km from the N. SAF in UCERF2 with Z2.5=4.24km in the CCA 3-D model
| Velocity Model | 2 sec | 3 sec | 5 sec | 10 sec |
|---|---|---|---|---|
| CCA 3-D Model | ||||
| S4.26 no GTL |
