Difference between revisions of "UCVMC CS17.3-H plots"
From SCECpedia
Jump to navigationJump to search (→Plots) |
(→Plots) |
||
| Line 31: | Line 31: | ||
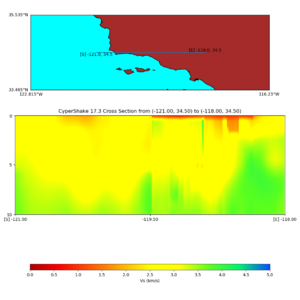
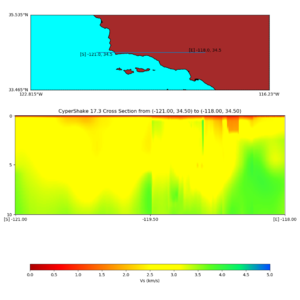
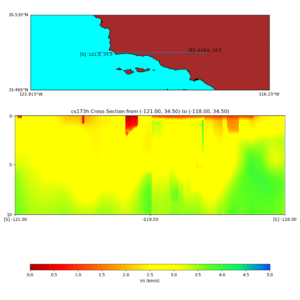
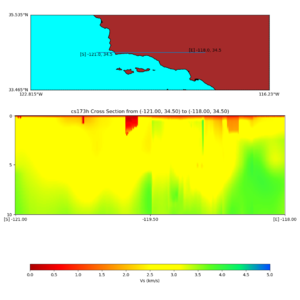
| [[File:cs173h_santaMaria_x2_a.png|thumb|300px|CS17.3-H, no GTL]] | | [[File:cs173h_santaMaria_x2_a.png|thumb|300px|CS17.3-H, no GTL]] | ||
| [[File:cs173h_GTL_santaMaria_x2_a.png|thumb|300px|CS17.3-H, with GTL]] | | [[File:cs173h_GTL_santaMaria_x2_a.png|thumb|300px|CS17.3-H, with GTL]] | ||
| + | |} | ||
<pre> | <pre> | ||
| Line 36: | Line 37: | ||
</pre> | </pre> | ||
| − | |||
Horizontal cross-section | Horizontal cross-section | ||
Latest revision as of 07:45, 13 June 2018
Plots
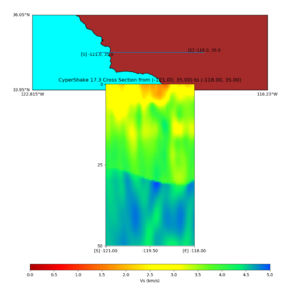
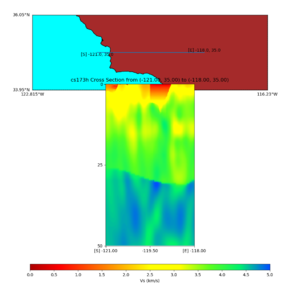
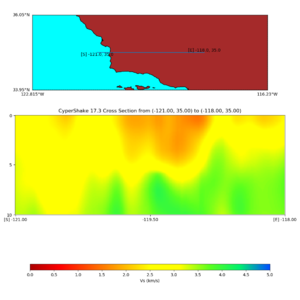
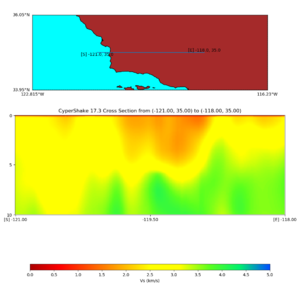
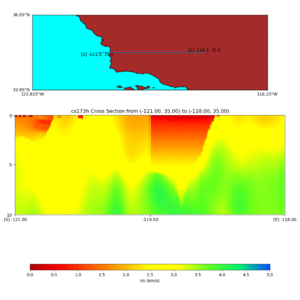
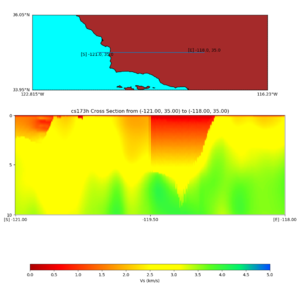
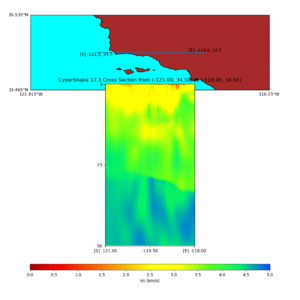
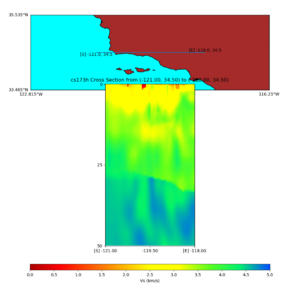
Cutting through Santa Maria
at lat = 35
./plot_cross_section.py -b 35,-121 -u 35,-118 -h 1000 -v 100 -d vs -c cs173 -a s -s 0 -e 10000 -o cs173_GTL_santaMaria_x1_a.png
at lat = 34.5
./plot_cross_section.py -b 34.5,-121 -u 34.5,-118 -h 1000 -v 100 -d vs -c cs173 -a s -s 0 -e 10000 -o cs173_GTL_santaMaria_x2_a.png
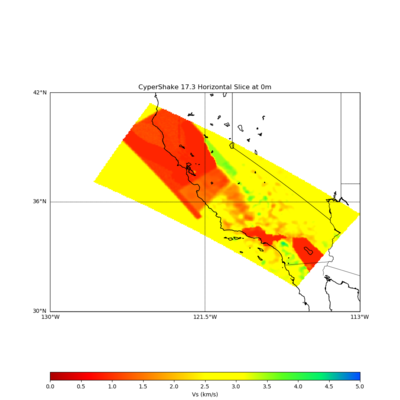
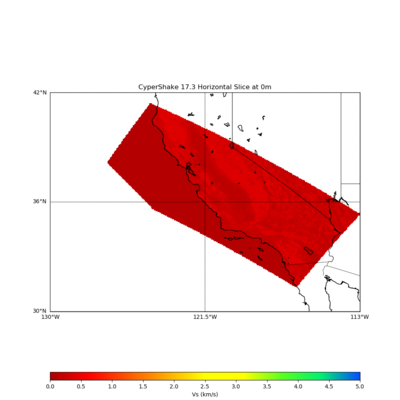
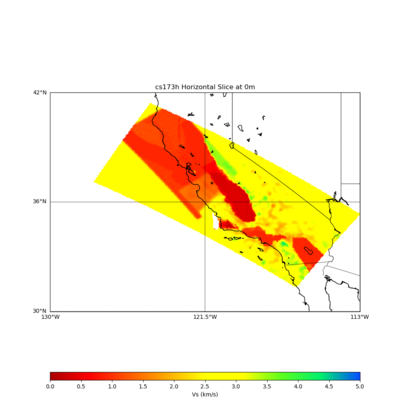
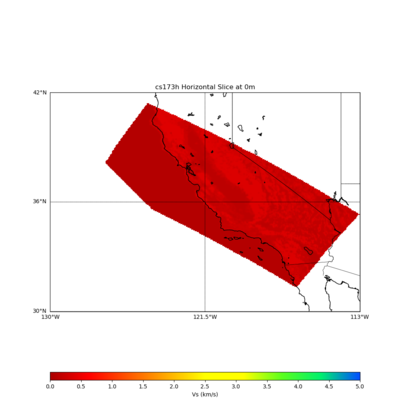
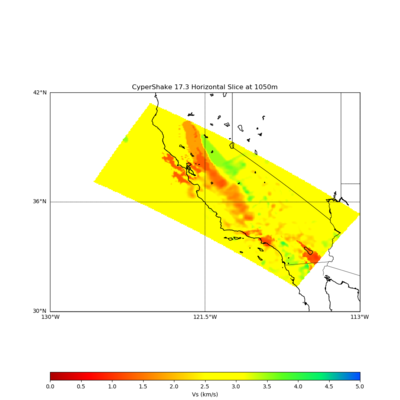
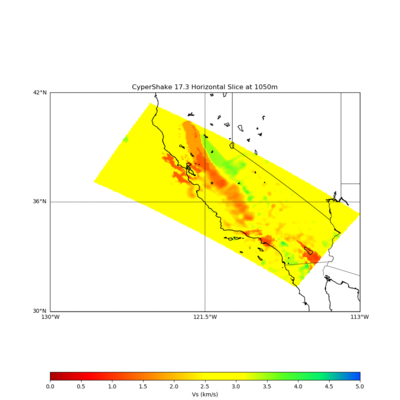
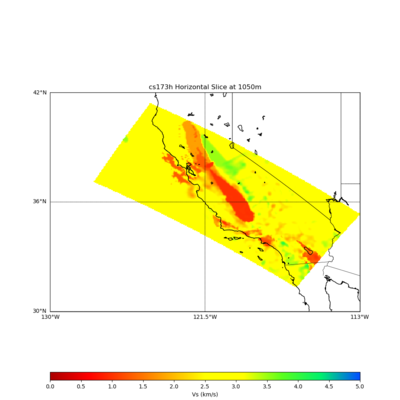
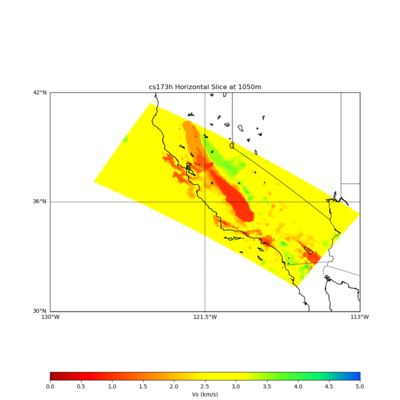
Horizontal cross-section
at depth=0km
./plot_horizontal_slice.py -b 30,-130 -u 42,-113 -d vs -c cs173 -a s -s 0.05 -e 0 -o cs173_GTL_hort_0.png
at depth=1.05km
./plot_horizontal_slice.py -b 30,-130 -u 42,-113 -d vs -c cs173 -a s -s 0.05 -e 1050 -o cs173_GTL_hort_1050.png
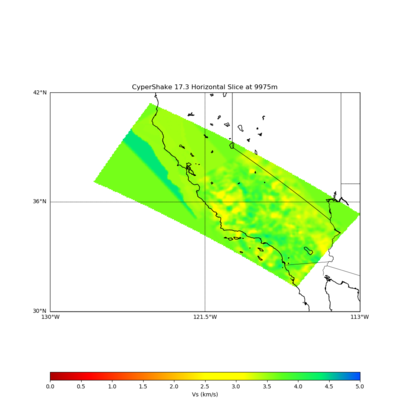
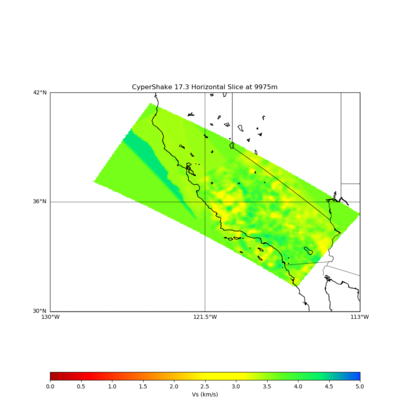
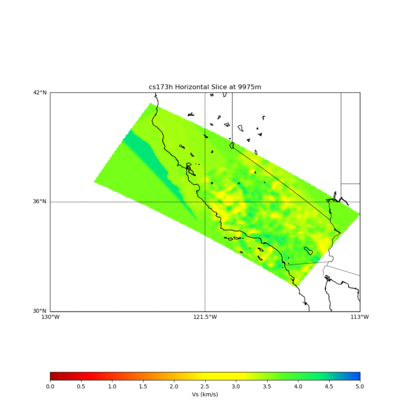
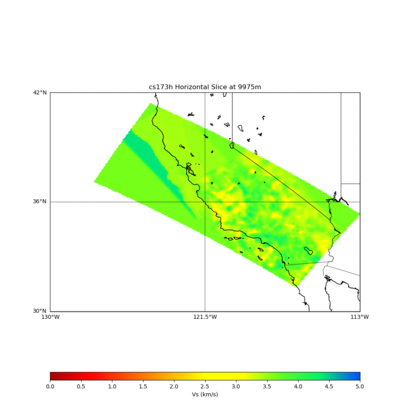
at depth=9.975km
./plot_horizontal_slice.py -b 30,-130 -u 42,-113 -d vs -c cs173 -a s -s 0.05 -e 9975 -o cs173_GTL_hort_9975.png
Depth profile
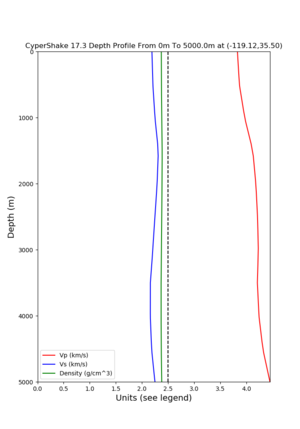
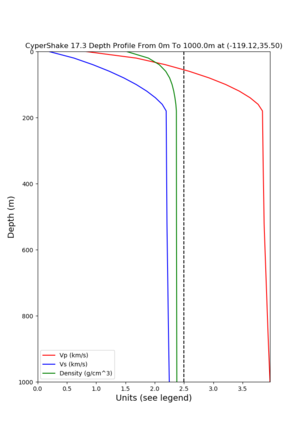
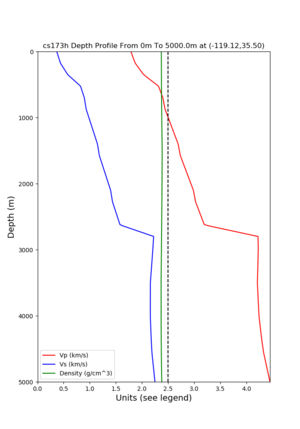
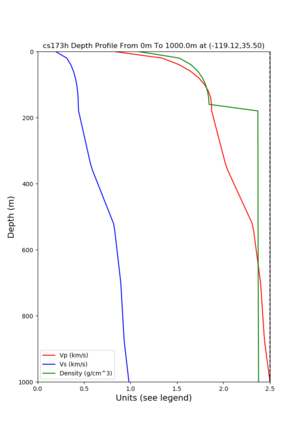
at 35.5,-119.125
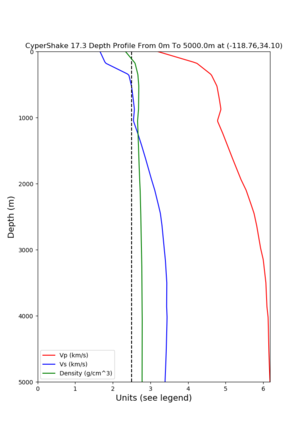
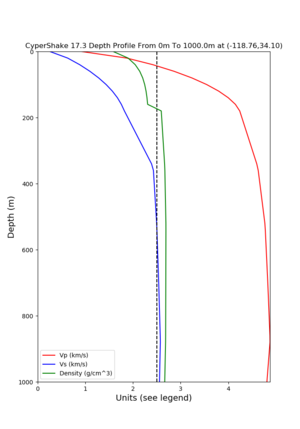
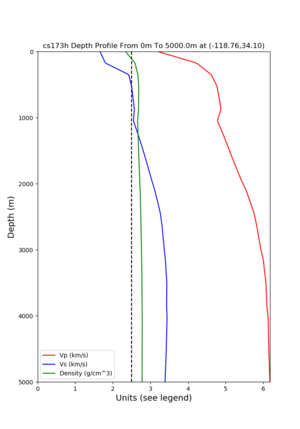
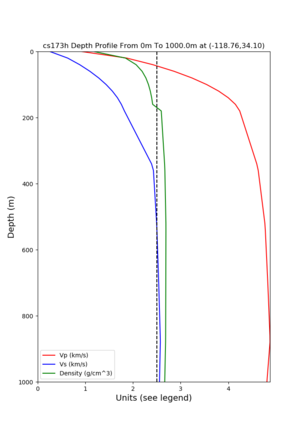
at 34.09986,-118.75974
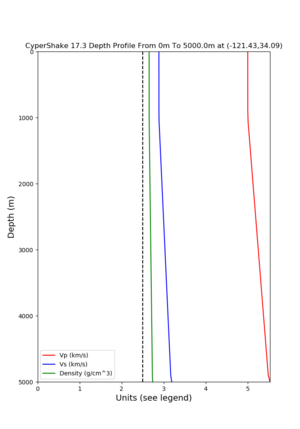
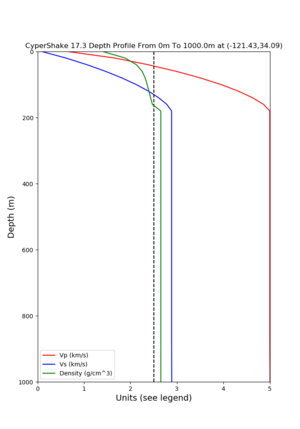
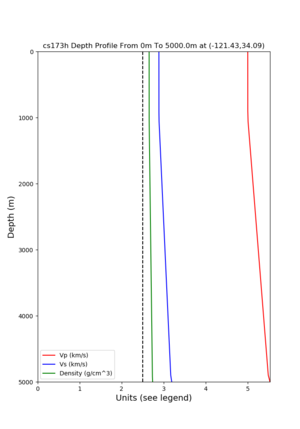
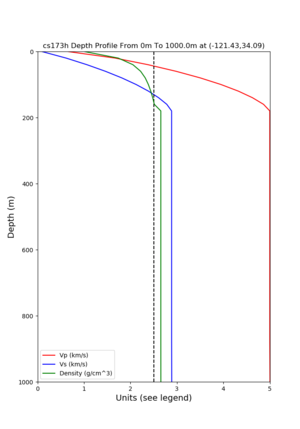
at 34.09259,-121.43373
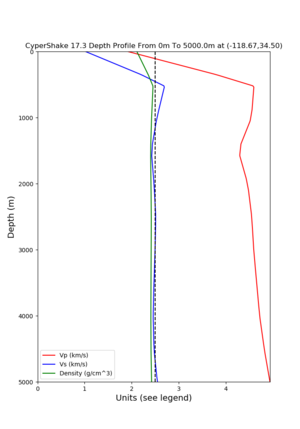
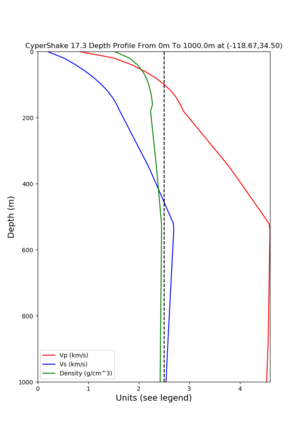
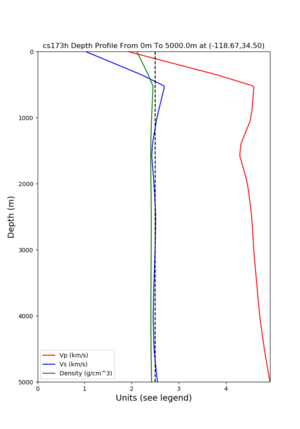
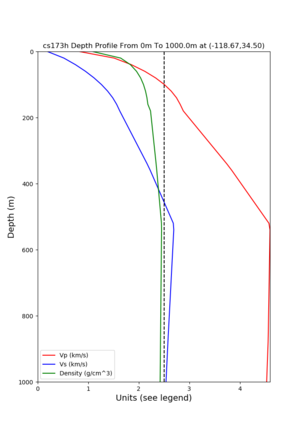
at 34.5,-118.67
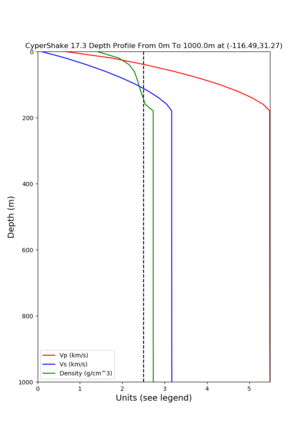
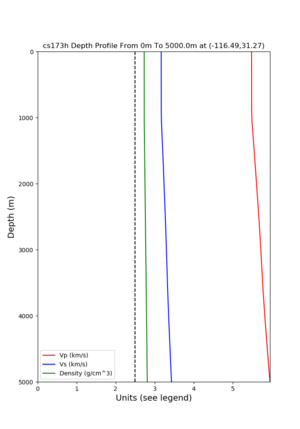
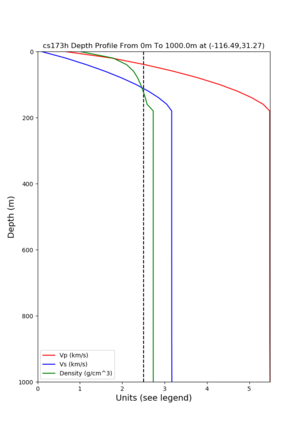
at 31.266430,-116.485620
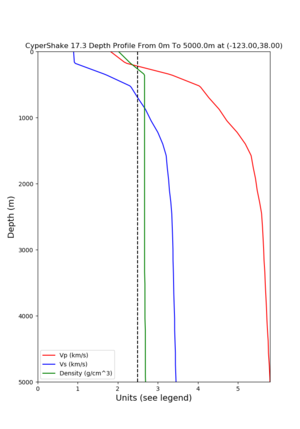
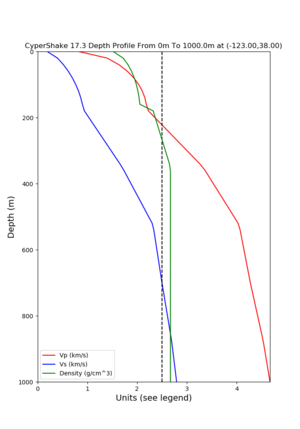
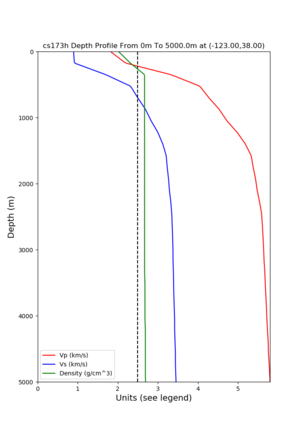
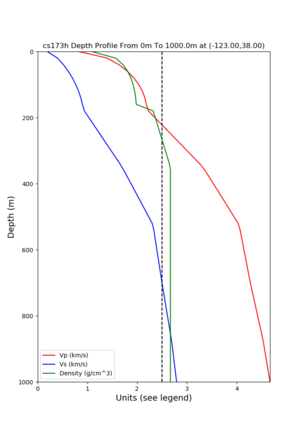
at 38,-123
Parallel to Y-axis,
X=1000
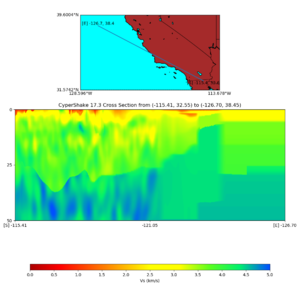
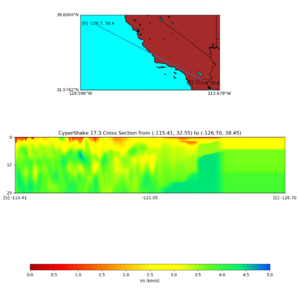
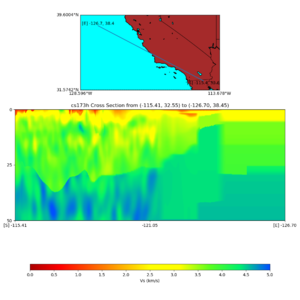
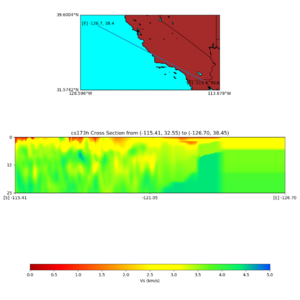
./plot_cross_section.py -b 32.550700,-115.409380 -u 38.446980,-126.695380 -h 1000 -v 100 -d vs -c cs173 -a s -s 0 -e 25000 -o cs173_GTL_cross_x1.png
X=2000
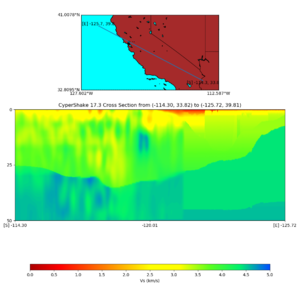
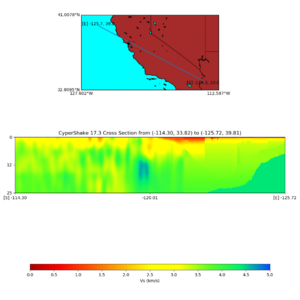
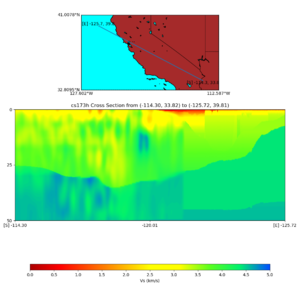
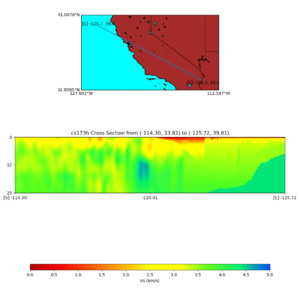
./plot_cross_section.py -b 33.824270,-114.301790 -u 39.813370,-125.716460 -h 1000 -v 100 -d vs -c cs173 -a s -s 0 -e 25000 -o cs173_GTL_cross_x2.png
Parallel to X-axis,
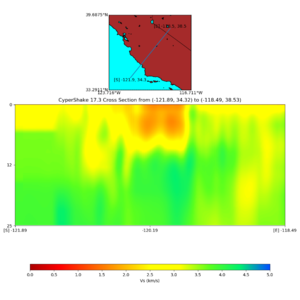
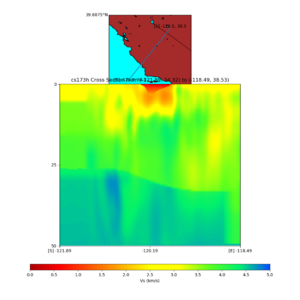
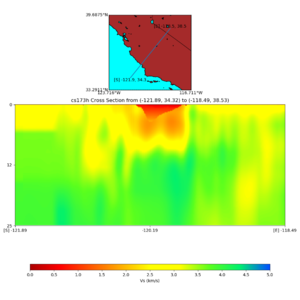
Y=3480
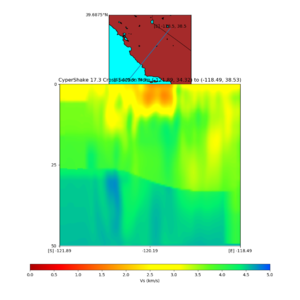
./plot_cross_section.py -b 34.320700,-121.888010 -u 38.531550,-118.487980 -h 1000 -v 100 -d vs -c cs173 -a s -s 0 -e 25000 -o cs173_GTL_cross_y2.png
Others
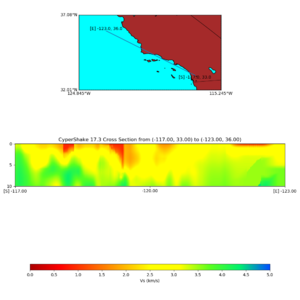
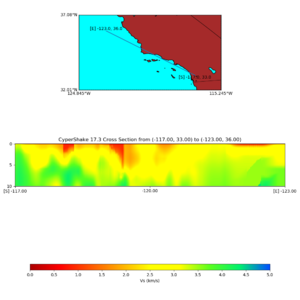
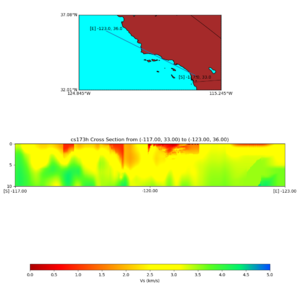
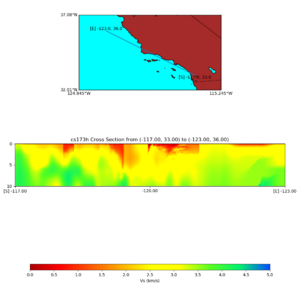
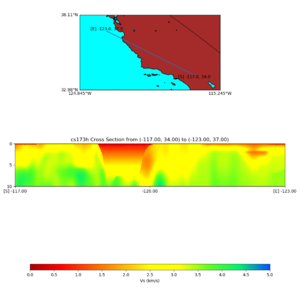
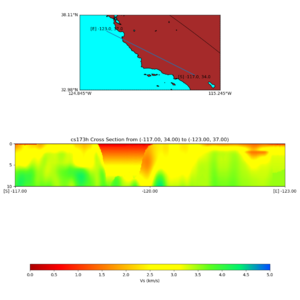
./plot_cross_section.py -b 33,-117 -u 36,-123 -h 1000 -v 100 -d vs -c cs173h -a s -s 0 -e 10000 -o cs173h_GTL_vs_cross_s1.png
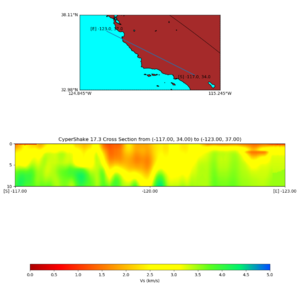
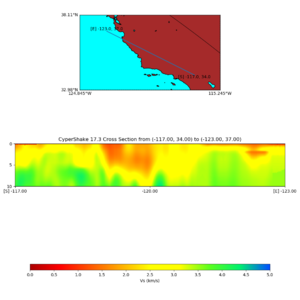
./plot_cross_section.py -b 34,-117 -u 37,-123 -h 1000 -v 100 -d vs -c cs173 -a s -s 0 -e 10000 -o cs173_GTL_cross_s2.png
