Difference between revisions of "UCVM elevation vs depth, model boundary"
From SCECpedia
Jump to navigationJump to search| (26 intermediate revisions by the same user not shown) | |||
| Line 34: | Line 34: | ||
== How deep are the Models == | == How deep are the Models == | ||
| + | |||
| + | At -119.03,35.38 | ||
| + | |||
{| | {| | ||
| [[File:cvmh_bakersfiled_x_depth.png|thumb|300px|CVM-H v15.1(cvmh)]] | | [[File:cvmh_bakersfiled_x_depth.png|thumb|300px|CVM-H v15.1(cvmh)]] | ||
| Line 45: | Line 48: | ||
|} | |} | ||
{| | {| | ||
| − | + | | [[File:1d_bakersfield_x_depth.png|thumb|300px|Southern California 1D(1d)]] | |
| − | | [[File:1d_bakersfield_x_depth.png|thumb|300px| | ||
| [[File:bbp1d_bakersfield_x_depth.png|thumb|300px|Northridge Region 1D(bbp1d)]] | | [[File:bbp1d_bakersfield_x_depth.png|thumb|300px|Northridge Region 1D(bbp1d)]] | ||
|} | |} | ||
| + | At -123,37,0.0,1000000.0 | ||
| + | |||
| + | {| | ||
| + | | [[File:cencal_other_x_depth.png|thumb|300px|USGS Bay Area Velocity Model 0.8.3(cencal)]] | ||
| + | |} | ||
| + | |||
| + | [http://hypocenter.usc.edu/research/ucvmc_result/TAPE_depth.tar.gz raw data] | ||
| + | |||
| + | == Extending Model boundary with tiling == | ||
| + | |||
| + | {| | ||
| + | | [[File:cvmh_bakersfield_1d_tiling_depth.png|thumb|300px|CVMH with 1D tiling]] | ||
| + | | [[File:cca_bakersfield_1d_tiling_depth.png|thumb|300px|CCA06 with 1D tiling]] | ||
| + | | [[File:cvms5_bakersfield_1d_tiling_depth.png|thumb|300px|CVM-S4.26 with 1D tiling]] | ||
| + | |} | ||
| + | {| | ||
| + | | [[File:cvmh_bakersfield_bbp1d_tiling_depth.png|thumb|300px|CVMH with BBP1D tiling]] | ||
| + | | [[File:cca_bakersfield_bbp1d_tiling_depth.png|thumb|300px|CCA06 with BBP1D tiling]] | ||
| + | | [[File:cvms5_bakersfield_bbp1d_tiling_depth.png|thumb|300px|CVM-S4.26 with BBP1D tiling]] | ||
| + | |} | ||
== Query by elevation vs by depth == | == Query by elevation vs by depth == | ||
| + | {| | ||
| + | | [[File:sketch.png|thumb|300px|]] | ||
| + | |} | ||
| + | |||
| + | |||
| + | Target point: near Bakersfield (-119.0300,35.3800, elevation is at 112.589) | ||
| + | |||
| + | A: elevation(112.589) depth(0) | ||
| + | B: elevation(0) depth(112.589) | ||
| + | C: elevation(-300) depth(412.589) | ||
| + | D: elevation(-1000) depth(1112.589) | ||
| + | E: elevation(-2000) depth(2112.589) | ||
| + | F: elevation(-5000) depth(5112.589) | ||
| + | |||
| + | Result by Model: | ||
| + | |||
| + | cvmh | ||
| + | Vs Vp | ||
| + | (by elevation) (by depth) (by elevation) (by depth) | ||
| + | 4680.573 4680.573 2430.200 2430.200 | ||
| + | 4682.998 4682.998 2432.200 2432.200 | ||
| + | 4712.152 4712.152 2451.300 2451.300 | ||
| + | 4768.784 4768.784 2486.912 2486.912 | ||
| + | 4859.654 4859.654 2540.834 2540.834 | ||
| + | 5373.960 5373.960 2804.333 2804.333 | ||
| + | |||
| + | cvms | ||
| + | Vs Vp | ||
| + | (by elevation) (by depth) (by elevation) (by depth) | ||
| + | 5151.152 5151.152 2952.019 2952.019 | ||
| + | 5151.152 5151.152 2952.019 2952.019 | ||
| + | 5151.152 5151.152 2952.019 2952.019 | ||
| + | 5170.681 5169.091 2972.140 2970.502 | ||
| + | 5329.671 5328.081 3135.951 3134.312 | ||
| + | 5850.498 5845.330 3600.128 3600.713 | ||
| + | |||
| + | cvms5 | ||
| + | Vs Vp | ||
| + | (by elevation) (by depth) (by elevation) (by depth) | ||
| + | 3903.619 3903.615 2129.922 2129.921 | ||
| + | 3903.673 3903.668 2129.932 2129.931 | ||
| + | 3903.815 3903.810 2129.960 2129.959 | ||
| + | 3896.509 3895.861 2098.373 2097.965 | ||
| + | 3876.443 3877.072 2067.233 2067.894 | ||
| + | 4400.208 4394.484 2420.105 2417.289 | ||
| + | |||
| + | cvmsi | ||
| + | Vs Vp | ||
| + | (by elevation) (by depth) (by elevation) (by depth) | ||
| + | 3944.456 3944.452 2118.312 2118.312 | ||
| + | 3944.503 3944.499 2118.323 2118.322 | ||
| + | 3944.629 3944.625 2118.352 2118.351 | ||
| + | 3961.562 3960.529 2104.522 2103.804 | ||
| + | 3969.253 3969.682 2094.039 2094.569 | ||
| + | 4487.691 4481.987 2445.242 2442.489 | ||
| + | |||
| + | cca | ||
| + | Vs Vp | ||
| + | (by elevation) (by depth) (by elevation) (by depth) | ||
| + | 3654.861 3654.299 2010.981 2010.743 | ||
| + | 3661.186 3660.624 2013.665 2013.427 | ||
| + | 3678.040 3677.478 2020.816 2020.578 | ||
| + | 3792.840 3790.156 2071.238 2069.795 | ||
| + | 4010.393 4008.760 2176.723 2176.007 | ||
| + | 4729.531 4724.311 2655.600 2652.685 | ||
| + | |||
| + | cs173 | ||
| + | Vs Vp | ||
| + | (by elevation) (by depth) (by elevation) (by depth) | ||
| + | 3654.833 3654.271 2010.996 2010.757 | ||
| + | 3661.159 3660.597 2013.679 2013.441 | ||
| + | 3679.039 3678.336 2021.223 2020.931 | ||
| + | 3792.818 3790.134 2071.244 2069.801 | ||
| + | 4010.365 4008.732 2176.710 2175.993 | ||
| + | 4729.473 4724.253 2655.543 2652.628 | ||
| + | |||
| + | bbp1d | ||
| + | Vs Vp | ||
| + | (by elevation) (by depth) (by elevation) (by depth) | ||
| + | 1800.000 1700.000 783.326 450.000 | ||
| + | 2445.178 2425.178 1222.589 1212.589 | ||
| + | 2983.883 2968.883 1522.589 1512.589 | ||
| + | 3742.906 3739.406 2118.388 2116.888 | ||
| + | 4092.906 4089.406 2268.388 2266.888 | ||
| + | 5161.294 5156.294 2842.906 2839.406 | ||
| + | |||
| + | 1d | ||
| + | Vs Vp | ||
| + | (by elevation) (by depth) (by elevation) (by depth) | ||
| + | 5000.000 5000.000 2886.751 2886.751 | ||
| + | 5000.000 5000.000 2886.751 2886.751 | ||
| + | 5000.000 5000.000 2886.751 2886.751 | ||
| + | 5015.324 5014.074 2895.598 2894.877 | ||
| + | 5140.324 5139.074 2967.767 2967.046 | ||
| + | 5598.071 5590.071 3232.048 3227.429 | ||
| + | |||
| + | |||
| + | [http://hypocenter.usc.edu/research/ucvmc_result/TAPE_chk_elevation raw data] | ||
| + | |||
| + | == Model profile by elevation vs by depth == | ||
| + | |||
| + | {| | ||
| + | | [[File:cvmh_bakersfield_depth.png|thumb|300px|by depth]] | ||
| + | | [[File:cvmh_bakersfield_elevation.png|thumb|300px|by elevation]] | ||
| + | |} | ||
| + | |||
| + | {| | ||
| + | | [[File:cvmh_bombayBeach_depth.png|thumb|300px|by depth]] | ||
| + | | [[File:cvmh_bombayBeach_elevation.png|thumb|300px|by elevation]] | ||
| + | |} | ||
| + | |||
| + | <pre> | ||
| + | ./plot_elevation_profile.py -d vp -b ${START_ELEVATION} -e ${END_ELEVATION} -v -10 -c ${MODEL} -s ${LAT},${LON} -o ${MODEL}_${IDX}_elevation.png | ||
| + | </pre> | ||
| + | |||
| + | START is 1000 | ||
| + | END is -3000 | ||
| + | MODEL is cvmh | ||
| + | IDX is bombayBeach | ||
| + | LAT is 33.350833 | ||
| + | LON is -115.729722 | ||
| + | |||
| + | [http://hypocenter.usc.edu/research/ucvmc_result/TAPE_elevation.tar.gz raw data] | ||
| + | |||
| + | == Plot cross section by elevation vs by depth == | ||
| + | |||
| + | {| | ||
| + | | [[File:cvmh_santaCross_final.png|thumb|300px|cvmh by depth, Vs]] | ||
| + | | [[File:cvmh_santaElevationCross_final.png|thumb|300px|cvmh by elevation, Vs]] | ||
| + | |} | ||
| + | |||
| + | {| | ||
| + | | [[File:cs173_santaCross_final.png|thumb|300px|cs173 by depth, Vs]] | ||
| + | | [[File:cs173_santaElevationCross_final.png|thumb|300px|cs173 by elevation, Vs]] | ||
| + | |} | ||
| + | |||
| + | |||
| + | <pre> ./plot_cross_section.py -b 35,-121 -u 35,-118 -h 1000 -v 100 -d vs -c cs173 -a s -s 0 -e 10000 -o | ||
| + | TAPE_RESULT/cs173_santaCross_final.png | ||
| + | |||
| + | ./plot_elevation_cross_section.py -b 35,-121 -u 35,-118 -h 1000 -v -100 -d vs -c cs173 -a s -s 20 | ||
| + | 00 -e -8000 -o TAPE_RESULT/cs173_santaElevationCross_final.png | ||
| + | |||
| + | ./plot_cross_section.py -b 35,-121 -u 35,-118 -h 1000 -v 100 -d vs -c cvmh -a s -s 0 -e 10000 -o | ||
| + | TAPE_RESULT/cvmh_santaCross_final.png | ||
| + | |||
| + | ./plot_elevation_cross_section.py -b 35,-121 -u 35,-118 -h 1000 -v -100 -d vs -c cvmh -a s -s 200 | ||
| + | 0 -e -8000 -o TAPE_RESULT/cvmh_santaElevationCross_final.png | ||
| + | </pre> | ||
| + | |||
| + | {| | ||
| + | | [[File:1d_santaCross_final.png|thumb|300px|1d by depth, Vs]] | ||
| + | | [[File:1d_santaElevationCross_final.png|thumb|300px| by elevation, Vs]] | ||
| + | |} | ||
| + | |||
| + | {| | ||
| + | | [[File:bbp1d_santaCross_final.png|thumb|300px|bbp1d by depth, Vs]] | ||
| + | | [[File:bbp1d_santaElevationCross_final.png|thumb|300px| bbp1d elevation, Vs]] | ||
| + | |} | ||
| + | |||
| + | {| | ||
| + | | [[File:cvms_santaCross_final.png|thumb|300px|cvms by depth, Vs]] | ||
| + | | [[File:cvms_santaElevationCross_final.png|thumb|300px|cvms by elevation, Vs]] | ||
| + | |} | ||
| + | |||
| + | {| | ||
| + | | [[File:cvmsi_santaCross_final.png|thumb|300px|cvmsi by depth, Vs]] | ||
| + | | [[File:cvmsi_santaElevationCross_final.png|thumb|300px|cvmsi by elevation, Vs]] | ||
| + | |} | ||
| + | |||
| + | {| | ||
| + | | [[File:cvms5_santaCross_final.png|thumb|300px|cvms5 by depth, Vs]] | ||
| + | | [[File:cvms5_santaElevationCross_final.png|thumb|300px|cvms5 by elevation, Vs]] | ||
| + | |} | ||
| + | |||
| + | {| | ||
| + | | [[File:cca_santaCross_final.png|thumb|300px|cca by depth, Vs]] | ||
| + | | [[File:cca_santaElevationCross_final.png|thumb|300px|cca by elevation, Vs]] | ||
| + | |} | ||
| + | |||
| + | On the side, | ||
| + | |||
| + | {| | ||
| + | | [[File:cca_GTL_santaCross_final.png|thumb|300px|cca with GTL by depth, Vs]] | ||
| + | | [[File:cca_GTL_santaElevationCross_final.png|thumb|300px|cca with GTL by elevation, Vs]] | ||
| + | |} | ||
| + | |||
| + | [http://hypocenter.usc.edu/research/ucvmc_result/TAPE_cross.tar.gz raw data] | ||
== Related Links == | == Related Links == | ||
*[[UCVM]] | *[[UCVM]] | ||
Latest revision as of 08:32, 1 March 2019
Contents
Model Boundary
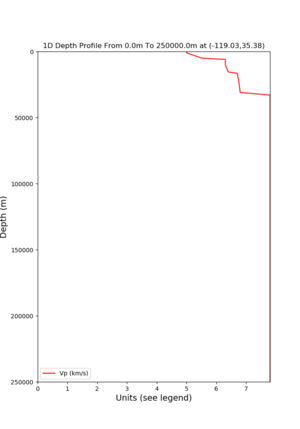
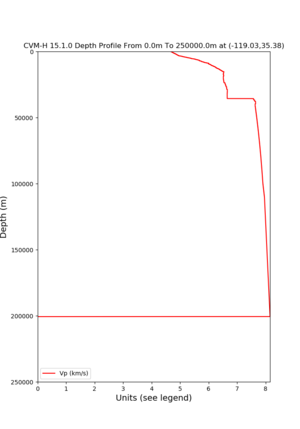
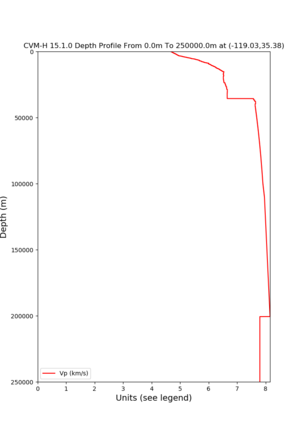
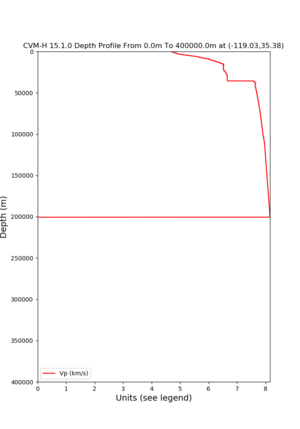
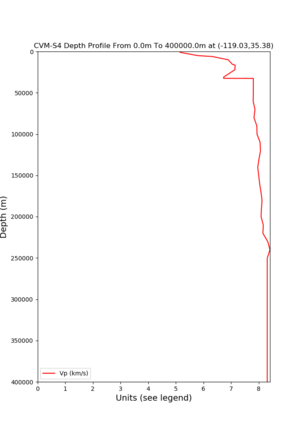
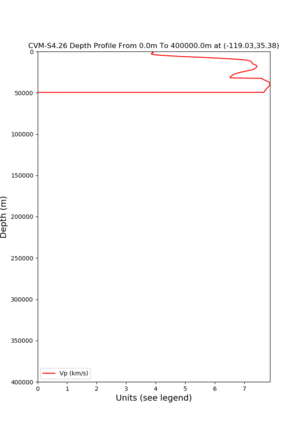
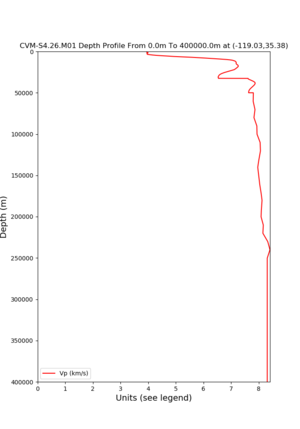
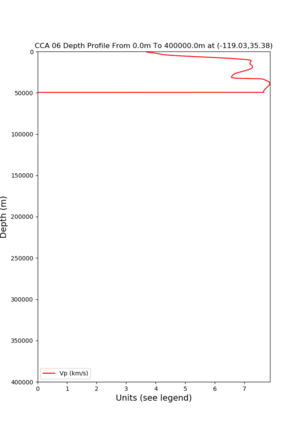
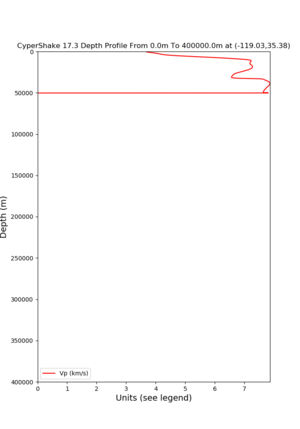
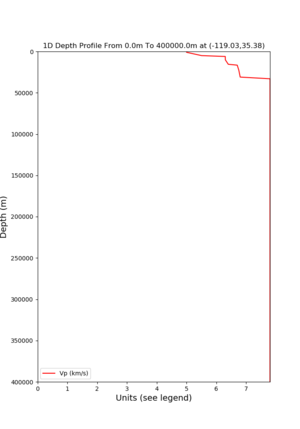
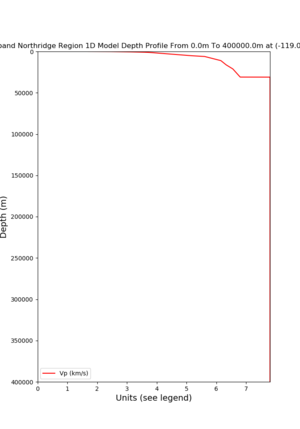
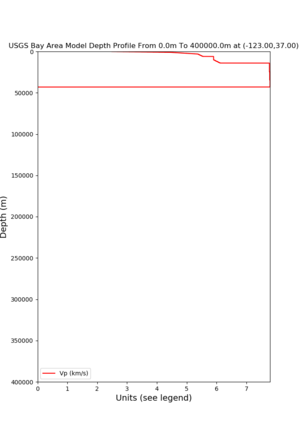
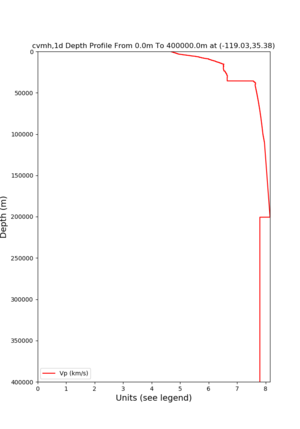
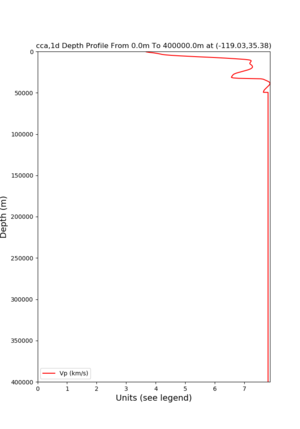
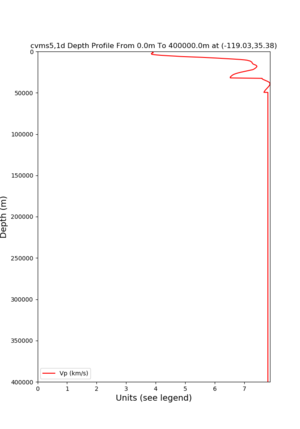
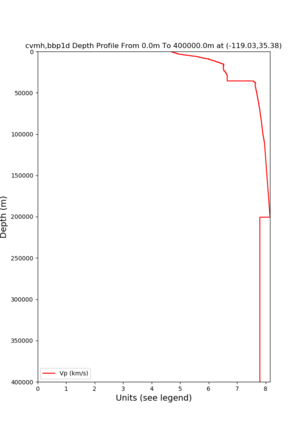
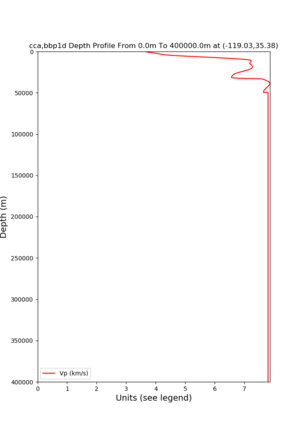
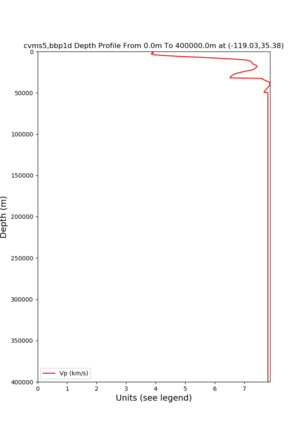
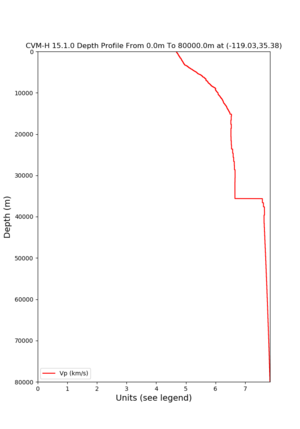
Using depth profile plots to show the bottom of the model boundary in relationship to possible background 1d model
Using (-119.03, 35.38) near Bakersfield, CA
SCEC 1d (1d)
CVM-H v15.1(cvmh) with optional configurable 1d background
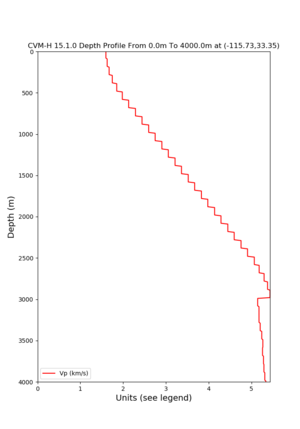
./plot_depth_profile.py -d vp -b ${START} -e ${END} -v 10 -c ${MODEL} -s ${LAT},${LON} -o ${MODEL}_${IDX}_depth.png
 START is 0
 END is 250000
 MODEL is cvmh
 IDX is Bakersfield
 LAT is 35.38
 LON is -119.03
How deep are the Models
At -119.03,35.38
At -123,37,0.0,1000000.0
Extending Model boundary with tiling
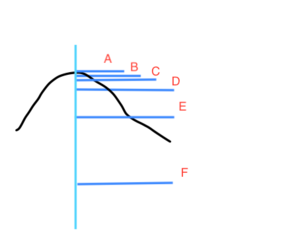
Query by elevation vs by depth
Target point: near Bakersfield (-119.0300,35.3800, elevation is at 112.589)
 A: elevation(112.589) depth(0)
 B: elevation(0)       depth(112.589)
 C: elevation(-300)    depth(412.589)
 D: elevation(-1000)   depth(1112.589)
 E: elevation(-2000)   depth(2112.589)
 F: elevation(-5000)   depth(5112.589)
Result by Model:
cvmh
Vs                                Vp
(by elevation) (by depth)   (by elevation)  (by depth)
4680.573       4680.573       2430.200       2430.200
4682.998       4682.998       2432.200       2432.200
4712.152       4712.152       2451.300       2451.300
4768.784       4768.784       2486.912       2486.912
4859.654       4859.654       2540.834       2540.834
5373.960       5373.960       2804.333       2804.333
cvms
Vs                                Vp
(by elevation) (by depth)   (by elevation)  (by depth)
5151.152       5151.152       2952.019       2952.019
5151.152       5151.152       2952.019       2952.019
5151.152       5151.152       2952.019       2952.019
5170.681       5169.091       2972.140       2970.502
5329.671       5328.081       3135.951       3134.312
5850.498       5845.330       3600.128       3600.713
cvms5
Vs                                Vp
(by elevation) (by depth)   (by elevation)  (by depth)
3903.619       3903.615       2129.922       2129.921
3903.673       3903.668       2129.932       2129.931
3903.815       3903.810       2129.960       2129.959
3896.509       3895.861       2098.373       2097.965
3876.443       3877.072       2067.233       2067.894
4400.208       4394.484       2420.105       2417.289
cvmsi
Vs                                Vp
(by elevation) (by depth)   (by elevation)  (by depth)
3944.456       3944.452       2118.312       2118.312
3944.503       3944.499       2118.323       2118.322
3944.629       3944.625       2118.352       2118.351
3961.562       3960.529       2104.522       2103.804
3969.253       3969.682       2094.039       2094.569
4487.691       4481.987       2445.242       2442.489
cca
Vs                                Vp
(by elevation) (by depth)   (by elevation)  (by depth)
3654.861       3654.299       2010.981       2010.743
3661.186       3660.624       2013.665       2013.427
3678.040       3677.478       2020.816       2020.578
3792.840       3790.156       2071.238       2069.795
4010.393       4008.760       2176.723       2176.007
4729.531       4724.311       2655.600       2652.685
cs173
Vs                                Vp
(by elevation) (by depth)   (by elevation)  (by depth)
3654.833       3654.271       2010.996       2010.757
3661.159       3660.597       2013.679       2013.441
3679.039       3678.336       2021.223       2020.931
3792.818       3790.134       2071.244       2069.801
4010.365       4008.732       2176.710       2175.993
4729.473       4724.253       2655.543       2652.628
bbp1d
Vs                                Vp
(by elevation) (by depth)   (by elevation)  (by depth)
1800.000       1700.000       783.326        450.000
2445.178       2425.178       1222.589       1212.589
2983.883       2968.883       1522.589       1512.589
3742.906       3739.406       2118.388       2116.888
4092.906       4089.406       2268.388       2266.888
5161.294       5156.294       2842.906       2839.406
1d
Vs                                Vp
(by elevation) (by depth)   (by elevation)  (by depth)
5000.000       5000.000       2886.751       2886.751
5000.000       5000.000       2886.751       2886.751
5000.000       5000.000       2886.751       2886.751
5015.324       5014.074       2895.598       2894.877
5140.324       5139.074       2967.767       2967.046
5598.071       5590.071       3232.048       3227.429
Model profile by elevation vs by depth
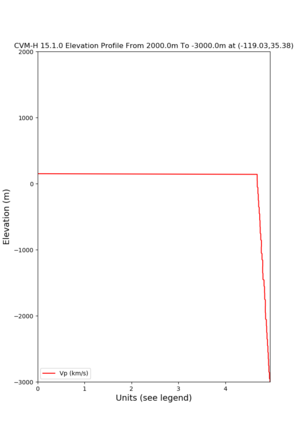
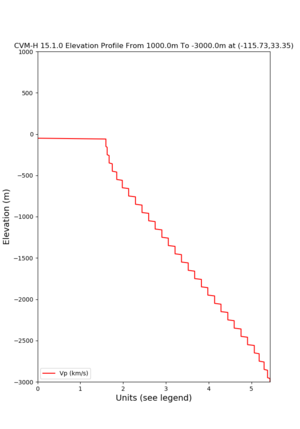
./plot_elevation_profile.py -d vp -b ${START_ELEVATION} -e ${END_ELEVATION} -v -10 -c ${MODEL} -s ${LAT},${LON} -o ${MODEL}_${IDX}_elevation.png
 START is 1000
 END is -3000
 MODEL is cvmh
 IDX is bombayBeach
 LAT is 33.350833
 LON is -115.729722
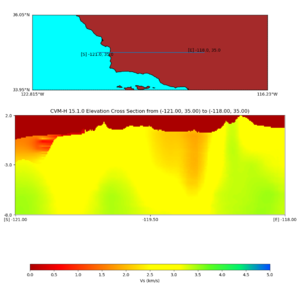
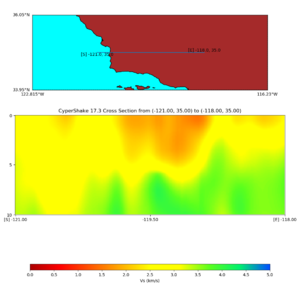
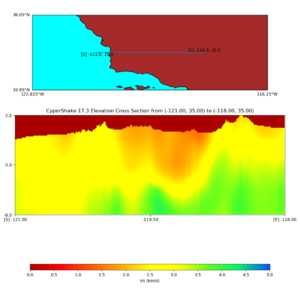
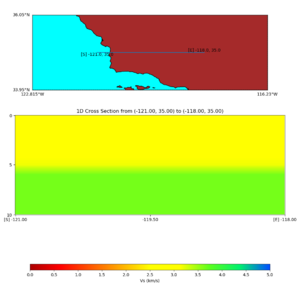
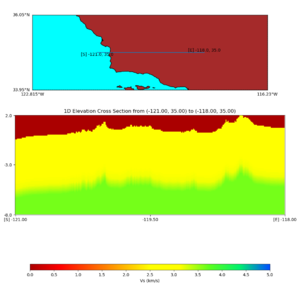
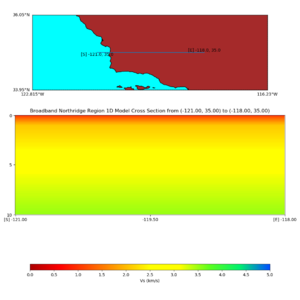
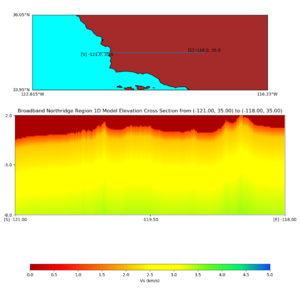
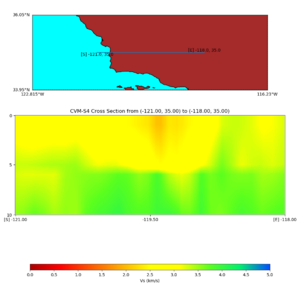
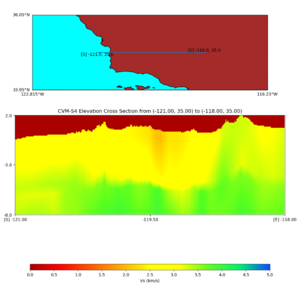
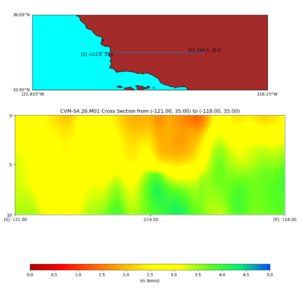
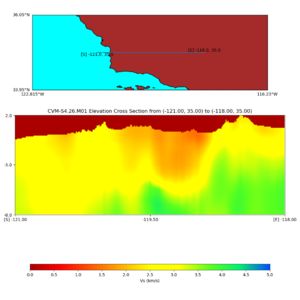
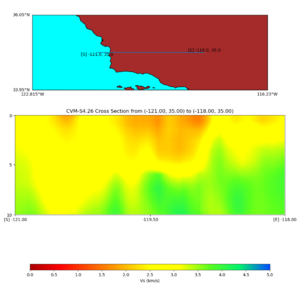
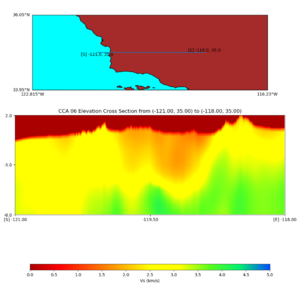
Plot cross section by elevation vs by depth
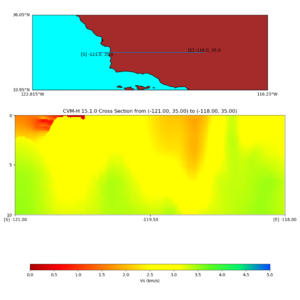
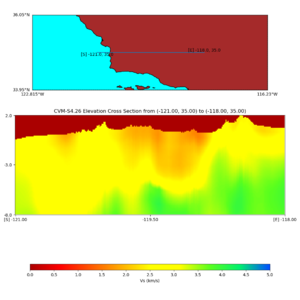
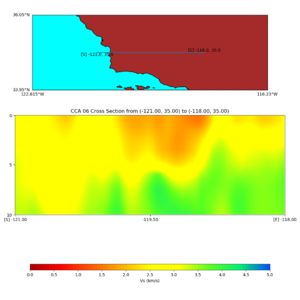
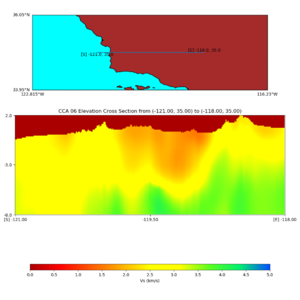
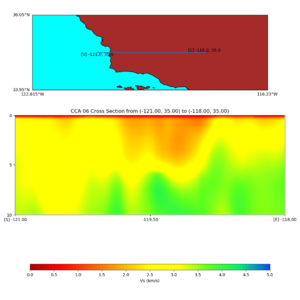
 ./plot_cross_section.py -b 35,-121 -u 35,-118 -h 1000 -v 100 -d vs -c cs173 -a s -s 0 -e 10000 -o
 TAPE_RESULT/cs173_santaCross_final.png

  ./plot_elevation_cross_section.py -b 35,-121 -u 35,-118 -h 1000 -v -100 -d vs -c cs173 -a s -s 20
00 -e -8000 -o TAPE_RESULT/cs173_santaElevationCross_final.png

  ./plot_cross_section.py -b 35,-121 -u 35,-118 -h 1000 -v 100 -d vs -c cvmh -a s -s 0 -e 10000 -o
TAPE_RESULT/cvmh_santaCross_final.png

  ./plot_elevation_cross_section.py -b 35,-121 -u 35,-118 -h 1000 -v -100 -d vs -c cvmh -a s -s 200
0 -e -8000 -o TAPE_RESULT/cvmh_santaElevationCross_final.png
On the side,
