Difference between revisions of "CyberShake PBR"
| (3 intermediate revisions by the same user not shown) | |||
| Line 8: | Line 8: | ||
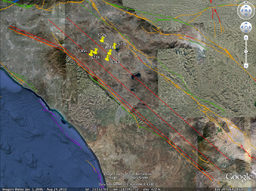
[[File:Anderson Faultlines.png|256px|thumb|right|Fig 1:Map of velocity profile lines of interest. Pins represent CyberShake hazard curve sites. GAVI is a precarious rock site and a CyberShake hazard curve site. (Image Credit: John Anderson (UNR))]] | [[File:Anderson Faultlines.png|256px|thumb|right|Fig 1:Map of velocity profile lines of interest. Pins represent CyberShake hazard curve sites. GAVI is a precarious rock site and a CyberShake hazard curve site. (Image Credit: John Anderson (UNR))]] | ||
| + | |||
| + | == Requested Velocity Profiles == | ||
| + | |||
| + | The specific data I think we are looking for would be for four slices, going all the way from the surface to 40 km depth. The GAVI slice would would be along the line of precarious rocks between the Elsinore and San Jacinto fault, offset 10 km from a linear approximation to the fault, and going near the GAVI precarious rock. The PERR slice would be parallel to the GAVI slice, but offset from the fault by 20 km, and going near the PERR precarious rock. Slices 2 (A & B) are offset 2 km from the linear approximateion to the fault, with two segments because of the fault bend. Jim thought it best if this is offset by a kilometer or two to the east since we don't know if there is some particular low velocity zone along the fault itself. My reasoning is that these slices would show me the velocity models sampling the volume within which I would generate synthetic Green's functions. For generating the Green's functions, I use an algorithm to find Green's functions in a flat-layered structure. So I would be particularly looking at how much the models change laterally along these slices, and how different they are, and judging where to go from there. Obviously numerical values would be most helpful. | ||
| + | |||
| + | The end points of the slices that I was looking for are (ignore the extra decimal places put in by Google Earth): | ||
| + | *PERR slice: NW end ( 34.067655°, -117.580232°). SE end ( 33.113122°, -116.285225°). | ||
| + | *GAVI slice: NW end ( 34.058123°, -117.732689°). SE end ( 33.046704°, -116.357996°). | ||
| + | *Slice 2A: NW end ( 34.016636°, -118.044760°). SE end ( 33.864237°, -117.596362°). | ||
| + | *Slice 2B: NW end ( 33.864237°, -117.596362°). SE end ( 32.993160°, -116.415465°). | ||
| + | |||
| + | Slices 2A and 2B follow the bend in the Whittier-Elsinore fault system. All of the slices, and a linear approximation to the fault, are on the attached screen capture. | ||
| + | |||
== See Also == | == See Also == | ||
*[[CyberShake]] | *[[CyberShake]] | ||
*[[Validation]] | *[[Validation]] | ||
| − | * | + | *[http://www.seismo.unr.edu/Faculty/2/ John Anderson UNR] |
Latest revision as of 19:58, 3 April 2011
Precarious Balanced Rocks (PBR) can be used to estimate peak strong ground motions over long periods of time. They provide important upper constraints on long-term probabilistic seismic hazard estimates.
CyberShake PBR
Standard PSHA provides long term peak ground motion estimates as single ground motion parameter such as peak ground acceleration. CyberShake provides a way to extend existing PSHA to provide more than peak ground motions. Through extended scientific HPC processing, CyberShake provides ground motion seismograms, together with peak ground motions values.
We are studying the effect of CyberShake seismograms on precarious rocks. To do this, we are gathering velocity profile information used in our CyberShake hazard calculations.
Requested Velocity Profiles
The specific data I think we are looking for would be for four slices, going all the way from the surface to 40 km depth. The GAVI slice would would be along the line of precarious rocks between the Elsinore and San Jacinto fault, offset 10 km from a linear approximation to the fault, and going near the GAVI precarious rock. The PERR slice would be parallel to the GAVI slice, but offset from the fault by 20 km, and going near the PERR precarious rock. Slices 2 (A & B) are offset 2 km from the linear approximateion to the fault, with two segments because of the fault bend. Jim thought it best if this is offset by a kilometer or two to the east since we don't know if there is some particular low velocity zone along the fault itself. My reasoning is that these slices would show me the velocity models sampling the volume within which I would generate synthetic Green's functions. For generating the Green's functions, I use an algorithm to find Green's functions in a flat-layered structure. So I would be particularly looking at how much the models change laterally along these slices, and how different they are, and judging where to go from there. Obviously numerical values would be most helpful.
The end points of the slices that I was looking for are (ignore the extra decimal places put in by Google Earth):
- PERR slice: NW end ( 34.067655°, -117.580232°). SE end ( 33.113122°, -116.285225°).
- GAVI slice: NW end ( 34.058123°, -117.732689°). SE end ( 33.046704°, -116.357996°).
- Slice 2A: NW end ( 34.016636°, -118.044760°). SE end ( 33.864237°, -117.596362°).
- Slice 2B: NW end ( 33.864237°, -117.596362°). SE end ( 32.993160°, -116.415465°).
Slices 2A and 2B follow the bend in the Whittier-Elsinore fault system. All of the slices, and a linear approximation to the fault, are on the attached screen capture.
