Difference between revisions of "Low Frequency Site Response"
| (3 intermediate revisions by the same user not shown) | |||
| Line 77: | Line 77: | ||
| 332.0 | | 332.0 | ||
| [[File:SMCA_site_response_lf_v_bb.png|thumb|500px]] | | [[File:SMCA_site_response_lf_v_bb.png|thumb|500px]] | ||
| + | |} | ||
| + | |||
| + | == Landers multi-segment validation comparisons == | ||
| + | |||
| + | Below are scatter plots comparing low frequency and broadband CyberShake results for the BBP Landers validation event, as well as results for a few selected sites. | ||
| + | |||
| + | {| border="1" | ||
| + | ! Site !! Thompson Vs30 !! CVM-S4.26.M01 + taper Vs30 !! Vref !! Scatterplot | ||
| + | |- | ||
| + | ! Aggregate | ||
| + | | | ||
| + | | | ||
| + | | | ||
| + | | [[File:all_site_response_landers_lf_v_bb.png|thumb|500px]] | ||
| + | |- | ||
| + | ! SBSM | ||
| + | | 274.5 | ||
| + | | 255.9 | ||
| + | | 285.4 | ||
| + | | [[File:SBSM_site_response_landers_lf_v_bb.png|thumb|500px]] | ||
| + | |- | ||
| + | ! VER | ||
| + | | 235.2 | ||
| + | | 306.7 | ||
| + | | 262.7 | ||
| + | | [[File:VER_site_response_landers_lf_v_bb.png|thumb|500px]] | ||
| + | |- | ||
| + | ! BKR | ||
| + | | 293.5 | ||
| + | | 310.1 | ||
| + | | 341.4 | ||
| + | | [[File:BKR_site_response_landers_lf_v_bb.png|thumb|500px]] | ||
| + | |- | ||
| + | ! W15 | ||
| + | | 351.3 | ||
| + | | 220.3 | ||
| + | | 243.3 | ||
| + | | [[File:W15_site_response_landers_lf_v_bb.png|thumb|500px]] | ||
| + | |- | ||
| + | ! LCN | ||
| + | | 710.1 | ||
| + | | 642.9 | ||
| + | | 658.1 | ||
| + | | [[File:LCN_site_response_landers_lf_v_bb.png|thumb|500px]] | ||
| + | |- | ||
|} | |} | ||
Latest revision as of 20:53, 13 March 2024
This page documents our analysis of the impact of the low frequency site response, as applied to deterministic seismograms as part of the broadband simulation process.
Study 22.12 comparisons
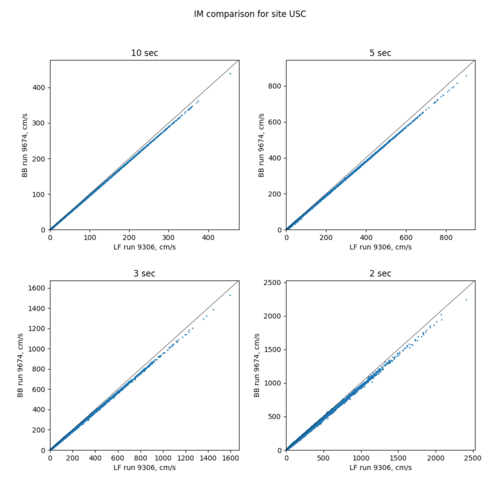
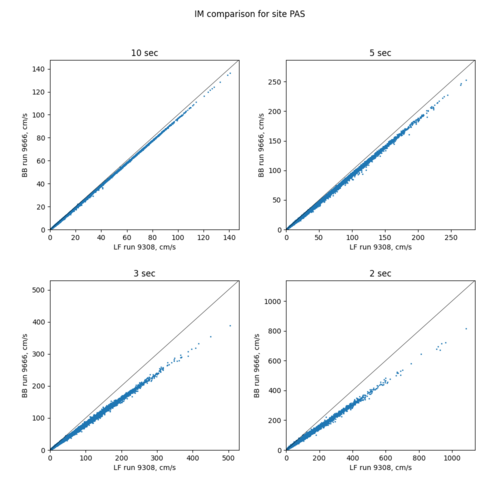
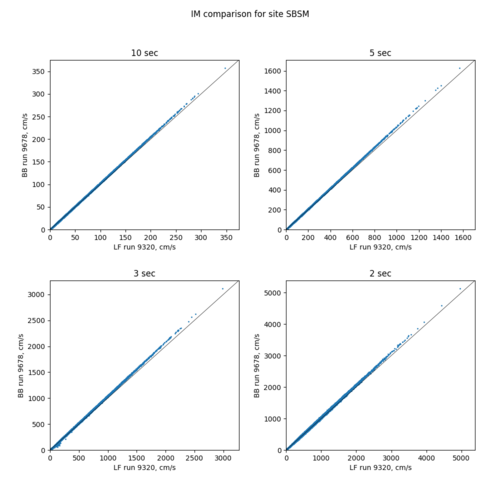
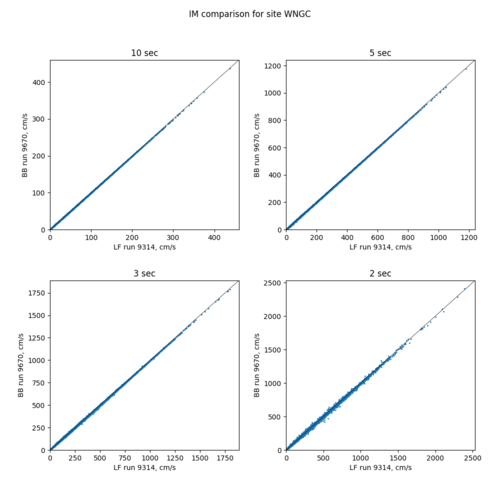
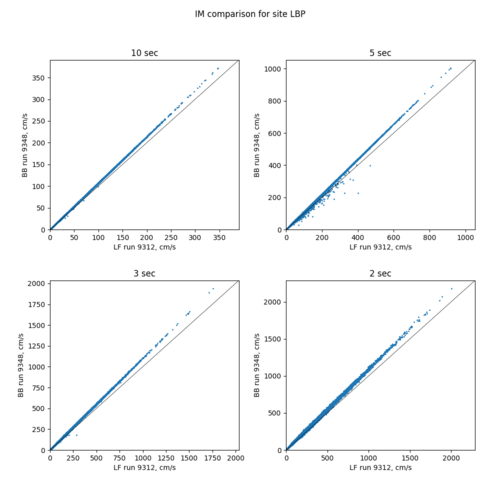
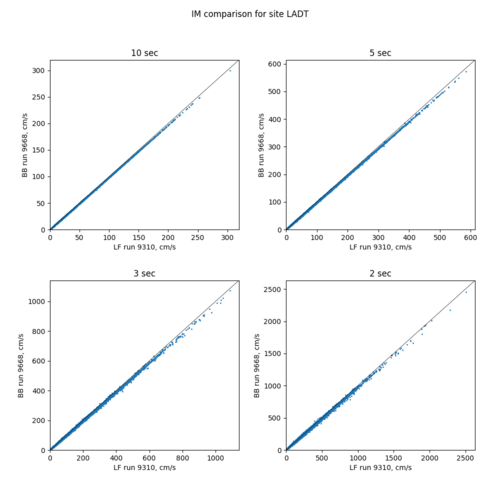
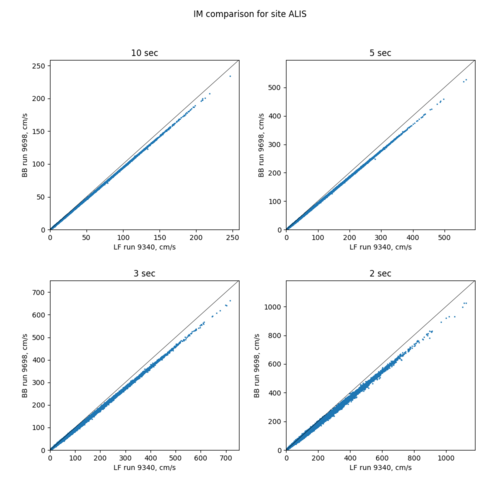
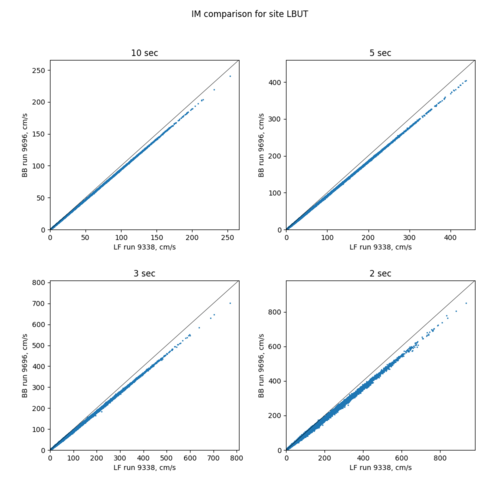
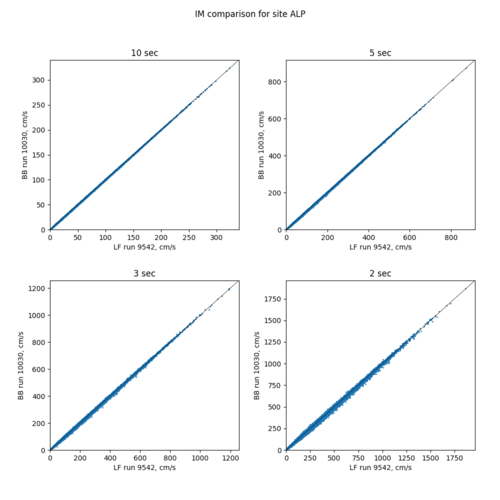
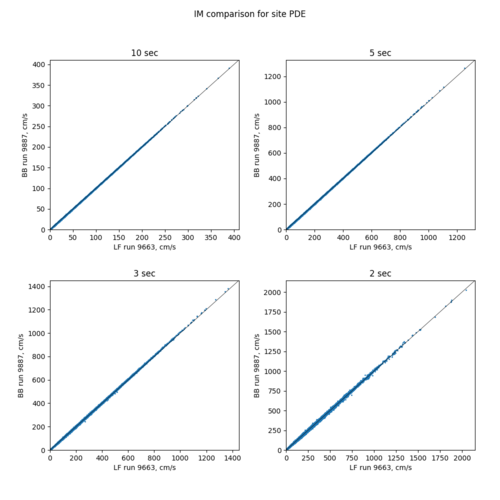
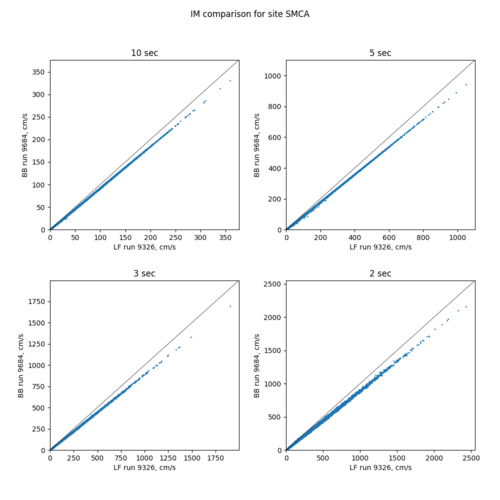
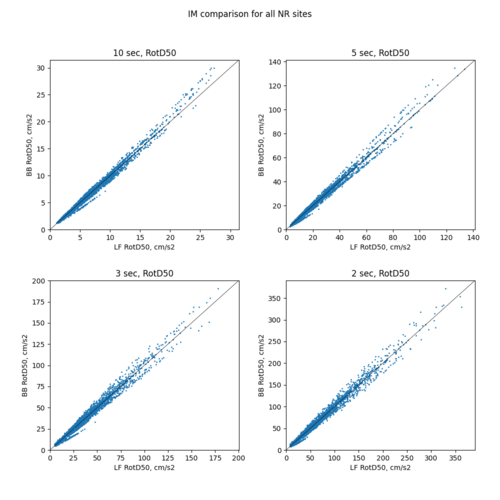
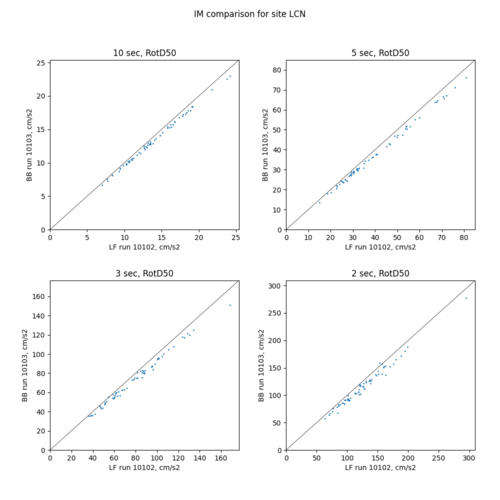
Below are RotD50 scatterplots comparing Study 22.12 low-frequency and Study 22.12 broadband results, at periods of 2-10 sec. Since the Study 22.12 LF results don't include site response and the broadband results do, this provides a way for us to examine the impact of the site response.
If Vs30 < Vref, then ground motion is increased; otherwise, the ground motion is decreased.
(Note that the units are wrong; these plots are actually cm/s2.)
| Site | Thompson Vs30 | CVM-S4.26.M01 + taper Vs30 | Vref | Scatterplot |
|---|---|---|---|---|
| USC | 336.4 | 295.7 | 320.5 | |
| PAS | 907.6 | 687.7 | 709.1 | |
| SBSM | 274.5 | 255.9 | 285.4 | |
| WNGC | 292.5 | 264.5 | 290.7 | |
| LBP | 226.2 | 209.5 | 248.6 | |
| LADT | 349.0 | 334.2 | 340.8 | |
| ALIS | 720.7 | 649.7 | 664.6 | |
| LBUT | 719.7 | 646.5 | 661.7 | |
| ALP | 351.9 | 325.5 | 352.9 | |
| PDE | 351.8 | 333.9 | 354.8 | |
| SMCA | 372.0 | 319.2 | 332.0 |
Landers multi-segment validation comparisons
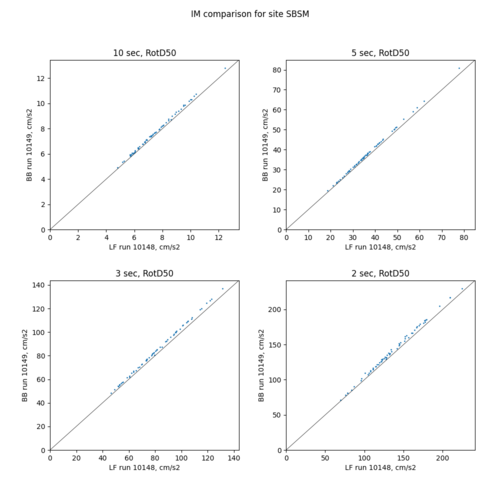
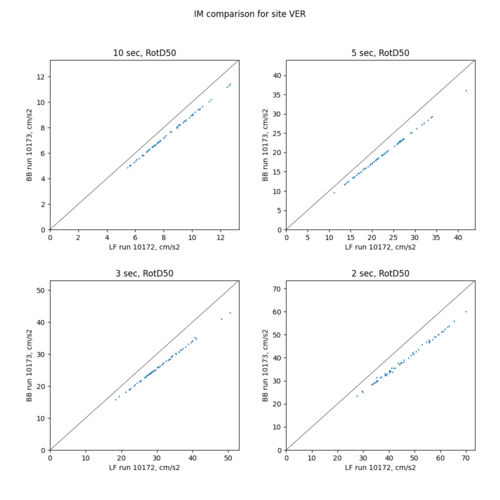
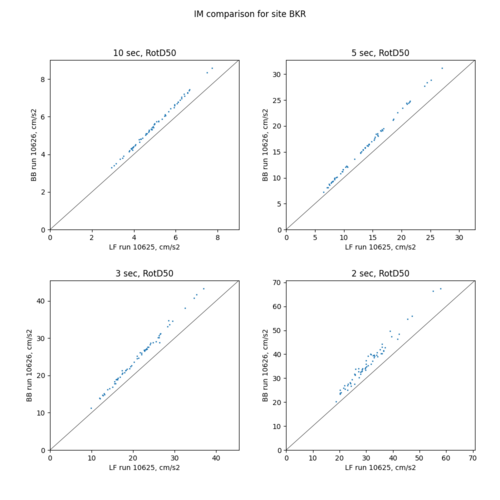
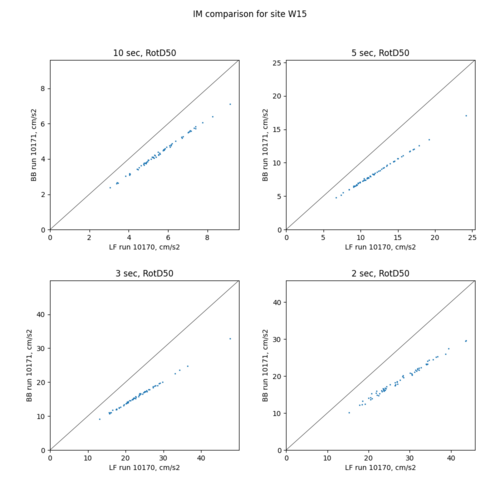
Below are scatter plots comparing low frequency and broadband CyberShake results for the BBP Landers validation event, as well as results for a few selected sites.
| Site | Thompson Vs30 | CVM-S4.26.M01 + taper Vs30 | Vref | Scatterplot |
|---|---|---|---|---|
| Aggregate | ||||
| SBSM | 274.5 | 255.9 | 285.4 | |
| VER | 235.2 | 306.7 | 262.7 | |
| BKR | 293.5 | 310.1 | 341.4 | |
| W15 | 351.3 | 220.3 | 243.3 | |
| LCN | 710.1 | 642.9 | 658.1 |
