Difference between revisions of "Wall to Wall"
| (7 intermediate revisions by the same user not shown) | |||
| Line 12: | Line 12: | ||
== Wall to Wall Simulation Results == | == Wall to Wall Simulation Results == | ||
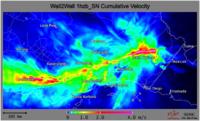
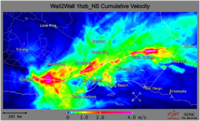
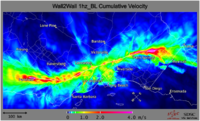
| − | + | The following images show peak ground velocities for the 3 wall-to-wall simulations (top southeast-northwest; center northwest-southeast; bottom bi-lateral rupture rupture). | |
| − | |||
| − | |||
| − | |||
| − | + | [[File:W2W_r1.png|200px|thumb|left|Fig 1. Wall to Wall South to North Rupture peak ground velocities]] | |
| + | [[File:W2W_r2.png|200px|thumb|left|Fig 2. Wall to Wall North to South Rupture peak ground velocities]] | ||
| + | [[File:W2W_r3.png|200px|thumb|left|Fig 3. Wall to Wall Bi-lateral Rupture peak ground velocities]] | ||
| + | |||
| + | [[File:W2w_100m_cropped_50percent.png|200px|thumb|left|Fig 4. Wall to Wall Rupture Parameters on 300km+ rupture length.]] | ||
== Wall to Wall Related Information == | == Wall to Wall Related Information == | ||
*[http://www.geology.sdsu.edu/people/faculty/olsen/ Kim Olsen Web Page San Diego State University] | *[http://www.geology.sdsu.edu/people/faculty/olsen/ Kim Olsen Web Page San Diego State University] | ||
Latest revision as of 07:10, 11 October 2010
SCEC Wall to Wall Simulation Description
Mw8.0 Wall-to-Wall Scenarios on the San Andreas Fault Kim Olsen, October 30 2009
The significance of the TeraShake (Mw7.7, southernmost ~200 km stretch, Olsen et al., 2006, 2008) and ShakeOut (Mw7.8, southermost ~300 km stretch, Graves et al., 2008, Olsen et al., 2009) scenario simulations for the southern San Andreas fault was based on the fact that this part of the fault has not seen a major event seen 1690 (Weldon et al., 2004). While there is historical data supporting that TeraShake or ShakeOut-type scenarios have occurred, there is no clear consensus that a scenario extending from Bombay Beach at the Salton Sea to Parkfield (~550 km, a ’wall-to-wall event’) has ever happened. However, it is possible that the paleoseismic records may have missed such event, and it is imperative to estimate the resulting ground motions that would be generated by such scenario. The area affected by a wall-to-wall earthquake is large (~800 km by 400 km), and not until recent advances in parallel computation, simulation of such scenario has been out of reach.
Here, we present the first results of a Mw8.0 wall-to-wall scenario, simulated in a 32 billion grid point subset of the SCEC Community Velocity Model (CVM) V4 with a minimum shear-wave velocity of 500 m/s up to a maximum frequency of 1 Hz. We have simulated 350s of wave propagation for 3 wall-to-wall source realizations, namely two uni-lateral (southeast-to-northwest and northwest-to-southeast) ruptures, and a bi-lateral rupture starting in the center of the fault. The source descriptions were generated by combining several dynamic Mw7.8 ShakeOut-D dynamic source descriptions. All realizations are characterized by strong directivity effects of the rupture, with highly variable pattern of the strong ground motion, and ‘sun-bursts’ radiating from the fault due to the complexity of the rupture propagation (see Figure 1). Along the fault, the Coachella Valley experiences strong shaking for all of the simulated ruptures. All source realizations generate large amplitudes in the Los Angeles and Ventura basins, with the most localized ‘pockets’ of amplification in Los Angeles for the uni-lateral ruptures.
Efforts are underway within SCEC to estimate the damage to buildings and expected fatalities for the three wall-to-wall scenario realizations.
Wall to Wall Simulation Results
The following images show peak ground velocities for the 3 wall-to-wall simulations (top southeast-northwest; center northwest-southeast; bottom bi-lateral rupture rupture).


