Difference between revisions of "ShakeOut 2013 Response Planning"
From SCECpedia
Jump to navigationJump to search| (31 intermediate revisions by 3 users not shown) | |||
| Line 1: | Line 1: | ||
| + | SCEC's research computing group used the ShakeOut 2013 event to practice creating useful earthquake and seismic hazard information for the SCEC community immediately after a large California event. We identified a series of digital data products that we can calculate using the software and system tools at SCEC, and posted the results on a SCEC wiki a soon as the results were available. We used one of the Northridge Near You event definitions, a scenario earthquake description for a San Bernardino M6.85, as the earthquake information available to us after a big event. | ||
| + | |||
== ShakeOut Home Page == | == ShakeOut Home Page == | ||
*[http://shakeout.org ShakeOut 2013 Home Page] | *[http://shakeout.org ShakeOut 2013 Home Page] | ||
| Line 5: | Line 7: | ||
*[http://hypocenter.usc.edu/research/ShakeOut/11_0930_Graves.pdf Northridge Near You UseIT Presentation] | *[http://hypocenter.usc.edu/research/ShakeOut/11_0930_Graves.pdf Northridge Near You UseIT Presentation] | ||
*[http://hypocenter.usc.edu/research/ShakeOut/UseIT-Intern-Scenarios_SCEC-2013.pdf NRNY Event Parameters] | *[http://hypocenter.usc.edu/research/ShakeOut/UseIT-Intern-Scenarios_SCEC-2013.pdf NRNY Event Parameters] | ||
| + | |||
| + | == Data Product Requirements == | ||
| + | Each Data Product must include: | ||
| + | * Hardcopy of data product in Intern Lab at SCEC | ||
| + | * Digital version of product (posted on wiki) | ||
| + | * Metadata file describing data product (posted on wiki) | ||
== Computational Data Product Targets == | == Computational Data Product Targets == | ||
| − | #MMI CyberShake map for event | + | #MMI CyberShake map for event [ Fig. 2] |
#Attenuation-relationship MMI ShakeMap (NRNY San Bernardino Event) | #Attenuation-relationship MMI ShakeMap (NRNY San Bernardino Event) | ||
#Attenuation-relationship PGV ShakeMap (NRNY San Bernardino Event) | #Attenuation-relationship PGV ShakeMap (NRNY San Bernardino Event) | ||
| Line 13: | Line 21: | ||
#SCEC-VDO 3D Aftershock visualization | #SCEC-VDO 3D Aftershock visualization | ||
#ShakeAlert Event Summary Test Result for Mainshock | #ShakeAlert Event Summary Test Result for Mainshock | ||
| − | |||
#Short Term Earthquake Probability (STEP) Map for next 24 hours | #Short Term Earthquake Probability (STEP) Map for next 24 hours | ||
#Shakecast RSS (Receive and Send) | #Shakecast RSS (Receive and Send) | ||
| + | #BBP Source Description in SRF Format | ||
#BBP MMI ShakeMap (NRNY San Bernardino Event) | #BBP MMI ShakeMap (NRNY San Bernardino Event) | ||
| + | #BBP PGV ShakeMap (NRNY San Bernardino Event) | ||
#BBP PGA ShakeMap (NRNY San Bernardino Event) | #BBP PGA ShakeMap (NRNY San Bernardino Event) | ||
| − | |||
| − | + | == Results Available Within 8 Hours == | |
| − | == Results Available | + | #[http://hypocenter.usc.edu/research/ShakeOut/CyberShake_ShakeMaps.zip CyberShake Map of Peak Spectral Acceleration at 3.0 Seconds for Same Event in CyberShake Catalog with CyberShake 13.4 CVM-S amplitudes at 200+ sites in Region.] |
| − | #[http://hypocenter.usc.edu/research/ShakeOut/CyberShake_ShakeMaps.zip | ||
#[http://hypocenter.usc.edu/research/ShakeOut/IMR_MMI_ShakeMaps.zip Attenuation-relationship MMI ShakeMap (NRNY San Bernardino Event)] | #[http://hypocenter.usc.edu/research/ShakeOut/IMR_MMI_ShakeMaps.zip Attenuation-relationship MMI ShakeMap (NRNY San Bernardino Event)] | ||
#[http://hypocenter.usc.edu/research/ShakeOut/IMR_PGV_ShakeMaps.zip Attenuation-relationship PGV ShakeMap (NRNY San Bernardino Event)] | #[http://hypocenter.usc.edu/research/ShakeOut/IMR_PGV_ShakeMaps.zip Attenuation-relationship PGV ShakeMap (NRNY San Bernardino Event)] | ||
| Line 28: | Line 35: | ||
#[http://hypocenter.usc.edu/research/ShakeOut/SCEC_VDO_Aftershock_Images.zip SCEC-VDO 3D Aftershock visualization] | #[http://hypocenter.usc.edu/research/ShakeOut/SCEC_VDO_Aftershock_Images.zip SCEC-VDO 3D Aftershock visualization] | ||
#[http://hypocenter.usc.edu/research/ShakeOut/ShakeAlert_Event_Summary.docx ShakeAlert Event Summary Test Result for Mainshock] | #[http://hypocenter.usc.edu/research/ShakeOut/ShakeAlert_Event_Summary.docx ShakeAlert Event Summary Test Result for Mainshock] | ||
| + | #[http://hypocenter.usc.edu/research/ShakeOut/STEP_Map_1D_Forecast.zip Short Term Earthquake Probability (STEP) Map for next 24 hours] | ||
| + | #[http://hypocenter.usc.edu/research/ShakeOut/ShakeCast_Rx_Tx.zip Shakecast RSS (Receive and Send)] | ||
| + | #[http://hypocenter.usc.edu/research/ShakeOut/SanBern_BBP_SRF.zip BBP Source Description in SRC Format and Plot] | ||
| + | #[http://hypocenter.usc.edu/research/ShakeOut/shakeout2013-gp-0034.srf BBP Source Description in SRF Format] | ||
| + | #[http://hypocenter.usc.edu/research/ShakeOut/BBP_MMI_ShakeMap.zip BBP MMI ShakeMap (NRNY San Bernardino Event)] | ||
| + | #[http://hypocenter.usc.edu/research/ShakeOut/BBP_PGV_ShakeMap.zip BBP PGV ShakeMap (NRNY San Bernardino Event)] | ||
| + | #[http://hypocenter.usc.edu/research/ShakeOut/BBP_PGA_ShakeMap.zip BBP PGA ShakeMap (NRNY San Bernardino Event)] | ||
| + | |||
| + | == Results == | ||
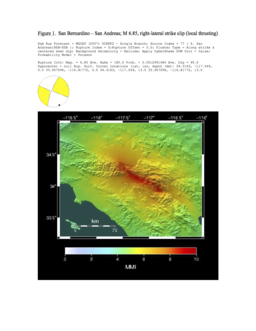
| + | [[File:UseIT-Intern-Scenarios SCEC-2013.png|256px|thumb|left|Fig 1: Intensity Map and Source Parameters as given in UseIT Study.]] | ||
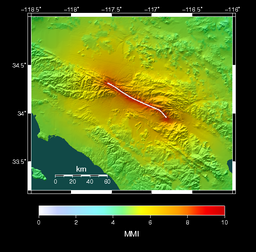
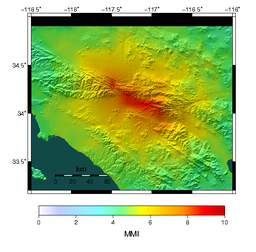
| + | [[File:San bern imr mmi shakemap.png|256px|thumb|right|Fig 2: Intensity Map based on Source Parameters and NGA Attenuation Relationship.]] | ||
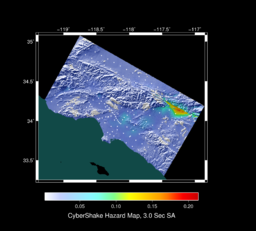
| + | [[File:San bern cybershake 3sec linear.png|256px|thumb|left|Fig 3: Distribution of Peak Spectral Acceleration at 3.0Seconds based on CyberShake 13.4 grounds motions.]] | ||
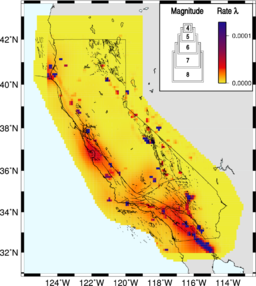
| + | [[File:Scec.csep.RELMTest.Map STEPJAVA 10 18 2013.png|256px|thumb|right|Fig 4: Short-Term Earthquake Probability (STEP) Map for the 24hours after 11am PDT Oct 17th based using ANSS Catalog.]] | ||
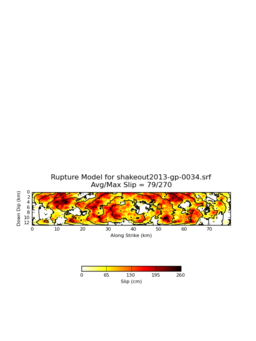
| + | [[File:Shakeout2013-gp-0034.png|256px|thumb|left|Fig 5: Slip Distribution and Rupture Progression produced by Rupture Generator for M6.85 event described in UseIT Intern Scenario, using input parameters that might be available within 15 minutes of a large event.]] | ||
| + | [[File:Bb mmi.png|256px|thumb|right|Fig 6: MMI map for event using Broadband Platform Peak Velocity and Acceleration converted to Instrumental Intensity using ShakeMap formula, based on a grid of approximately 468 stations with a 0.1 degree (approximately 11.1 km of latitude and 9.2 km of longitude) spacing between sites.]] | ||
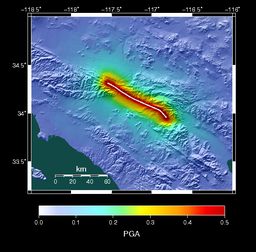
| + | [[File:San bern imr pga nga2008.png|256px|thumb|left|Fig 7: PGA map for event using NGA2008 attenuation relationship, based on a grid of approximately 11466 stations with a 0.02 degree (approximately 2.2 km of latitude and 1.9 km of longitude) spacing between sites.]] | ||
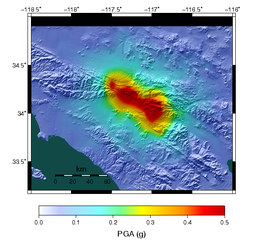
| + | [[File:Bb pga.png|256px|thumb|right|Fig 8: PGA map for event using Broadband Platform Peak Acceleration, based on a grid of approximately 468 stations with a 0.1 degree (approximately 11.1 km of latitude and 9.2 km of longitude) spacing between sites.]] | ||
Latest revision as of 16:44, 24 October 2013
SCEC's research computing group used the ShakeOut 2013 event to practice creating useful earthquake and seismic hazard information for the SCEC community immediately after a large California event. We identified a series of digital data products that we can calculate using the software and system tools at SCEC, and posted the results on a SCEC wiki a soon as the results were available. We used one of the Northridge Near You event definitions, a scenario earthquake description for a San Bernardino M6.85, as the earthquake information available to us after a big event.
Contents
ShakeOut Home Page
Northridge Near You Events
Data Product Requirements
Each Data Product must include:
- Hardcopy of data product in Intern Lab at SCEC
- Digital version of product (posted on wiki)
- Metadata file describing data product (posted on wiki)
Computational Data Product Targets
- MMI CyberShake map for event [ Fig. 2]
- Attenuation-relationship MMI ShakeMap (NRNY San Bernardino Event)
- Attenuation-relationship PGV ShakeMap (NRNY San Bernardino Event)
- Attenuation-relationship PGA ShakeMap (NRNY San Bernardino Event)
- SCEC-VDO 3D Aftershock visualization
- ShakeAlert Event Summary Test Result for Mainshock
- Short Term Earthquake Probability (STEP) Map for next 24 hours
- Shakecast RSS (Receive and Send)
- BBP Source Description in SRF Format
- BBP MMI ShakeMap (NRNY San Bernardino Event)
- BBP PGV ShakeMap (NRNY San Bernardino Event)
- BBP PGA ShakeMap (NRNY San Bernardino Event)
Results Available Within 8 Hours
- CyberShake Map of Peak Spectral Acceleration at 3.0 Seconds for Same Event in CyberShake Catalog with CyberShake 13.4 CVM-S amplitudes at 200+ sites in Region.
- Attenuation-relationship MMI ShakeMap (NRNY San Bernardino Event)
- Attenuation-relationship PGV ShakeMap (NRNY San Bernardino Event)
- Attenuation-relationship PGA ShakeMap (NRNY San Bernardino Event)
- SCEC-VDO 3D Aftershock visualization
- ShakeAlert Event Summary Test Result for Mainshock
- Short Term Earthquake Probability (STEP) Map for next 24 hours
- Shakecast RSS (Receive and Send)
- BBP Source Description in SRC Format and Plot
- BBP Source Description in SRF Format
- BBP MMI ShakeMap (NRNY San Bernardino Event)
- BBP PGV ShakeMap (NRNY San Bernardino Event)
- BBP PGA ShakeMap (NRNY San Bernardino Event)
