Difference between revisions of "Lin Thurber CVM"
| Line 1: | Line 1: | ||
= Overview = | = Overview = | ||
| − | The Lin Thurber et al (2010) CVM is a seismic velocity model of the California crust and uppermost mantle using a regional-scale double-difference tomography algorithm. The details are described in Lin et al. (2010). | + | The Lin Thurber et al (2010) CVM is a seismic velocity model of the California crust and uppermost mantle using a regional-scale double-difference tomography algorithm. The details are described in Lin et al. (2010). This model has been incorporated into the [[UCVM API]]. |
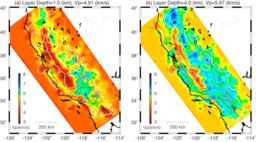
[[Image:MapviewP_statewide.png |256px|thumb|right|Map views of the P-wave velocity model at 1 and 4 km depth slices. Pink dots represent relocated earthquakes. Black lines denote coast line and lakes, gray lines rivers and surface traces of mapped faults. The white contours enclose the areas where the derivative weight sum is greater than 50 (Image Credit: Guoqing Lin]] | [[Image:MapviewP_statewide.png |256px|thumb|right|Map views of the P-wave velocity model at 1 and 4 km depth slices. Pink dots represent relocated earthquakes. Black lines denote coast line and lakes, gray lines rivers and surface traces of mapped faults. The white contours enclose the areas where the derivative weight sum is greater than 50 (Image Credit: Guoqing Lin]] | ||
= Model Description = | = Model Description = | ||
| + | |||
| + | Recently, we determined the seismic velocity model of the California crust and uppermost mantle using a regional-scale double-difference tomography algorithm. Our model is the first 3D seismic velocity model for the entire state of California based on local and regional arrival time data that has ever been developed. It has improved areal coverage compared to the previous northern and southern California models, and extends to greater depth due to the inclusion of substantial data at large epicentral distances. | ||
| + | |||
| + | *[http://www.rsmas.miami.edu/personal/glin/Statewide.html Lin Web Page With Original Model]. | ||
| + | |||
| + | |||
| + | == Projection == | ||
| + | |||
| + | The UCVM API implementation of Lin-Thurber uses a projection approximation that is the geographic bilinear interpolation of the four corners of the model. The four corners are: | ||
| + | |||
| + | <pre> | ||
| + | TBD | ||
| + | </pre> | ||
| + | |||
| + | The region is of size 1320 km x 600km. | ||
| + | |||
== Digital Elevation Model == | == Digital Elevation Model == | ||
| + | |||
| + | In order to query this model by depth, a state-wide DEM was constructed. The DEM is a 1320km x 600km grid with spacing of 1.0km. It was compiled by combining the NED 1 arcsec (DEM) and ETOPO2 2' (Bathymetric) datasets. The elevation at a particular lon,lat coordinate is computed by bilinear interpolation of the surrounding four points in the grid. | ||
| + | |||
== Vp Model == | == Vp Model == | ||
| − | The Vp model is a 1320km x 600km grid with spacing of 10.0km. The model is published as a space-delimited text file, available from [http://www.rsmas.miami.edu/personal/glin/Statewide_files/out.vp Vp Model]. | + | The Vp model is a 1320km x 600km x 46km grid with spacing of 10.0km along the x-y plane and variable spacing along the z axis. The z coordinate is measured as km offset from MSL, positive down. The z values contained in the model are: |
| + | <pre> | ||
| + | -1.0, 1.0, 4.0, 8.0, 14.0, 20.0, 27.0, 35.0, 46.0 | ||
| + | </pre> | ||
| + | |||
| + | The model is published as a space-delimited text file, available from [http://www.rsmas.miami.edu/personal/glin/Statewide_files/out.vp Vp Model]. The model file format is a table of data values in the following format: | ||
| + | <pre> | ||
| + | FILE FORMAT DESCRIPTION | ||
| + | -117.7230 37.8242 1.00 250.00 0.00 5.0390 109.13 | ||
| + | lon lat dep x y vp DWS (derivative weight sum) | ||
| + | </pre> | ||
| + | |||
| + | The UCVM API reads in this file directly without changes. | ||
| + | |||
| + | The Vp at a particular lon,lat coordinate is determined by trilinear interpolation of the surrounding 8 points. | ||
== Vs Model == | == Vs Model == | ||
| − | The | + | The Vs model is a 1320km x 600km grid with spacing of 30.0km along the x-y plane and the same z-axis organization as the Vp model. The model is published as a space-delimited text file, available from [http://www.rsmas.miami.edu/personal/glin/Statewide_files/out.vs Vs Model]. |
| + | |||
| + | The model file format is the same as Vp model. The UCVM API reads in this file directly without changes. | ||
| + | |||
| + | The Vs at a particular lon,lat coordinate is determined by trilinear interpolation of the surrounding 8 points. | ||
| Line 23: | Line 60: | ||
The original model does not provide density values. We adopt the Nafe-Drake scaling relationship to compute density from Vp (Ludwig et al., 1970; Brocher , 2005): | The original model does not provide density values. We adopt the Nafe-Drake scaling relationship to compute density from Vp (Ludwig et al., 1970; Brocher , 2005): | ||
<pre> | <pre> | ||
| − | rho = 1.6612*Vp - 0.4721*(Vp)^2 + 0.0671*(Vp)^3 - 0.0043*(Vp)^4 + 0.000106*(Vp)^5 | + | rho = 1.6612*Vp - 0.4721*(Vp)^2 + 0.0671*(Vp)^3 - 0.0043*(Vp)^4 + 0.000106*(Vp)^5 |
</pre> | </pre> | ||
| Line 39: | Line 76: | ||
As seen in the plots, the Vp model is higher resolution (~10km) than the Vs Model (~30km). | As seen in the plots, the Vp model is higher resolution (~10km) than the Vs Model (~30km). | ||
| − | |||
| − | |||
| − | |||
| − | |||
| − | |||
| − | |||
| − | |||
| − | |||
| − | |||
| − | |||
| − | |||
| − | |||
Revision as of 05:12, 9 April 2011
Contents
Overview
The Lin Thurber et al (2010) CVM is a seismic velocity model of the California crust and uppermost mantle using a regional-scale double-difference tomography algorithm. The details are described in Lin et al. (2010). This model has been incorporated into the UCVM API.

Model Description
Recently, we determined the seismic velocity model of the California crust and uppermost mantle using a regional-scale double-difference tomography algorithm. Our model is the first 3D seismic velocity model for the entire state of California based on local and regional arrival time data that has ever been developed. It has improved areal coverage compared to the previous northern and southern California models, and extends to greater depth due to the inclusion of substantial data at large epicentral distances.
Projection
The UCVM API implementation of Lin-Thurber uses a projection approximation that is the geographic bilinear interpolation of the four corners of the model. The four corners are:
TBD
The region is of size 1320 km x 600km.
Digital Elevation Model
In order to query this model by depth, a state-wide DEM was constructed. The DEM is a 1320km x 600km grid with spacing of 1.0km. It was compiled by combining the NED 1 arcsec (DEM) and ETOPO2 2' (Bathymetric) datasets. The elevation at a particular lon,lat coordinate is computed by bilinear interpolation of the surrounding four points in the grid.
Vp Model
The Vp model is a 1320km x 600km x 46km grid with spacing of 10.0km along the x-y plane and variable spacing along the z axis. The z coordinate is measured as km offset from MSL, positive down. The z values contained in the model are:
-1.0, 1.0, 4.0, 8.0, 14.0, 20.0, 27.0, 35.0, 46.0
The model is published as a space-delimited text file, available from Vp Model. The model file format is a table of data values in the following format:
 FILE  FORMAT DESCRIPTION
 -117.7230    37.8242     1.00     250.00       0.00     5.0390     109.13
 lon    lat  dep   x   y   vp   DWS (derivative weight sum)
The UCVM API reads in this file directly without changes.
The Vp at a particular lon,lat coordinate is determined by trilinear interpolation of the surrounding 8 points.
Vs Model
The Vs model is a 1320km x 600km grid with spacing of 30.0km along the x-y plane and the same z-axis organization as the Vp model. The model is published as a space-delimited text file, available from Vs Model.
The model file format is the same as Vp model. The UCVM API reads in this file directly without changes.
The Vs at a particular lon,lat coordinate is determined by trilinear interpolation of the surrounding 8 points.
Density Model
The original model does not provide density values. We adopt the Nafe-Drake scaling relationship to compute density from Vp (Ludwig et al., 1970; Brocher , 2005):
rho = 1.6612*Vp - 0.4721*(Vp)^2 + 0.0671*(Vp)^3 - 0.0043*(Vp)^4 + 0.000106*(Vp)^5
Images
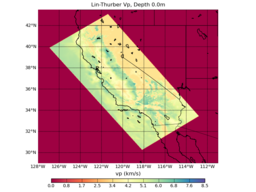
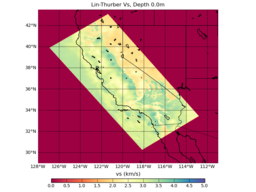
These preliminary maps are based on querying the model at an elevation offset of -1000.0m from MSL. We will need to add a DEM to UCVM in order to properly query this model by depth. The model is referenced using inverse bilinear interpolation of the original model boundaries.
As seen in the plots, the Vp model is higher resolution (~10km) than the Vs Model (~30km).
References
- Brocher, T. M. (2005), Empirical relations between elastic wavespeeds and density in the Earth's crust, Bull. Seis. Soc. Am., 95 (6), 2081-2092.
- Lin, G., C. H. Thurber, H. Zhang, E. Hauksson, P. Shearer, F. Waldhauser, T. M. Brocher, and J. Hardebeck (2010), A California statewide three-dimensional seismic velocity model from both absolute and differential Times, Bull. Seism. Soc. Am., 100, in press.
- Ludwig, W. J., J. E. Nafe, and C. L. Drake (1970), Seismic refraction, in New Concepts of Sea Floor Evolution, The Sea: Ideas and Observations on Progress in the Study of the Seas, vol. 4, edited by A. E. Maxwell, pp. 53-84, Wiley-Interscience, New York.

