Difference between revisions of "Low Frequency Site Response"
From SCECpedia
Jump to navigationJump to search| Line 12: | Line 12: | ||
| 295.7 | | 295.7 | ||
| 320.5 | | 320.5 | ||
| − | | [[File:USC_site_response_lf_v_bb.png|thumb| | + | | [[File:USC_site_response_lf_v_bb.png|thumb|500px]] |
|- | |- | ||
! PAS | ! PAS | ||
| Line 18: | Line 18: | ||
| 687.7 | | 687.7 | ||
| 709.1 | | 709.1 | ||
| − | | [[File:PAS_site_response_lf_v_bb.png|thumb| | + | | [[File:PAS_site_response_lf_v_bb.png|thumb|500px]] |
|- | |- | ||
! SBSM | ! SBSM | ||
| Line 24: | Line 24: | ||
| 255.9 | | 255.9 | ||
| 285.4 | | 285.4 | ||
| − | | [[File:SBSM_site_response_lf_v_bb.png|thumb| | + | | [[File:SBSM_site_response_lf_v_bb.png|thumb|500px]] |
|- | |- | ||
! WNGC | ! WNGC | ||
| Line 30: | Line 30: | ||
| 264.5 | | 264.5 | ||
| 290.7 | | 290.7 | ||
| − | | [[File:WNGC_site_response_lf_v_bb.png|thumb| | + | | [[File:WNGC_site_response_lf_v_bb.png|thumb|500px]] |
|- | |- | ||
! LBP | ! LBP | ||
| Line 36: | Line 36: | ||
| 209.5 | | 209.5 | ||
| 248.6 | | 248.6 | ||
| − | | [[File:LBP_site_response_lf_v_bb.png|thumb| | + | | [[File:LBP_site_response_lf_v_bb.png|thumb|500px]] |
|- | |- | ||
! LADT | ! LADT | ||
| Line 42: | Line 42: | ||
| 334.2 | | 334.2 | ||
| 340.8 | | 340.8 | ||
| − | | [[File:LADT_site_response_lf_v_bb.png|thumb| | + | | [[File:LADT_site_response_lf_v_bb.png|thumb|500px]] |
|- | |- | ||
! ALIS | ! ALIS | ||
| Line 48: | Line 48: | ||
| 649.7 | | 649.7 | ||
| 664.6 | | 664.6 | ||
| − | | [[File:ALIS_site_response_lf_v_bb.png|thumb| | + | | [[File:ALIS_site_response_lf_v_bb.png|thumb|500px]] |
|- | |- | ||
! LBUT | ! LBUT | ||
| Line 54: | Line 54: | ||
| 646.5 | | 646.5 | ||
| 661.7 | | 661.7 | ||
| − | | [[File:LBUT_site_response_lf_v_bb.png|thumb| | + | | [[File:LBUT_site_response_lf_v_bb.png|thumb|500px]] |
|- | |- | ||
! ALP | ! ALP | ||
| Line 60: | Line 60: | ||
| 325.5 | | 325.5 | ||
| 352.9 | | 352.9 | ||
| − | | [[File:ALP_site_response_lf_v_bb.png|thumb| | + | | [[File:ALP_site_response_lf_v_bb.png|thumb|500px]] |
|- | |- | ||
! PDE | ! PDE | ||
| Line 66: | Line 66: | ||
| 333.9 | | 333.9 | ||
| 354.8 | | 354.8 | ||
| − | | [[File:PDE_site_response_lf_v_bb.png|thumb| | + | | [[File:PDE_site_response_lf_v_bb.png|thumb|500px]] |
|- | |- | ||
! SMCA | ! SMCA | ||
| Line 72: | Line 72: | ||
| 319.2 | | 319.2 | ||
| 332.0 | | 332.0 | ||
| − | | [[File:SMCA_site_response_lf_v_bb.png|thumb| | + | | [[File:SMCA_site_response_lf_v_bb.png|thumb|500px]] |
|} | |} | ||
Revision as of 17:16, 28 February 2024
This page documents our analysis of the impact of the low frequency site response, as applied to deterministic seismograms as part of the broadband simulation process.
Study 22.12 comparisons
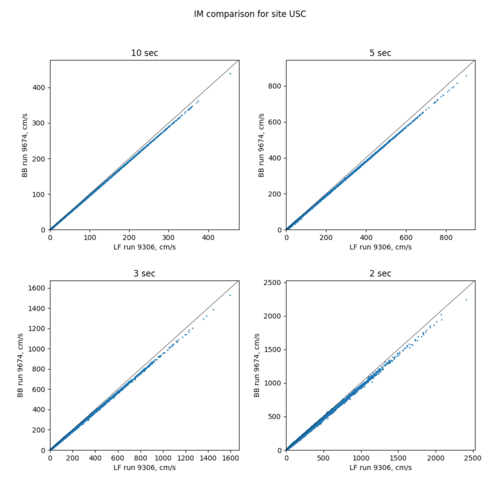
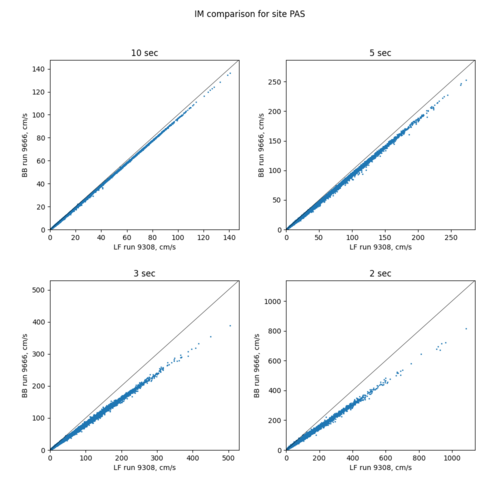
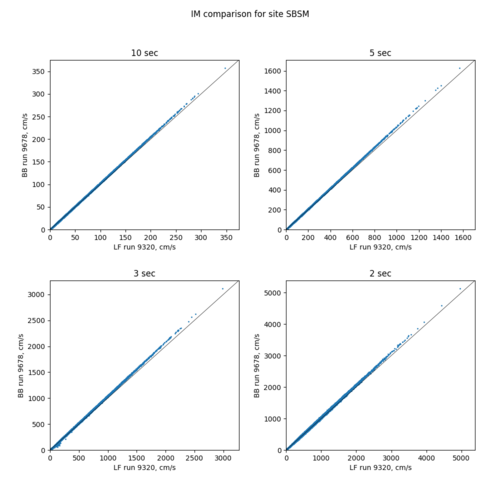
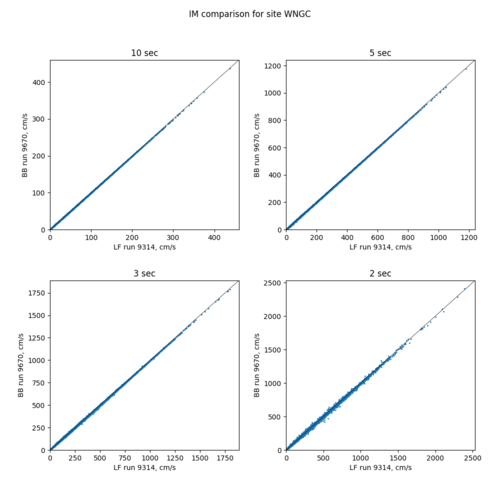
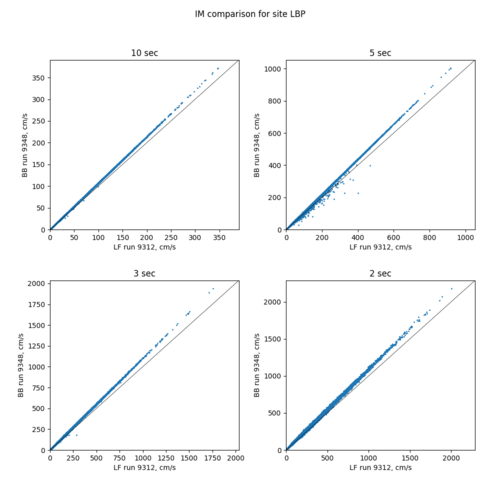
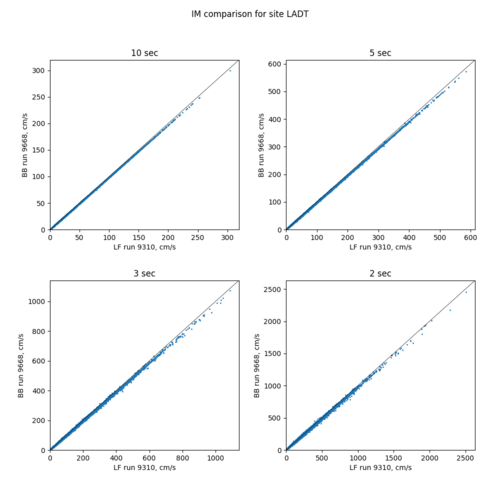
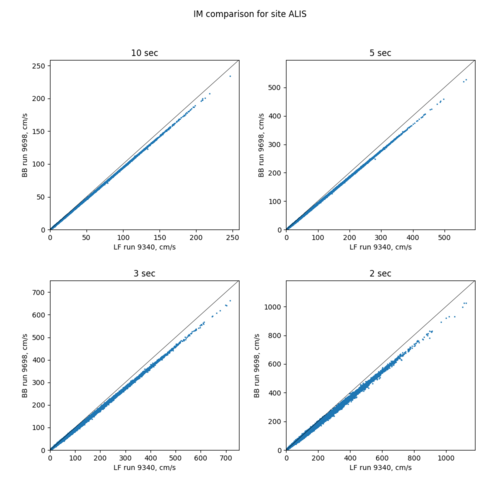
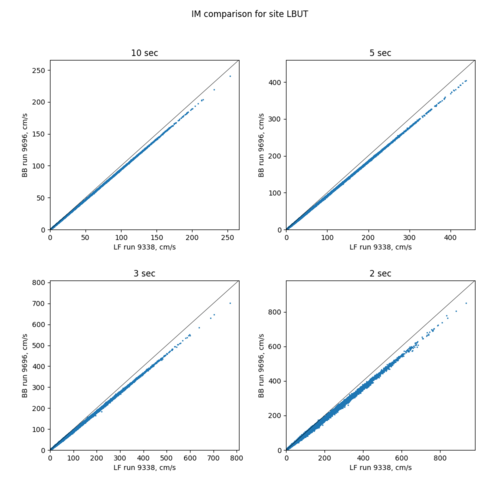
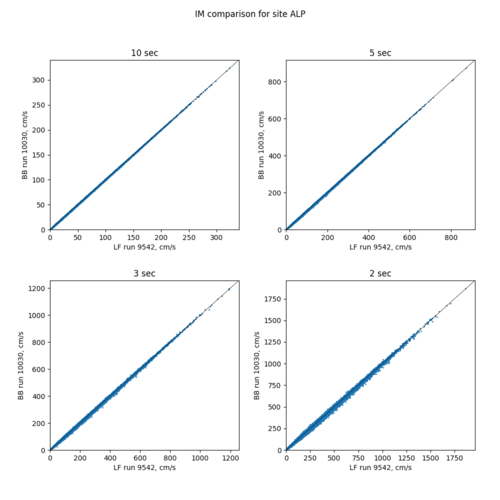
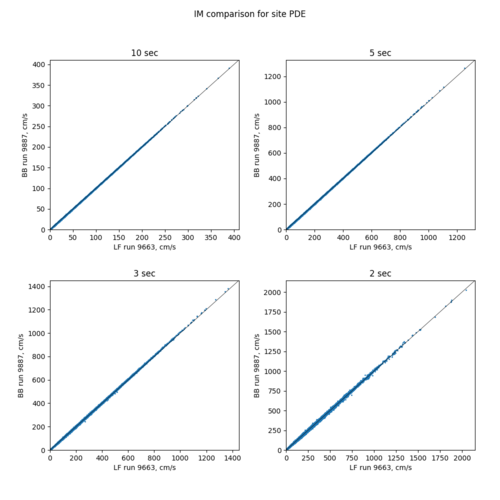
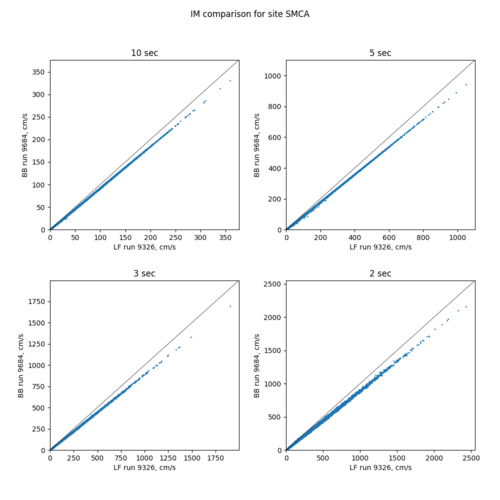
Below are scatterplots comparing Study 22.12 low-frequency and Study 22.12 broadband results, at periods of 2-10 sec. Since the Study 22.12 LF results don't include site response and the broadband results do, this provides a way for us to examine the impact of the site response.
| Site | Thompson Vs30 | CVM-S4.26.M01 + taper Vs30 | Vref | Scatterplot |
|---|---|---|---|---|
| USC | 336.4 | 295.7 | 320.5 | |
| PAS | 907.6 | 687.7 | 709.1 | |
| SBSM | 274.5 | 255.9 | 285.4 | |
| WNGC | 292.5 | 264.5 | 290.7 | |
| LBP | 226.2 | 209.5 | 248.6 | |
| LADT | 349.0 | 334.2 | 340.8 | |
| ALIS | 720.7 | 649.7 | 664.6 | |
| LBUT | 719.7 | 646.5 | 661.7 | |
| ALP | 351.9 | 325.5 | 352.9 | |
| PDE | 351.8 | 333.9 | 354.8 | |
| SMCA | 372.0 | 319.2 | 332.0 |
