Difference between revisions of "CyberShake interpolation"
From SCECpedia
Jump to navigationJump to search| Line 9: | Line 9: | ||
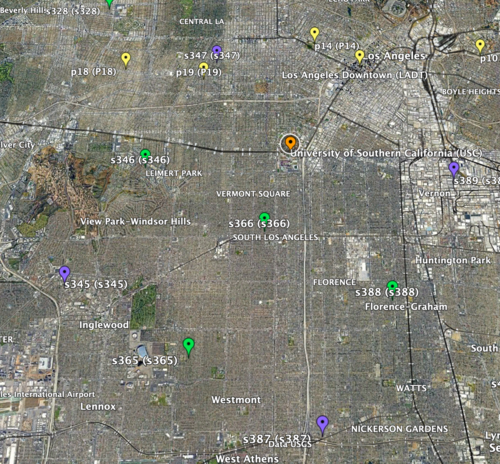
** 1st chosen area: USC as there are three sites on the exterior for 1D linear interpolation and two sites on the interior for 2D linear interpolation | ** 1st chosen area: USC as there are three sites on the exterior for 1D linear interpolation and two sites on the interior for 2D linear interpolation | ||
| − | **[[File:USCarea.png| | + | **[[File:USCarea.png|500px|Square formed by sites S345, S387, S389, S347]] |
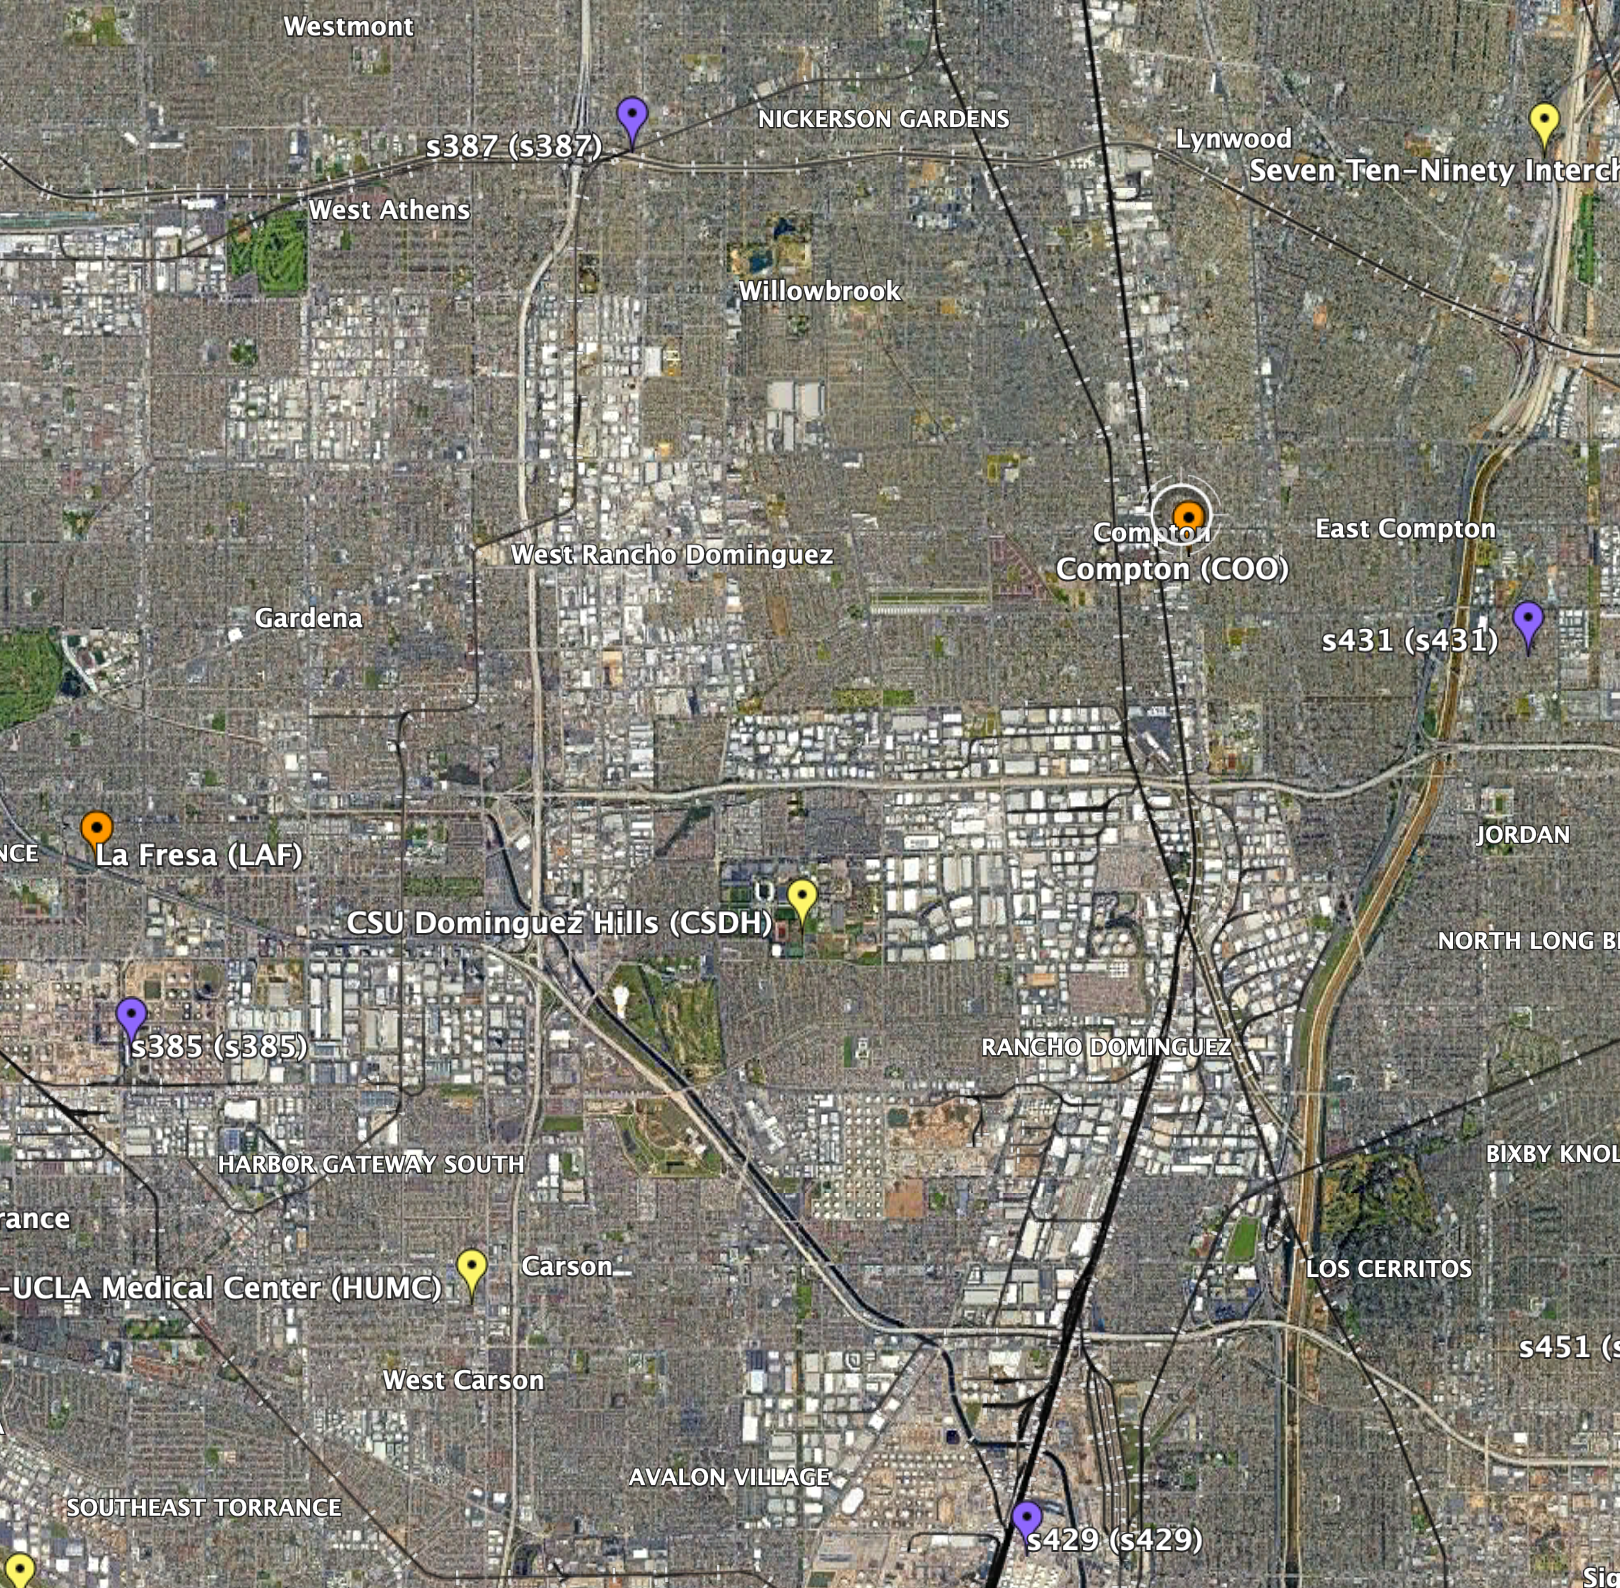
**2nd chosen area: CSDH | **2nd chosen area: CSDH | ||
Revision as of 18:15, 21 June 2024
This page documents research into techniques for interpolating various CyberShake data products, performed by 2024 SOURCES intern Amelia Kratzer.
Contents
Hazard Curves
Procedure
Selection of Sites
- To start, I selected 4 sites, all in the basin, that formed a 10km by 10km square inside which there was at least 1 site to interpolate. This way I could compare the simulated values for that site to the interpolated to check the accuracy of my interpolation.
- 1st chosen area: USC as there are three sites on the exterior for 1D linear interpolation and two sites on the interior for 2D linear interpolation
- 2nd chosen area: CSDH
- Next, I selected two locations where some of the sites were not in the basin, to test how different velocity structures may affect the accuracy of the interpolation.
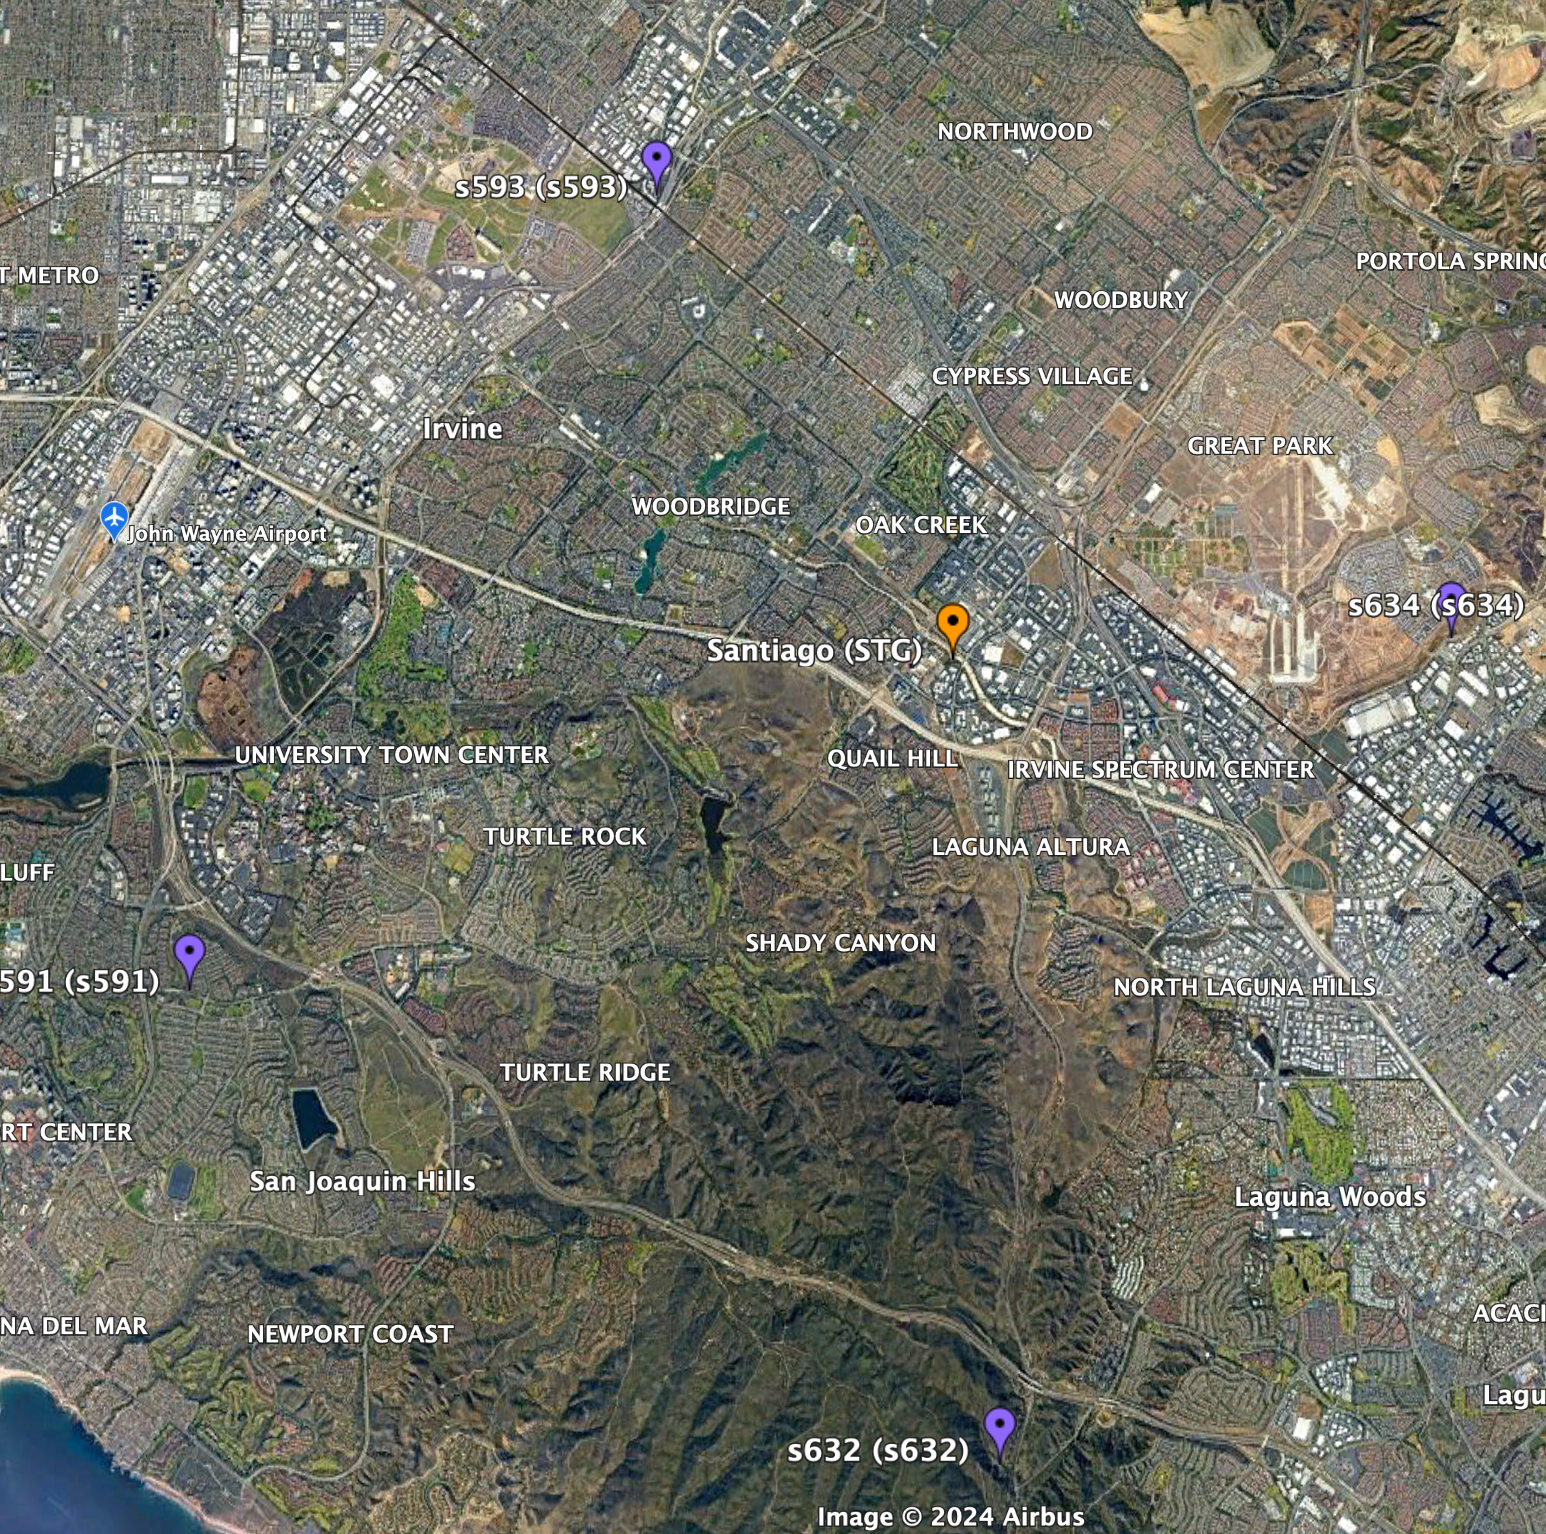
- 1st location: STG
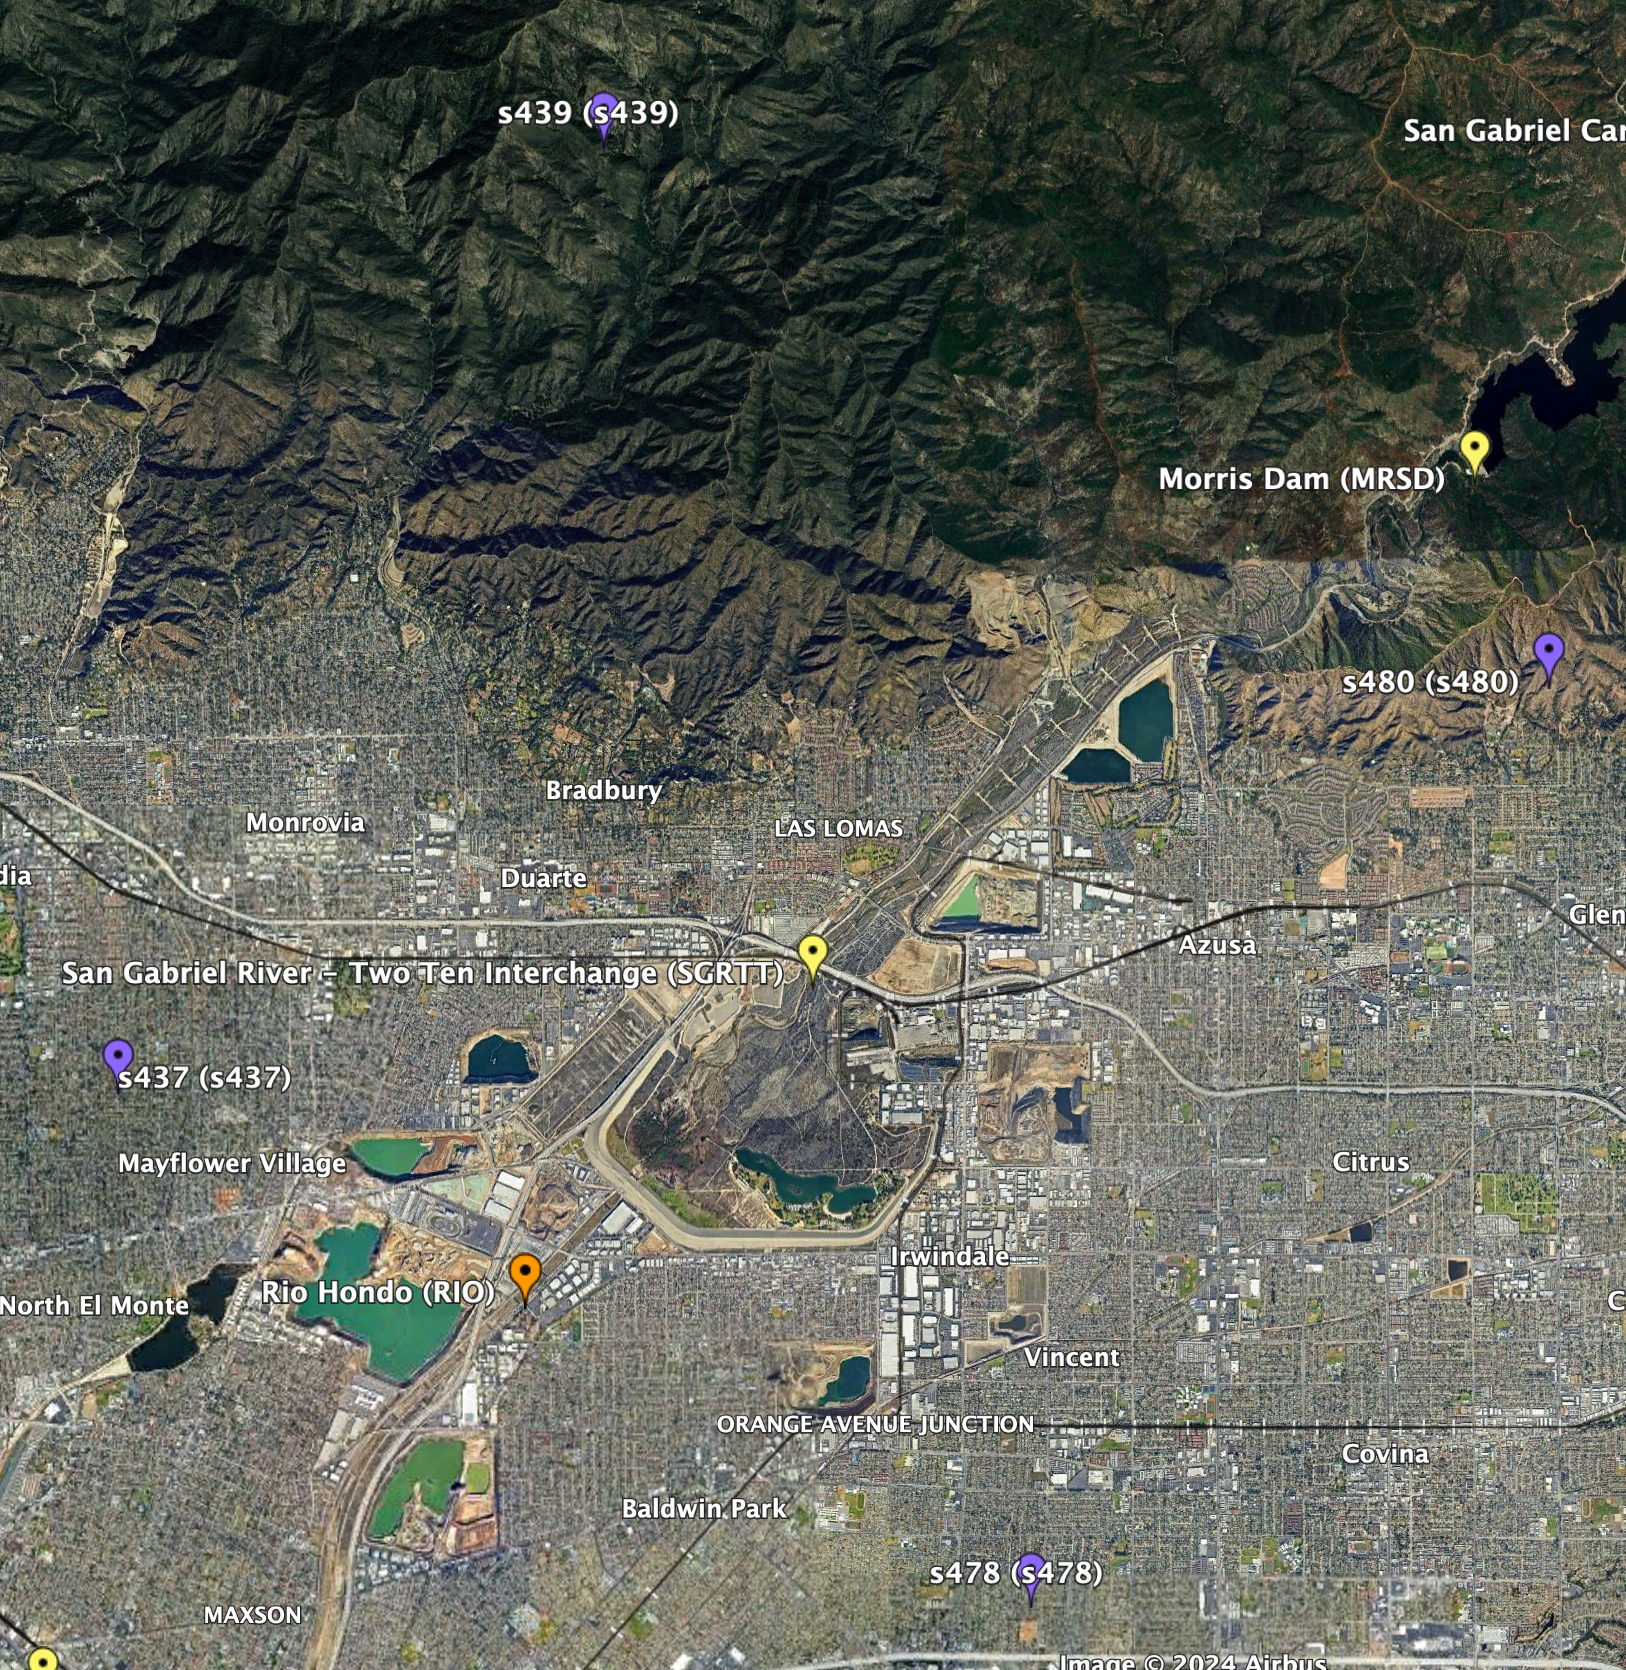
- 2nd location: SGRTT
Linear Interpolation Of Hazard Curves
- Download and


