Difference between revisions of "CTC Results"
| Line 14: | Line 14: | ||
#Location Error - Shows delta between final observed location and forecast location (in km). Uses difference between epicenter locations (rather than hypocenter locations). | #Location Error - Shows delta between final observed location and forecast location (in km). Uses difference between epicenter locations (rather than hypocenter locations). | ||
#Magnitude Error - Shows delta Observed - Forecast final magnitude. Values above zero show over underestimated magnitudes. Negative values show overestimated magnitudes | #Magnitude Error - Shows delta Observed - Forecast final magnitude. Values above zero show over underestimated magnitudes. Negative values show overestimated magnitudes | ||
| + | #Magnitude Distribution - Shows x-y plot with observed mag on x and forecast mag on y. Accurate forecasts will fall on a diagonal line. | ||
ANSS summaries are produced for historical time frames. For example, cumulative summaries are available showing events over last one month, two months,four months, and six months. Maps of these event catalogs are posted here: | ANSS summaries are produced for historical time frames. For example, cumulative summaries are available showing events over last one month, two months,four months, and six months. Maps of these event catalogs are posted here: | ||
Revision as of 00:06, 8 February 2012
The CISN Testing Center (CTC) consists of scientific analysis software, CISN EEW algorithm performance reports, and earthquake observational data. This entry is a collection point for current and past results from the CTC testing center.
Contents
Type of ShakeAlert Performance Summaries
We current support four event oriented summaries, and four cumulative summaries.
Cumulative Summaries
- Speed Test - Shows time system took to produce a warning. Does not include distribution time from ShakeAlert to users. (Time decision Module has event forecast - event origin time)
- Location Error - Shows delta between final observed location and forecast location (in km). Uses difference between epicenter locations (rather than hypocenter locations).
- Magnitude Error - Shows delta Observed - Forecast final magnitude. Values above zero show over underestimated magnitudes. Negative values show overestimated magnitudes
- Magnitude Distribution - Shows x-y plot with observed mag on x and forecast mag on y. Accurate forecasts will fall on a diagonal line.
ANSS summaries are produced for historical time frames. For example, cumulative summaries are available showing events over last one month, two months,four months, and six months. Maps of these event catalogs are posted here:
Event Summaries
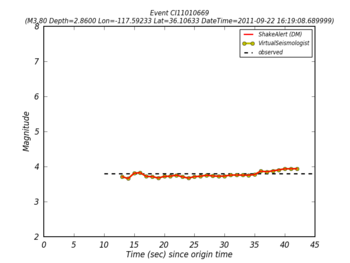
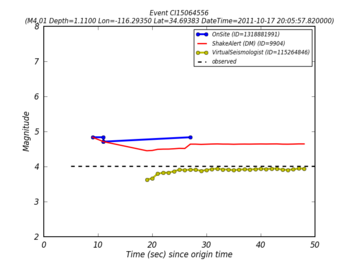
- Magnitude Forecast Time series - These present the performance of both the algorithms (Elarms, Virtual Seismologist, and OnSite) as well as the ShakeAlert Decision Modules.
Cumulative Summaries
The cumulative summaries are based on a "selected" start date (current selected at 1 Sept 2011), through current date. The CTC retrieves all events in this time range from ANSS, then filters them in two ways. First, it removes all events less than M3.5. Second, it removes all events outside of the California CSEP Testing area. This is an area the includes all of California, and a little room on each edge including Nevada, Mexico, and the Pacific ocean.
The input catalog (that is all events in ANSS catalog), and the filtered catalog, are available
- ANSS Raw Event Catalog (scec.eew.Catalog.EEWANSSOneDay-EEWANSSCatalog.dat.1328657526.726369.1)
- ShakeAlert Filtered Event Catalog (EEWANSSCatalog.dat.Magnitude3.5)
Daily Event Processing
The automated nightly evaluation results are posted at the following location.
CTC ShakeAlert Testing
As of September 2011, CISN Testing Center (CTC) processing now evaluates performance of the prototype CISN ShakeAlert EEW system. CTC evaluations are now based on earthquake parameter forecasts as logged by the CISN ShakeAlert system at U.C. Berkeley.
This testing include inputs from three algorithms (UCB Elarms, ETH Virtual Seismologist, and Caltech Onsite) as well as processing outputs from the ShakeAlert Decision Module.
The CTC automated testing center uses the following processing steps in its evaluation:
- Evaluations are run once per day.
- In order to let evaluation EEW alerts against "final" "stable" earthquake parameters, evaluations are delay for two days. That is on Tuesday, evaluations are done for the previous Sunday.
- Evaluation processing retrieves observed earthquake information from the ANSS catalog.
- ANSS catalog entries are filtered and earthquake below Mag 2.5 or outside the state of California are discarded.
- Evaluation processing retrieves ShakeAlert log files from operational server at UCB.
- For each ANSS earthquake, we look for one or more ShakeAlert triggers with origin time within 45 seconds of the observed earthquake.
- Plots are produced showing final (observed, ANSS) magnitude as compared to algorithm alerts from VS, OnSite, and ElarmS and Decision Module alerts (as sent to users).
The automated nightly evaluation results are posted at the following location.
CTC Interactive Performance Summaries
Prior to September 2011, CTC testing center produced interactive test results for individual EEW algorithms. These results lack information about the integrated ShakeAlert system. The most recent CTC development, described above, now include evaluation information about both individual algorithms as well as overall ShakeAlert performance. The interactive CTC performance summaries produced in the past are posted below, but this software is no longer under active development.
Interactive performance summaries are produced with a specific version of the CTC software in order to manage changes and improvements to the CTC processing software. These performance summaries are cumulative, with later summaries containing more events. Interactive results are reproducible by scientists as both the input EEW performance reports, and processing source code, are available from the CTC testing center.


