Difference between revisions of "UCVM Visualization"
| Line 136: | Line 136: | ||
It should look like this: | It should look like this: | ||
| − | [[ | + | [[image:example_cvms_map_depth0.png]] |
Revision as of 19:25, 23 February 2012
Contents
Overview
The UCVM Visualization software is a set of Python scripts for producing 2D plots from one or more community velocity models or a 3D mesh. The following plots are supported:
- Map views for a lon-lat box
- Cross-section views between to lon-lat endpoints
- Difference plots for both maps and cross-sections
- Histogram plots of differences
The following mesh types are supported:
- AWP 3, 5, and 8 value
- SORD
- RWG (CyberShake format)
Requirements
- UCVM with one or more velocity models installed
- Python 2.6.2+, with the modules: numpy, matplotlib, basemap
Configuration
Edit the paths in ./src/Params.py so that the scripts can find your UCVM installation:
# UCVM Config
UCVM_DIR = '/home/scec-00/patrices/opt/aftershock/ucvm-12.2.0/bin'
UCVM_CONF = '/home/scec-00/patrices/opt/aftershock/ucvm-12.2.0/conf/ucvm.conf'
UCVM_SCRIPT = 'run_ucvm.sh'
#UCVM_MAP = 'yong'
UCVM_MAP = 'ucvm'

# GRD Config
GRD_DIR = '/home/scec-00/patrices/opt/aftershock/ucvm-12.2.0/bin'
GRD_NED_DIR = '/home/scec-00/patrices/opt/ned'
GRD_BATH_DIR = '/home/scec-00/patrices/opt/bath'
GRD_HR_VS30_DIR = '/home/scec-00/patrices/opt/vs30/wills_gridfloat'
GRD_LR_VS30_DIR = '/home/scec-00/patrices/opt/vs30/wald_gridfloat'
GRD_SCRIPT = 'run_grd.sh'
The lines to change at a minimum are UCVM_DIR and UCVM_CONF. UCVM_SCRIPT should reference the standard run_ucvm.sh script included in UCVM. UCVM_MAP allows you to specify an alternate Vs30/elevation map.
The GRD configuration is necessary only if you want to plot Vs30 or elevation data from ArcGIS GridFloat formatted grid files. The meaning of each config line is:
- GRD_NED_DIR specifies the directory containing that National Elevation Dataset grid files (GridFloat format).
- GRD_MATH_DIR specifies the directory containing bathymetry information (GridFloat format).
- GRD_HR_VS30_DIR specifies the directory containing the high-rez (preferred) Vs30 data
- GRD_LR_VS30_DIR contains the low-rez data
Using the Software
The UCVM Visualization package splits the plotting process into three steps:
- Extract data slice from a CVM or mesh
- (Optional) Difference one or more previously extracted datasets to produce a new dataset
- Visualize the slice
Data Extraction
The data extraction step pulls a slice of information from a CVM or mesh and saves it in a text file. This text file is space-delimited with a commented metadata section as a header. The format is Matlab friendly.
- CrossSectionCVM.py: Extracts cross-section from one or more CVMs
- CrossSectionMesh.py: Extracts cross-section from a 3D mesh
- MapCVM.py: Extracts map view at specified depth from one or more CVMs
- MapDEM.py: Extracts map view of DEM from NED data
- MapMesh.py: Extracts map view at specified depth from a mesh
- MapVs30.py: Extracts map view of Vs30 from a UCVM 2D map
- ProfileCVM.py: Extracts velocity profile at specific lon-lat point
- Vs30MapCVM.py: Computes Vs30 map from one or more CVMs (note that this is not the same as MapVs30.py)
- ZMapCVM.py: Compute Z map for desired Vs threshold
Differencing
- DiffData.py: Perform operation between two datasets with the same datatype and format (typically difference). The output dataset will be of the same format as the two inputs.
Plotting
The following scripts accept a previously extracted data set and plot it with Python matplotlib. It is important to use the correct plotting script for the dataset that you want to visualize. For example, a Map view extracted from a CVM with MapCVM.py must be plotted with PlotMapCVM.py. The naming is consistent so that any dataset produced with <extractor>.py can be plotted with Plot<extractor>.py.
- PlotCrossSectionCVM.py
- PlotCrossSectionMesh.py
- PlotMapCVM.py
- PlotMapDEM.py
- PlotMapMesh.py
- PlotMapVs30.py
- PlotProfileCVM.py
- PlotVs30MapCVM.py
- PlotZMapCVM.py
Difference data sets are a special case. They represent a combination of two input data sets, but they still retain their plot type identity. For example, a difference of two map view datasets is also a map view dataset. The following plotters are available:
- PlotCrossSectionDiff.py: Plot a cross-section difference data set generated by DiffData.py.
- PlotHistDiff.py: Plot histogram of any difference data set, filtered to include only data points that fall within a bounding box (lat_0,lon_0,xsize_m,ysize_m,rot_angle).
- PlotMapDiff.py: Plot a map difference data set generated by DiffData.py.
Various customizations are allowed depending on the plot type:
- Choice of value from the dataset to plot (generally vp, vs, or rho)
- Color scale type (ie: Spectral), minimum/maximum values, and discrete intervals versus continuous
- Map view scripts support optional polygon overlays
- Cross-section scripts support optional region context bounding box
Helper Utilities
- BatchPlot.py: Creates a set of standard cross-sections and map views for a SoCal model
Examples
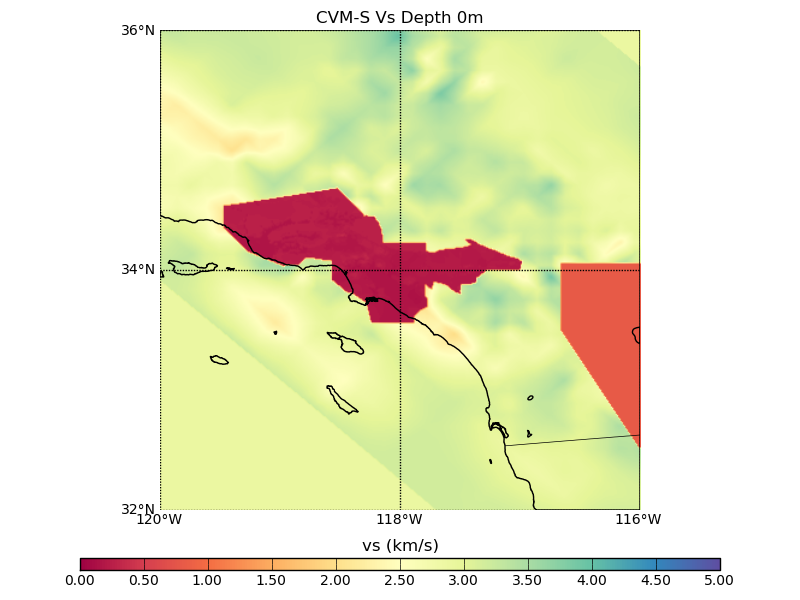
Map Plot of Vs at Depth 0m from CVM-S
To generate this plot, execute the following commands:
$ ./MapCVM.py cvms -120.0 32.0 -116.0 36.0 0 0.01 test_cvms.data
$ ./PlotMapCVM.py test_cvms.png vs test_cvms.data "CVM-S Vs Depth 0m"
To view it with ImageMagick, type:
$ display test_cvms.png
It should look like this:
