Difference between revisions of "Earthquake Early Warning"
From SCECpedia
Jump to navigationJump to search| Line 73: | Line 73: | ||
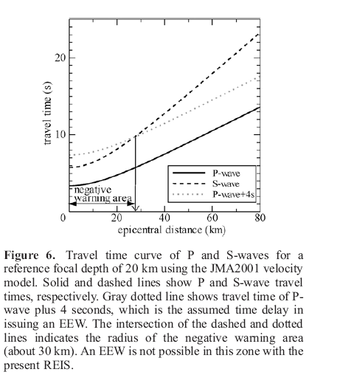
== Earthquake Wave Travel Time Curves == | == Earthquake Wave Travel Time Curves == | ||
[[File:Define_Reference_Events.png|340px|thumb|right|Fig 5: Travel time curves show region for which no warnings are possible because of travel time and processing delays.]] | [[File:Define_Reference_Events.png|340px|thumb|right|Fig 5: Travel time curves show region for which no warnings are possible because of travel time and processing delays.]] | ||
| + | |||
| + | |||
| + | == Ground Motion Intensity Scale == | ||
| + | [[File:shakemap_color_scale.png|340px|thumb|right|Fig 6: ShakeMap color scale shows instrumental intensity estimates or observations.]] | ||
== Additional ShakeAlert Information == | == Additional ShakeAlert Information == | ||
Revision as of 00:34, 12 October 2010
Contents
- 1 SCEC Earthquake Early Warning Activities
- 2 CISN ShakeAlert System
- 3 CISN EEW Testing System Development
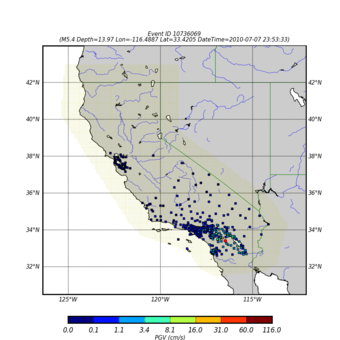
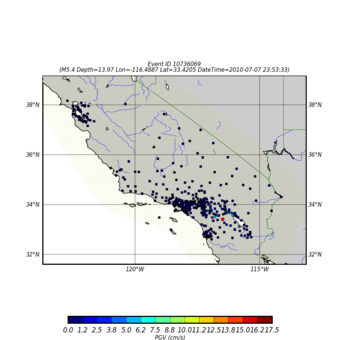
- 4 Example Observations from ShakeMap RSS for Event (M5.0 )
- 5 Authorized Data Source
- 6 Test Event List 2010
- 7 Earthquake Wave Travel Time Curves
- 8 Ground Motion Intensity Scale
- 9 Additional ShakeAlert Information
SCEC Earthquake Early Warning Activities
SCEC4 science plans emphasize the development and use of time-dependent seismic hazard analysis. SCEC is working to extend time-dependent seismic hazard analysis through application of EEW technologies.
CISN ShakeAlert System
SCEC is working with the California Integrated Seismic Network (CISN) in the development and evaluation of a prototype CISN EEW system.
CISN EEW Testing System Development
SCEC is working to developed automated CISN EEW performance evaluation system. This system, currently called the CISN Testing Center (CTC), is based on the testing framework developed on the SCEC CSEP project.
Example Observations from ShakeMap RSS for Event (M5.0 )
Authorized Data Source
The ShakeMap authorized data source may provide the observational data used to validate short term ground motion forecasts.
Test Event List 2010
   * catalog=ANSS
   * start_time=2010/06/01,00:00:00
   * end_time=2010/11/01,00:00:00
   * minimum_latitude=32.00
   * maximum_latitude=42.00
   * minimum_longitude=-122.00
   * maximum_longitude=-114.00
   * minimum_magnitude=4.0
   * maximum_magnitude=10
   * event_type=E
Date       Time             Lat       Lon  Depth   Mag Magt  Nst Gap  Clo  RMS  SRC   Event ID
----------------------------------------------------------------------------------------------
2010/06/02 16:07:48.08  32.0560 -115.1967  10.00  4.30   ML   12          0.22  CI      14732212
2010/06/03 18:10:04.03  32.6952 -115.9142   5.11  4.10   ML   43          0.23  CI      14733516
2010/06/10 22:07:12.97  32.0305 -115.1072  10.00  4.14   ML    7          0.28  CI      10699845
2010/06/11 20:51:11.69  32.3900 -115.1818  15.00  4.26   ML   17          0.29  CI      10700429
2010/06/12 15:29:25.45  37.4527 -117.5194   5.87  4.54   ML   25  96   53 0.14  NN        312414
2010/06/13 03:08:57.09  33.3833 -116.4158  12.48  4.90   ML  125          0.26  CI      10701405
2010/06/13 03:09:20.36  33.3920 -116.3947   5.57  4.23   ML   44          0.32  CI      10701413
2010/06/14 07:02:26.97  32.1803 -115.3155  10.00  4.69   ML   11          0.20  CI      10703133
2010/06/15 04:26:58.48  32.7002 -115.9213   5.41  5.72   Mw   52          0.28  CI      14745580
2010/06/15 04:36:07.63  32.6792 -115.9242  12.48  4.11   ML   49          0.37  CI      14745636
2010/06/15 04:59:45.53  32.6995 -115.9500  10.69  4.61   ML   71          0.33  CI      14745932
2010/06/15 05:34:16.83  32.7088 -115.9563   5.52  4.35   ML   68          0.28  CI      14746172
2010/06/15 08:14:47.02  32.6880 -115.9108   3.77  4.15   ML   67          0.30  CI      14747396
2010/06/17 09:05:38.19  32.0748 -115.0040  10.00  4.13   ML    9          0.40  CI      10160722
2010/06/25 06:37:52.80  32.6188 -115.7947   6.44  4.17   ML   50          0.31  CI      10724149
2010/07/06 16:38:05.23  32.2180 -115.3462   1.51  4.27   ML   16          0.23  CI      14776012
2010/07/07 23:53:33.53  33.4205 -116.4887  13.97  5.43   Mw  144          0.27  CI      10736069
2010/07/20 21:48:29.98  40.0764 -119.6219  11.75  4.22   ML   33 245   23 0.10  NN        314044
2010/07/30 11:13:46.81  38.6220 -118.2116  11.14  4.24   ML   19 189   27 0.11  NN        314505
2010/08/06 17:39:31.67  33.9790 -116.4432   7.66  4.05   ML  122          0.18  CI      10771621
2010/08/24 21:43:39.96  32.3633 -115.4110  10.00  4.22   ML   21          0.30  CI      10785477
2010/08/29 15:53:43.42  32.1803 -115.2930  10.00  4.28   ML   15          0.22  CI      10788765
2010/09/14 10:52:18.00  32.0485 -115.1982  10.00  4.96   Mw   14          0.21  CI      10798005
2010/09/15 06:09:53.38  32.1647 -115.2467  13.79  4.79   ML   12          0.20  CI      10798845
2010/09/20 00:30:02.40  32.0262 -115.1083  10.00  4.75   Mw    9          0.22  CI      14844244
2010/09/30 08:37:35.93  37.1385 -117.3803   8.47  4.42   ML   24 144   21 0.23  NN        317359
2010/10/05 21:22:46.52  37.1526 -117.3758   9.21  4.14   ML   13 164   19 0.12  NN        318065
Earthquake Wave Travel Time Curves


