Difference between revisions of "Moved:SCEC UGMS Committee Meeting 6"
From SCECpedia
Jump to navigationJump to search (→Agenda) |
|||
| Line 25: | Line 25: | ||
|-valign="top" | |-valign="top" | ||
| 10:30 | | 10:30 | ||
| − | | [http://hypocenter.usc.edu/research/5_16_UGMS_Meeting/1030_Callaghan_CyberShake_review.pdf Review of Revised Risk-Targeted Maximum Considered Earthquake Response Spectra (MCE<sub>R</sub>) at 50 Additional Southern California Sites (T = 2 – 10 sec) | + | | [http://hypocenter.usc.edu/research/5_16_UGMS_Meeting/1030_Callaghan_CyberShake_review.pdf Review of Revised Risk-Targeted Maximum Considered Earthquake Response Spectra (MCE<sub>R</sub>) at 50 Additional Southern California Sites (T = 2 – 10 sec) ] |
| − | | K. Milner / S. Callaghan | + | | K. Milner / S. Callaghan |
|-valign="top" | |-valign="top" | ||
| 11:30 | | 11:30 | ||
Revision as of 19:45, 13 May 2016
- SCEC Committee for Utilization of Ground Motion Simulations Meeting 6
- Organizers: C.B. Crouse (AECOM) and Tom Jordan (SCEC/USC)
- Date: Monday, May 16, 2016 (10:00-15:00)
- Location: SCEC Board Room (ZHS 167), USC, Los Angeles, CA
- Participants: TBD (by invitation only)
Contents
Agenda
Presentation slides may be downloaded by clicking each title. PLEASE NOTE: Slides are the author's property. They may contain unpublished or preliminary information and should only be used while viewing the talk.
| 10:00 | Welcome, Attendee Introductions, and Agenda Review | C.B. Crouse |
| 10:15 | Review of Results from November 2015 Meeting | C.B. Crouse |
| 10:30 | Review of Revised Risk-Targeted Maximum Considered Earthquake Response Spectra (MCER) at 50 Additional Southern California Sites (T = 2 – 10 sec) | K. Milner / S. Callaghan |
| 11:30 | Review of Hazard and MCER Deaggregation Results and Representative Simulated Seismograms from CyberShake at Selected Sites | K. Milner / S. Callaghan |
| 12:00 | Lunch | |
| 13:00 | Results of Revision to Site-Response Analysis at Carson Site (s429) | D. Asimaki |
| 13:15 | Proposal to Construct MCER Response Spectra and Review of Resulting MCER at 64 (14 original + 50 new) Southern California Sites | C.B. Crouse |
| 14:00 | Approach to Develop MCER for Arbitrary Vs30 (for use as input/outcrop motion for optional site-response analyses) | C.B. Crouse / M. Hudson |
| 14:15 | Development of MCER Look-Up Tool (Plan, Contents, & Schedule) | C. Goulet / C.B. Crouse |
| 14:30 | Promotion of MCER Maps for L.A. Region as Possible Supplement to ASCE 7-16 for City of L.A. (Logistics & Approach) Results to be Presented & Tentative Dates for Next UGMS Meeting | B. Bachman / F. Naeim |
| 14:45 | CyberShake Validation Efforts (Goulet) | C. Goulet |
| 15:00 | Action Items for Next UGMS Meeting (Crouse) | C.B. Crouse |
| 15:15 | Adjourn |
Participants
| Member Attendees (in person) C.B. Crouse - chair Bob Bachman Jacobo Bielak Christine Goulet Rob Graves** John Hooper Marty Hudson Charlie Kircher Nico Luco Paul Somerville** Farzad Naeim **unconfirmed |
Member Attendees (remotely) John Anderson Jack Baker Art Frankel Curt Haselton |
Members Absent Norm Abrahamson |
Observers Brad Aagaard Domniki Asimaki Annemarie Baltay Nenad Bijelic Scott Callaghan Victor Cuevas Greg eierlein Christine Goulet Tran Huynh Tom Jordan Ting Lin Phil Maechling Kevin Milner Morgan Moschetti Kim Olsen Sanaz Rezaeian Andreas Skarlatoudis Ricardo Taborda |
UGMS Selected Study Sites
Download a preliminary site list with Vs30 and basin depth information. Note that CyberShake applies a minimum Vs floor of 500 m/s.
Sample CyberShake Time Series
We have extracted timeseries data for the following 4 events:
- Southern San Andreas, nucleating near Bombay Beach (33.3772, -115.74, 4.1514 km deep): source 59, rupture 3, rupture variation 0.
Plots available here. - Southern San Andreas, nucleating near the Carrizo Plain (35.2809, -119.8182, 12.3263 km deep): source 59, rupture 3, rupture variation 296.
Plots available here. - Southern San Andreas, nucleating near the Cajon Pass (34.3123, -117.5051, 20.3019 km deep): source 59, rupture 3, rupture variation 144.
Plots available here. - Puente Hills (34.0811, -118.0461, 12.4803 km deep): source 242, rupture 26, rupture variation 31.
Plots available here.
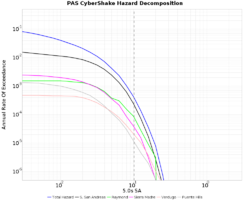
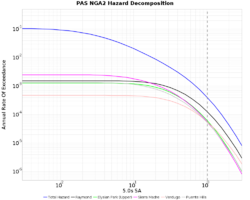
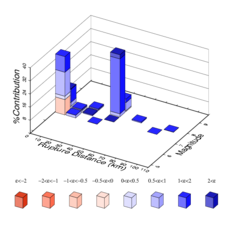
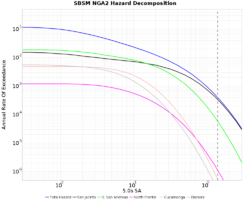
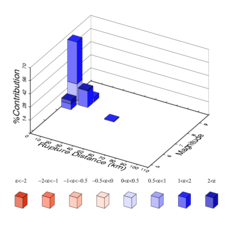
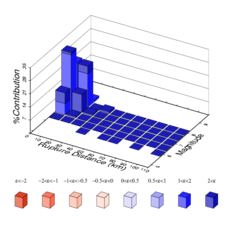
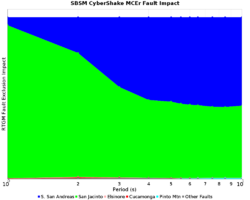
Sample Hazard and Disaggregation Plots
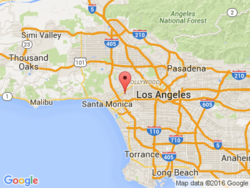
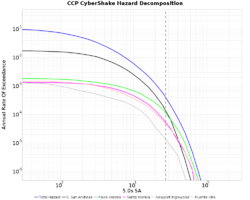
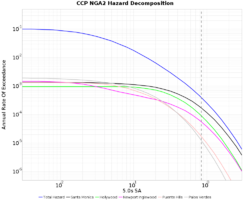
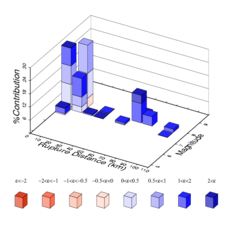
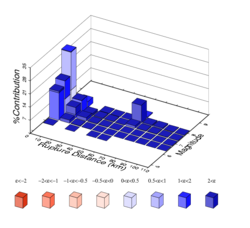
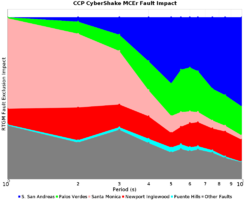
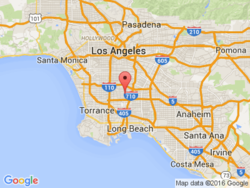
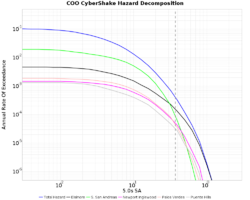
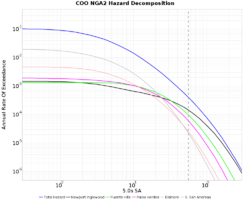
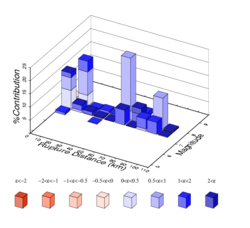
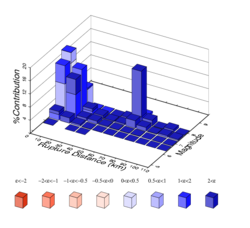
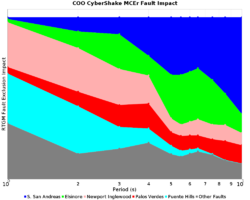
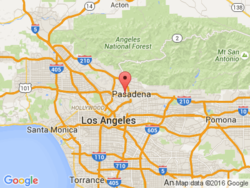
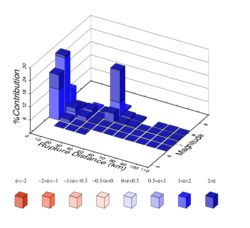
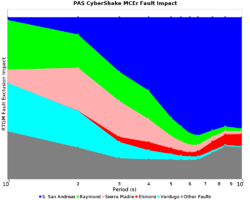
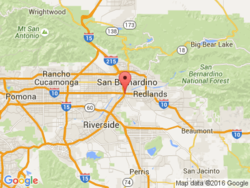
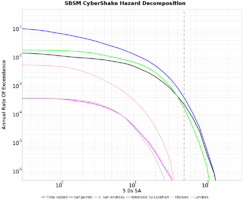
| Site | Location Map | 5s CyberShake Fault Hazard Curves | 5s GMPE Fault Hazard Curves | 5s CyberShake Distance/Mag Disaggregation | 5s GMPE Distance/Mag Disaggregation | CyberShake Fault Exclusion Impact |
|---|---|---|---|---|---|---|
| CCP | ||||||
| COO | ||||||
| PAS | ||||||
| SBSM |
