Difference between revisions of "Broadband Data Products"
| Line 39: | Line 39: | ||
=== Seismogram Comparison Plots === | === Seismogram Comparison Plots === | ||
| + | |||
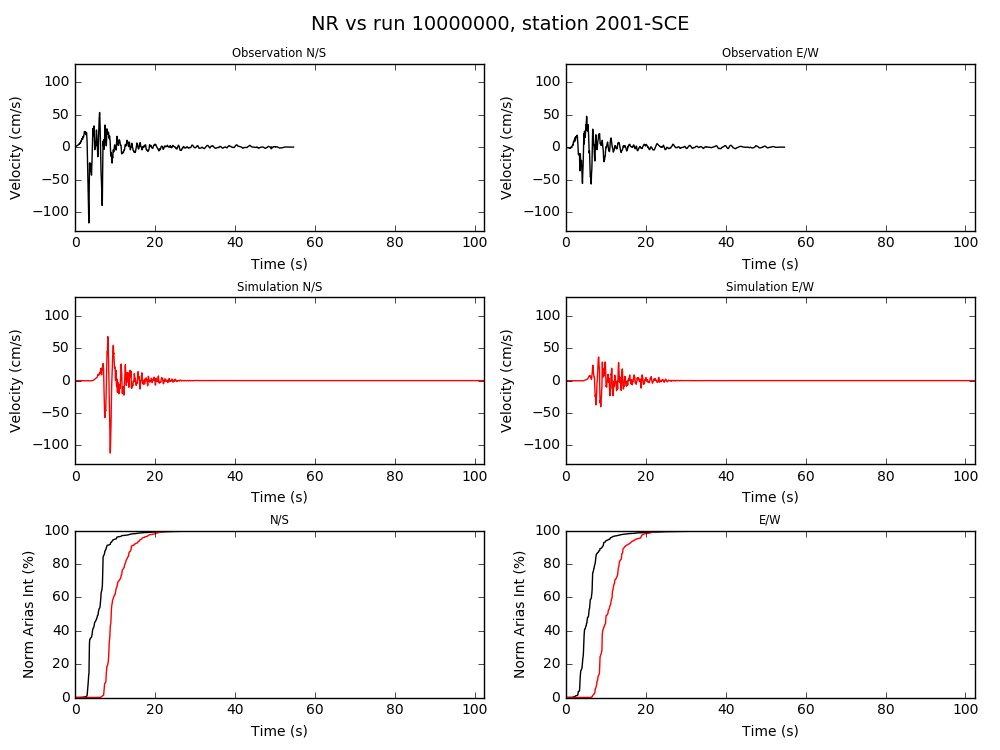
| + | Plots showing calculated data (in red) along with observation data (in black). The two bottom plots show a comparison of the arias duration between simulations and recorded data. | ||
| + | |||
| + | [[File:NR_10000000_2001-SCE_overlay.png]] | ||
=== PSA Comparison Plots === | === PSA Comparison Plots === | ||
Revision as of 18:10, 24 May 2016
This page contains a basic description of some of the data products produced by the Broadband Platform while running a simulation. All the data products described below will be in the outdata directory after a simulation completes.
Contents
Scenario Simulations
Scenario simulations are hypothetical simulations, what-if scenarios. Users provide a source description file describing the rupture and a station list file containing stations for which ground motions will be calculated.
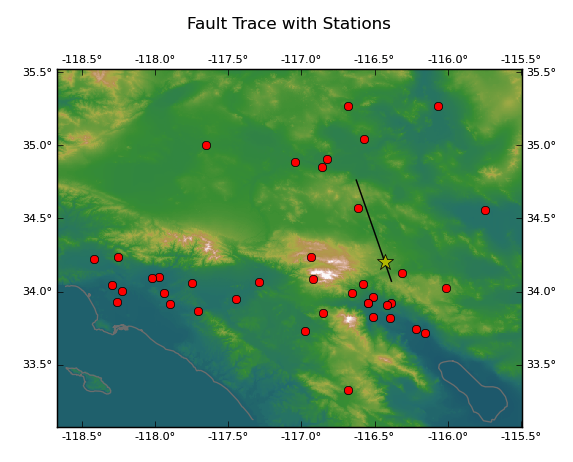
Station Map
A map showing the fault trace along with the stations for which ground motions are calculated. The yellow star shows the hypocenter location.
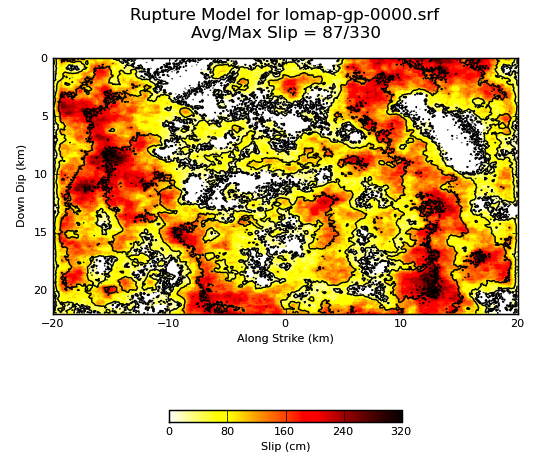
Rupture Model
Velocity and Acceleration Seismograms
The Broadband Platform will produce both velocity and acceleration seismograms in BBP format. An example is shown below.
# Sim NGAH, stat=2001-SCE
#    time(sec)      N-S(cm/s)      E-W(cm/s)      U-D(cm/s)
0.000000e+00    -4.532020e-05   2.096500e-05    1.781130e-04
2.500000e-02    -8.685250e-05   4.299330e-05    3.587300e-04
5.000000e-02    -1.234730e-04   6.599000e-05    5.400660e-04
7.500000e-02    -1.540990e-04   8.986040e-05    7.203370e-04
1.000000e-01    -1.777220e-04   1.145130e-04    8.978090e-04
...
...
1.022750e+02	9.947510e-04	2.843360e-06	-1.606000e-03
1.023000e+02	9.947510e-04	2.843220e-06	-1.606000e-03
1.023250e+02	9.947520e-04	2.843170e-06	-1.606000e-03
1.023500e+02	9.947520e-04	2.843150e-06	-1.606000e-03
1.023750e+02	9.947520e-04	2.843150e-06	-1.606000e-03
Validation Simulations
Validation simulations can be used to calculate seismograms from historical events and compare these again recorded ground motion data, allowing scientists to develop and validate their methods. For this reason, only locations where recorded ground motions are available can be used. In addition to all data products described above for scenario simulations, the following data products will also be calculated:
Seismogram Comparison Plots
Plots showing calculated data (in red) along with observation data (in black). The two bottom plots show a comparison of the arias duration between simulations and recorded data.
