Difference between revisions of "Study 16.9 Velocity Plots"
From SCECpedia
Jump to navigationJump to search (→s001) |
(→s001) |
||
| Line 24: | Line 24: | ||
{| | {| | ||
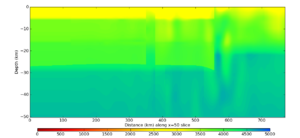
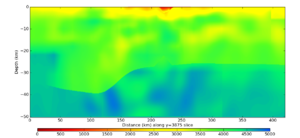
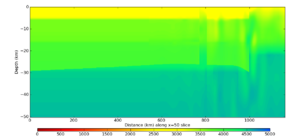
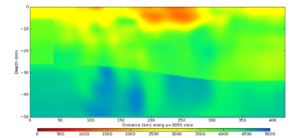
| − | | [[File:s001_CCA_vert_slice_y_50.png|thumb|300px|50 | + | | [[File:s001_CCA_vert_slice_y_50.png|thumb|300px|50 Y vertical cross-section, NW/SE, 8.75 km from SW boundary]] |
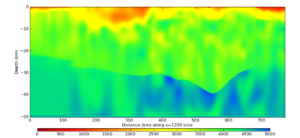
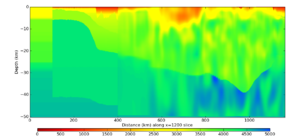
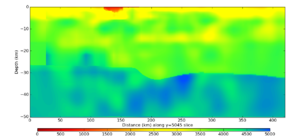
| − | | [[File:s001_CCA_vert_slice_y_1200.png|thumb|300px|1200 | + | | [[File:s001_CCA_vert_slice_y_1200.png|thumb|300px|1200 Y vertical cross-section, NW/SE, 210 km from SW boundary]] |
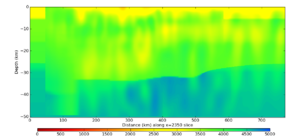
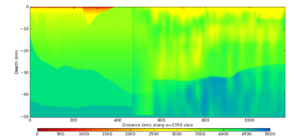
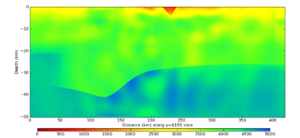
| − | | [[File:s001_CCA_vert_slice_y_2350.png|thumb|300px| | + | | [[File:s001_CCA_vert_slice_y_2350.png|thumb|300px|2350 Y vertical cross-section, NW/SE, 411.25 km from SW boundary]] |
|} | |} | ||
| Line 32: | Line 32: | ||
{| | {| | ||
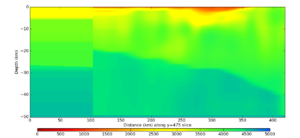
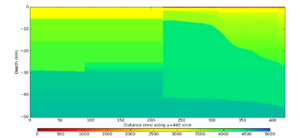
| − | | [[File:s001_CCA_vert_slice_x_475.png|thumb|300px| | + | | [[File:s001_CCA_vert_slice_x_475.png|thumb|300px|475 X vertical cross-section, SW/NE, 83.125 km from NW boundary]] |
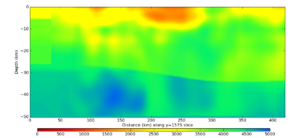
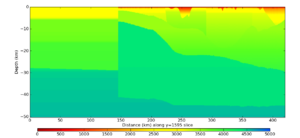
| − | | [[File:s001_CCA_vert_slice_x_1575.png|thumb|300px| | + | | [[File:s001_CCA_vert_slice_x_1575.png|thumb|300px|1575 X vertical cross-section, SW/NE, 275.625 km from NW boundary]] |
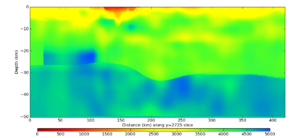
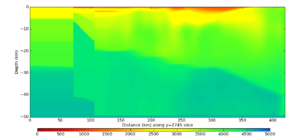
| − | | [[File:s001_CCA_vert_slice_x_2725.png|thumb|300px| | + | | [[File:s001_CCA_vert_slice_x_2725.png|thumb|300px|2725 X vertical cross-section, SW/NE, 476.875 km from NW boundary]] |
| − | | [[File:s001_CCA_vert_slice_x_3875.png|thumb|300px| | + | | [[File:s001_CCA_vert_slice_x_3875.png|thumb|300px|3875 X vertical cross-section, SW/NE, 678.125 km from NW boundary]] |
|} | |} | ||
Revision as of 18:54, 2 December 2016
Contents
s001
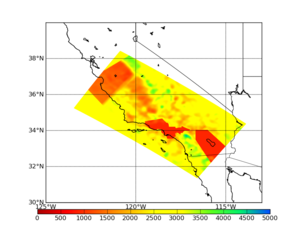
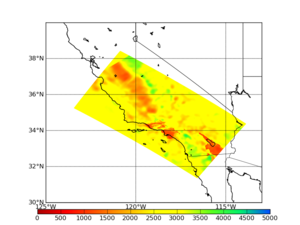
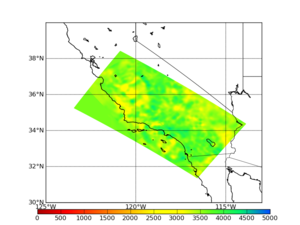
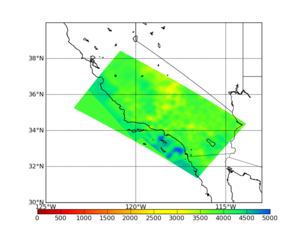
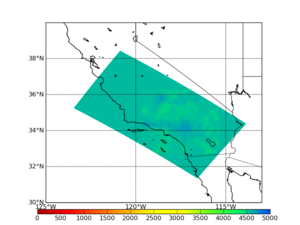
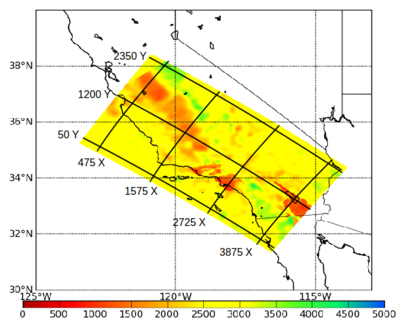
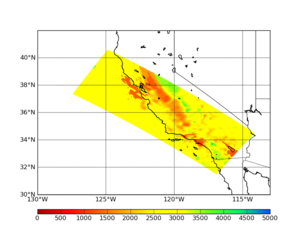
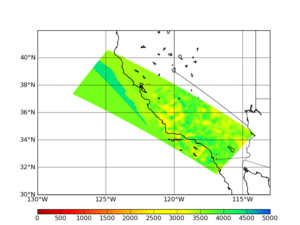
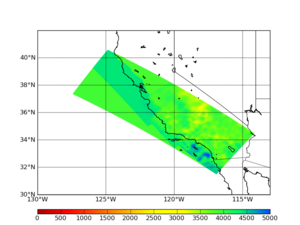
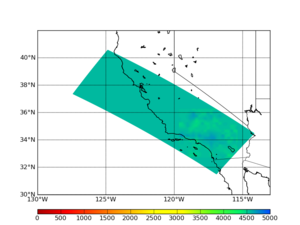
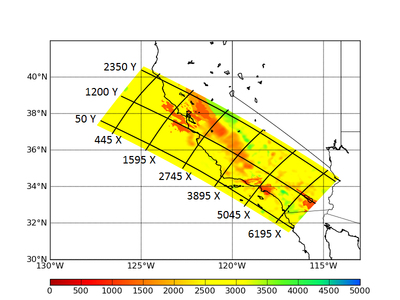
s001 is one of the overlapping sites, near Ventura. The volume is 2400 x 4400 x 288 grid points (420 x 770 x 50.4 km).
Horizontal Plots
Vertical Plots
Here's a plot showing where the cross sections come from:
Cross-sections parallel to the Y (long) axis:
Cross-sections parallel to the X (short) axis:
s1252
s1252 is a site in the mountains near the San Andreas and just far enough north to include northern San Andreas events within the 200 km cutoff.
Horizontal Plots
Vertical Plots
Here's a plot showing where the cross sections come from:
Cross-sections parallel to the Y (long) axis:
Cross-sections parallel to the X (short) axis: Cross-sections parallel to the X (short) axis:
