Difference between revisions of "CVM-H 15.1 Maps"
From SCECpedia
Jump to navigationJump to search| Line 82: | Line 82: | ||
|} | |} | ||
| − | Plots, points (json format), and data (bin format) are posted online at: [http://hypocenter.usc.edu/research/UCVM/cvmh_no_ely_gtl/ CVM-H Map Plots and Data] | + | *Plots, points (json format), and data (bin format) are posted online at: [http://hypocenter.usc.edu/research/UCVM/cvmh_no_ely_gtl/ CVM-H Map Plots and Data] |
| − | + | *Plots, points (json format), and data (bin format) are posted online at: [http://hypocenter.usc.edu/research/UCVM/cvmh_ely_gtl/ CVM-H Map Plots and Data] | |
| − | |||
| − | |||
| − | |||
| − | |||
| − | |||
| − | |||
| − | |||
| − | |||
| − | |||
| − | |||
| − | |||
| − | |||
| − | |||
| − | |||
| − | |||
| − | |||
| − | |||
| − | |||
| − | |||
| − | |||
| − | |||
| − | |||
| − | |||
| − | |||
| − | |||
| − | |||
| − | |||
| − | |||
| − | |||
| − | |||
| − | |||
| − | |||
| − | |||
| − | |||
| − | |||
| − | |||
| − | |||
| − | |||
| − | |||
| − | |||
| − | |||
| − | |||
| − | |||
| − | |||
| − | |||
| − | |||
| − | |||
| − | |||
| − | Plots, points (json format), and data (bin format) are posted online at: [http://hypocenter.usc.edu/research/UCVM/cvmh_ely_gtl/ CVM-H Map Plots and Data] | ||
== Related Entries == | == Related Entries == | ||
*[[UCVM]] | *[[UCVM]] | ||
Revision as of 22:33, 30 June 2018
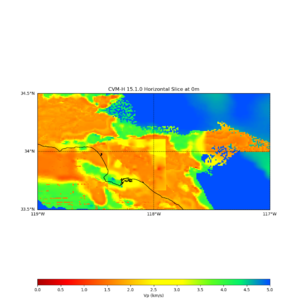
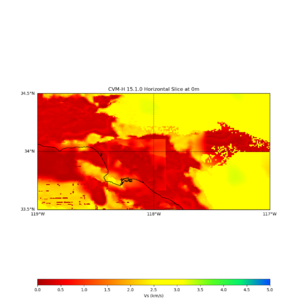
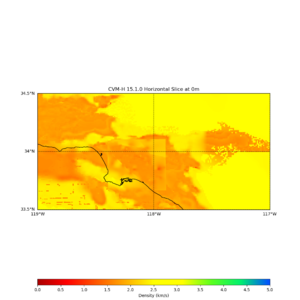
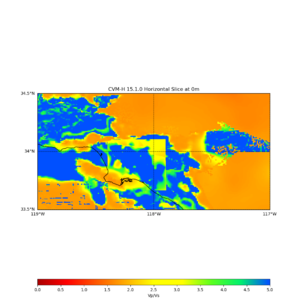
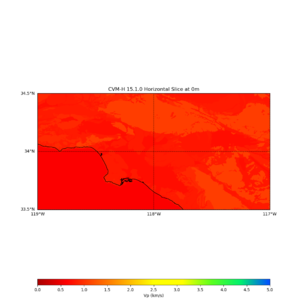
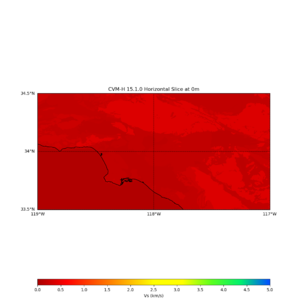
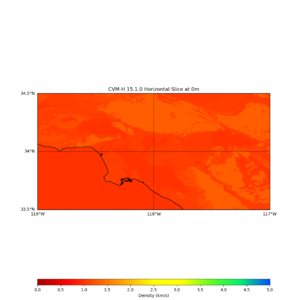
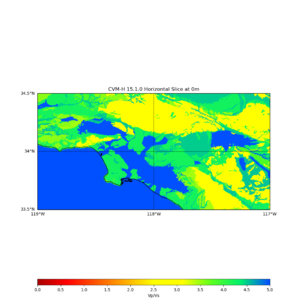
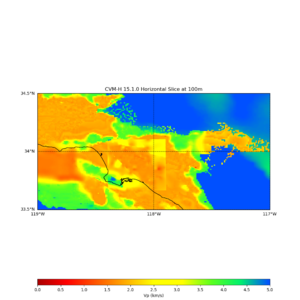
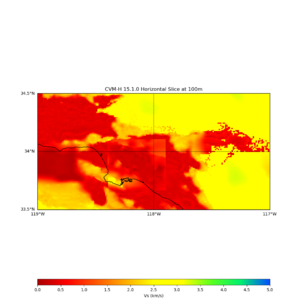
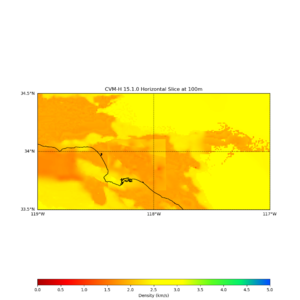
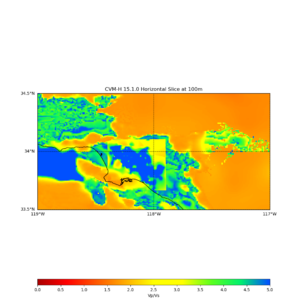
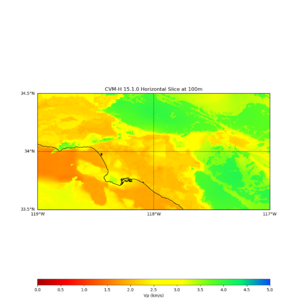
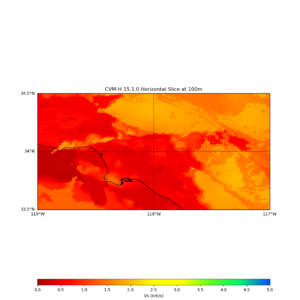
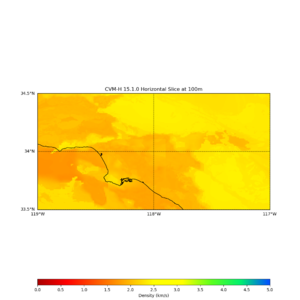
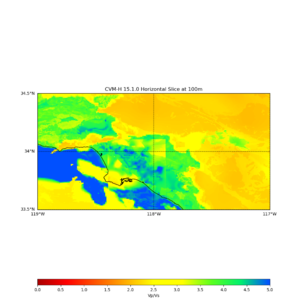
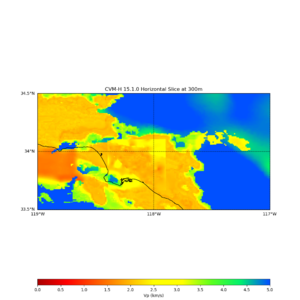
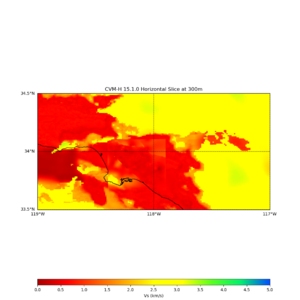
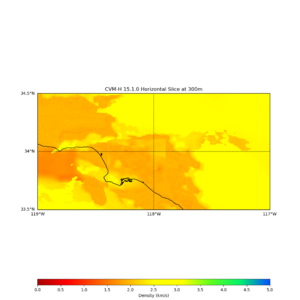
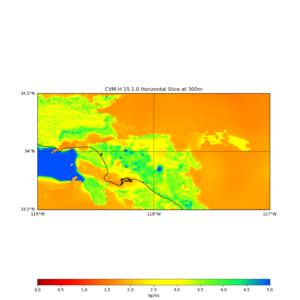
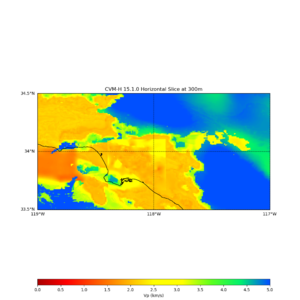
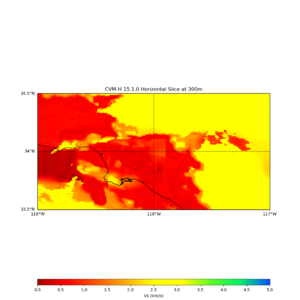
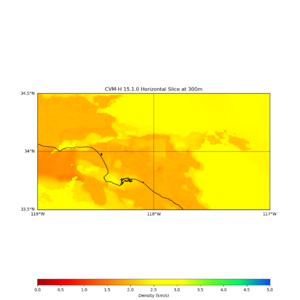
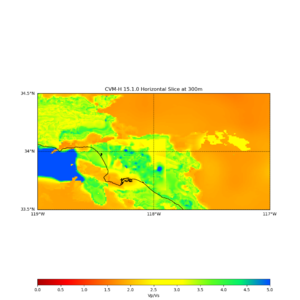
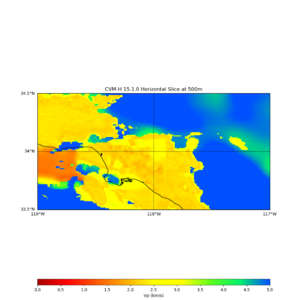
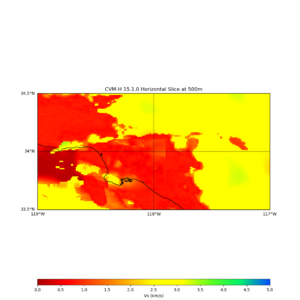
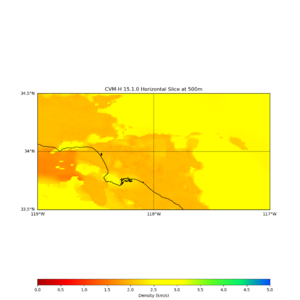
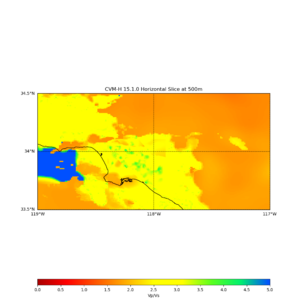
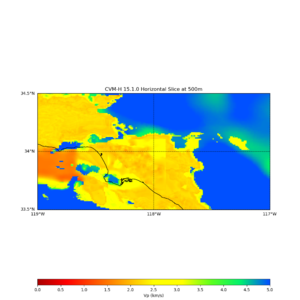
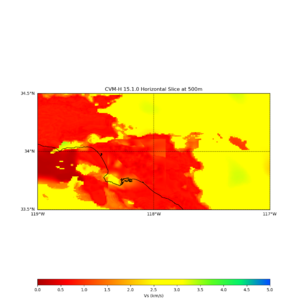
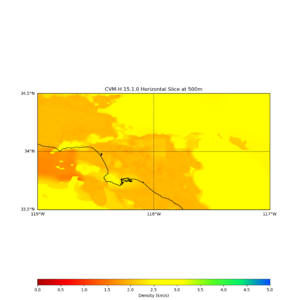
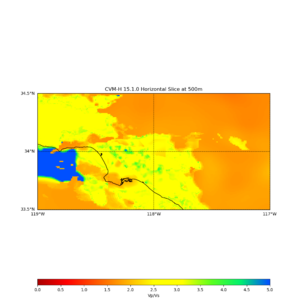
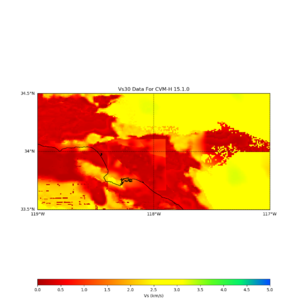
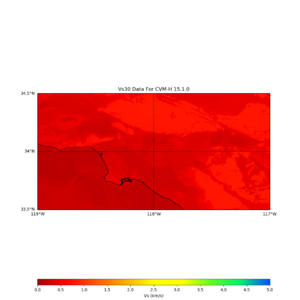
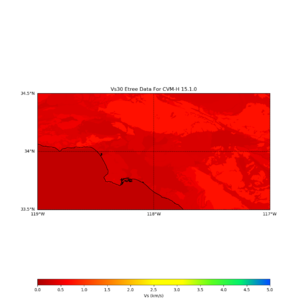
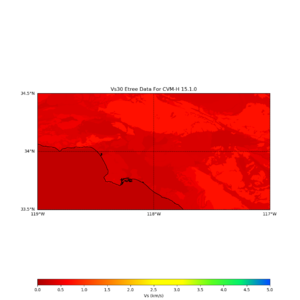
CVM-H 15.1 Near Surface Properties with and without optional Ely-Jordan GTL
| Depth | Vp | Vs | Density | Vp/Vs |
| 0 - CVM-H | ||||
| 0 - ElyGTL | ||||
| 100 - CVM-H | ||||
| 100 - ElyGTL | ||||
| 300 - CVM-H | ||||
| 300 - ElyGTL | ||||
| 500 - CVM-H | ||||
| 500 - ElyGTL | ||||
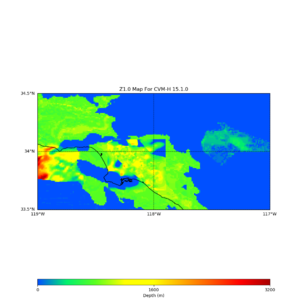
| Z1.0 - CVM-H | ||||
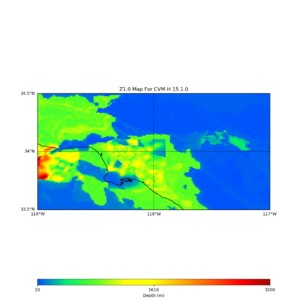
| Z1.0 - ElyGTL | ||||
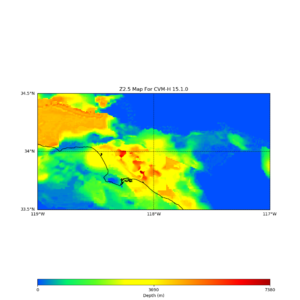
| Z2.5 - CVM-H | ||||
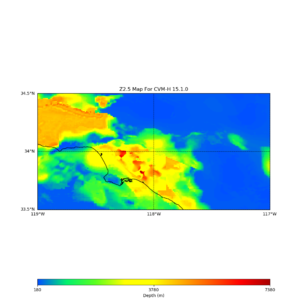
| Z2.5 - ElyGTL | ||||
| Vs30 from CVM-H | ||||
| Vs30 from ElyGTL | ||||
| Vs30 from Etree in UCVM 18.5 using CVM-H | ||||
| Vs30 from Etree in UCVM 18.5 using ElyGTL |
- Plots, points (json format), and data (bin format) are posted online at: CVM-H Map Plots and Data
- Plots, points (json format), and data (bin format) are posted online at: CVM-H Map Plots and Data
