Difference between revisions of "CyberShake 1D Model"
From SCECpedia
Jump to navigationJump to search| Line 1: | Line 1: | ||
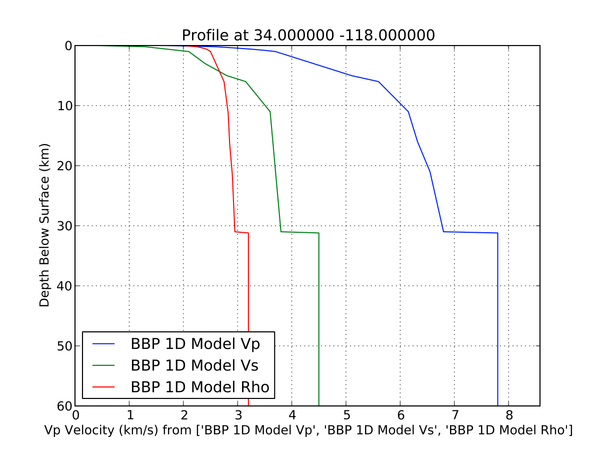
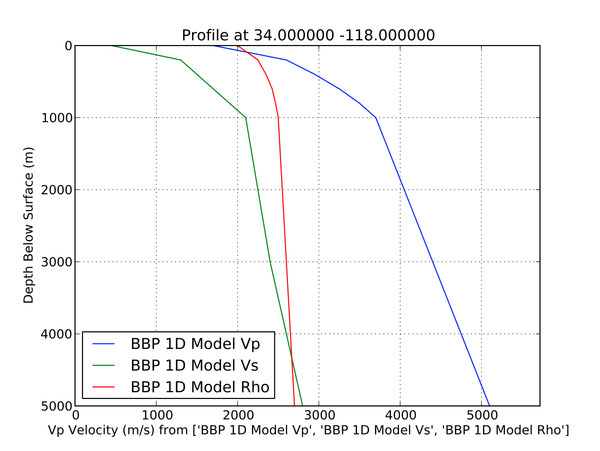
The following plots show a 1D velocity model that we will use for our CyberShake 14.2 Production run. This is a layer model. The interpolation rule we use is: Vp,Vs, and rho values are interpolated between layer n to n+1. | The following plots show a 1D velocity model that we will use for our CyberShake 14.2 Production run. This is a layer model. The interpolation rule we use is: Vp,Vs, and rho values are interpolated between layer n to n+1. | ||
| − | == Velocity Profiles == | + | == Interpolated BBP 1D model Velocity Profiles == |
Below are plots showing Vp, Vs, and rho from the selected 1D model. | Below are plots showing Vp, Vs, and rho from the selected 1D model. | ||
{| | {| | ||
| − | |<b>Broadband Platform 1D model to 60km Depth</b> | + | |<b>Interpolated Broadband Platform 1D model to 60km Depth</b> |
| − | |<b>Broadband Platform 1D model to 5000m Depth</b> | + | |<b>Interpolated Broadband Platform 1D model to 5000m Depth</b> |
|- | |- | ||
|[[File:bbp1d.png|600px]] | |[[File:bbp1d.png|600px]] | ||
| Line 12: | Line 12: | ||
|} | |} | ||
| − | == Overlay Plots == | + | == Interpolated BBP 1D model Overlay Plots == |
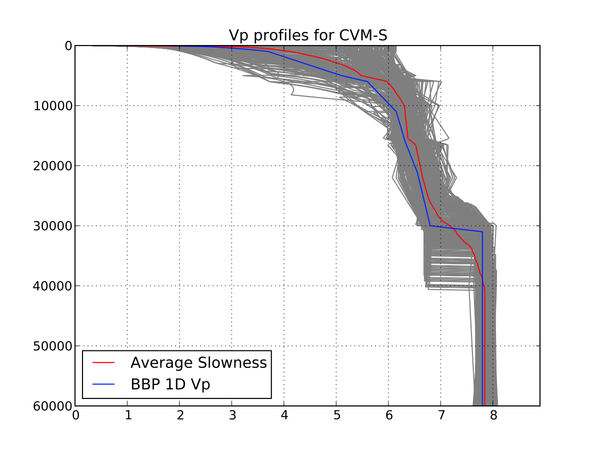
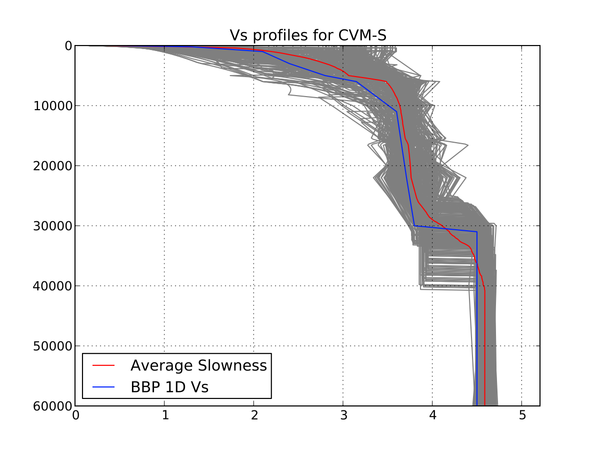
Below are plots showing 1D profiles extracted from CVM-S4 for the 386 CyberShake sites in the study, with the selected 1D model plotted on top of this collection of profiles. | Below are plots showing 1D profiles extracted from CVM-S4 for the 386 CyberShake sites in the study, with the selected 1D model plotted on top of this collection of profiles. | ||
Revision as of 00:22, 30 January 2014
The following plots show a 1D velocity model that we will use for our CyberShake 14.2 Production run. This is a layer model. The interpolation rule we use is: Vp,Vs, and rho values are interpolated between layer n to n+1.
Contents
Interpolated BBP 1D model Velocity Profiles
Below are plots showing Vp, Vs, and rho from the selected 1D model.
| Interpolated Broadband Platform 1D model to 60km Depth | Interpolated Broadband Platform 1D model to 5000m Depth |

|

|
Interpolated BBP 1D model Overlay Plots
Below are plots showing 1D profiles extracted from CVM-S4 for the 386 CyberShake sites in the study, with the selected 1D model plotted on top of this collection of profiles.

|

|
Numerical Description of BBP LA Basin Model
Depth to Bottom of Layer (km) - Layer Thickness (km) - Vp (km/s) - Vs(km/s) - rho() - Qp - Qs
   0.002   0.0020   1.7000   0.4500   2.0000    45.00    22.50
   0.006   0.0040   1.8000   0.6500   2.1000    65.00    32.50
   0.012   0.0060   1.8000   0.8500   2.1000    85.00    42.50
   0.020   0.0080   1.9000   0.9500   2.1000    95.00    47.50
   0.030   0.0100   2.0000   1.1500   2.2000   115.00    57.50
   0.100   0.0700   2.4000   1.2000   2.2000   120.00    60.00
   0.300   0.2000   2.8000   1.4000   2.3000   140.00    70.00
   0.500   0.2000   3.1000   1.6000   2.4000   160.00    80.00
   0.700   0.2000   3.4000   1.8000   2.4500   180.00    90.00
   1.000   0.3000   3.7000   2.1000   2.5000   210.00   105.00
   3.000   2.0000   4.4000   2.4000   2.6000   240.00   120.00
   5.000   2.0000   5.1000   2.8000   2.7000   280.00   140.00
   6.000   1.0000   5.6000   3.1500   2.7500   315.00   157.50
  11.000   5.0000   6.1500   3.6000   2.8250   360.00   180.00
  16.000   5.0000   6.3200   3.6500   2.8500   365.00   182.50
  21.000   5.0000   6.5500   3.7000   2.9000   370.00   185.00
  31.000   10.0000   6.8000   3.8000   2.9500   380.00   190.00
1030.000   999.0000   7.8000   4.5000   3.2000   450.00   225.00
Related Entries
- 1D Model Development Additional details on the various 1D models that were considered
- UCVM