CyberShake Study 18.8
CyberShake 18.8 is a computational study to perform CyberShake in a new region, the extended Bay Area. We plan to use a combination of 3D models (USGS Bay Area detailed and regional, CVM-S4.26.M01, CCA-06) with a minimum Vs of 500 m/s and a frequency of 1 Hz. We will use the GPU implementation of AWP-ODC-SGT, the Graves & Pitarka (2014) rupture variations with 200m spacing and uniform hypocenters, and the UCERF2 ERF. The SGT and post-processing calculations will both be run on both NCSA Blue Waters and OLCF Titan.
Contents
- 1 Status
- 2 Science Goals
- 3 Technical Goals
- 4 Sites
- 5 Projection Analysis
- 6 Velocity Models
- 7 Verification
- 8 Background Seismicity
- 9 SGT time length
- 10 Performance Enhancements (over Study 17.3)
- 11 Output Data Products
- 12 Computational and Data Estimates
- 13 Lessons Learned
- 14 Performance Metrics
- 15 Production Checklist
- 16 Presentations, Posters, and Papers
- 17 Related Entries
Status
This study is paused.
The study began on Friday, August 17, 2018 at 20:17:46 PDT. It was paused on Monday, October 15, 2018 at about 6:53 PDT. We plan to resume it around January 10, 2019.
Science Goals
The science goals for this study are:
- Expand CyberShake to the Bay Area.
- Calculate CyberShake results with the USGS Bay Area velocity model as the primary model.
- Calculate CyberShake results at selection locations with Vs min = 250 m/s.
Technical Goals
- Perform the largest CyberShake study to date.
Sites
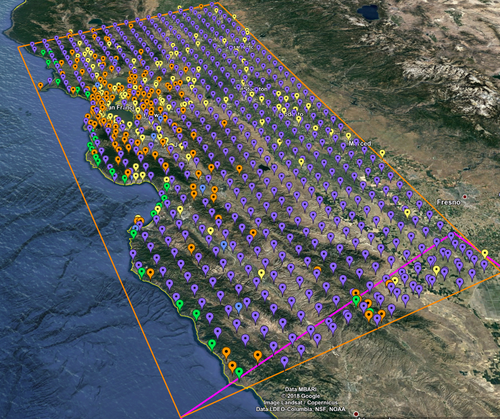
The Study 18.3 box is 180 x 390 km, with the long edge rotated 27 degrees counter-clockwise from vertical. The corners are defined to be:
South: (-121.51,35.52)
West: (-123.48,38.66)
North: (-121.62,39.39)
East: (-119.71,36.22)
We are planning to run 869 sites, 837 of which are new, as part of this study.
These sites include:
- 77 cities (74 new) + 46 sites of interest
- 10 new missions
- 139 CISN stations (136 new)
- 597 sites along a 10 km grid (571 new)
Of these sites, 32 overlap with the Study 17.3 region for verification.
A KML file with all these sites is available with names or without names.
Projection Analysis
As our simulation region gets larger, we needed to review the impact of the projection we are using for the simulations. An analysis of the impact of various projections by R. Graves is summarized in this posting:
Velocity Models
For Study 18.5, we have decided to construct the velocity mesh by querying models in the following order:
- USGS Bay Area model
- CCA-06 with the Ely GTL applied
- CVM-S4.26.M01 (which includes a 1D background model).
A KML file showing the model regions is available here.
We will use a minimum Vs of 500 m/s. Smoothing will be applied 20 km on either side of any velocity model interface.
A thorough investigation was done to determine these parameters; a more detailed discussion is available at Study 18.5 Velocity Model Comparisons.
Vs=250m/s experiment
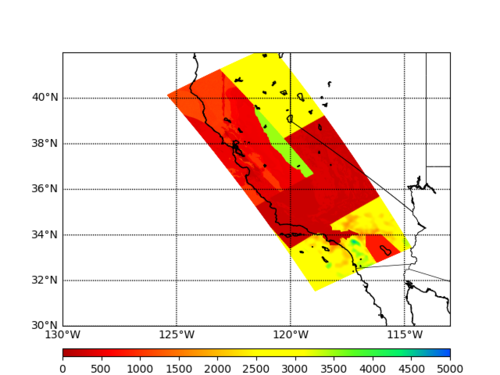
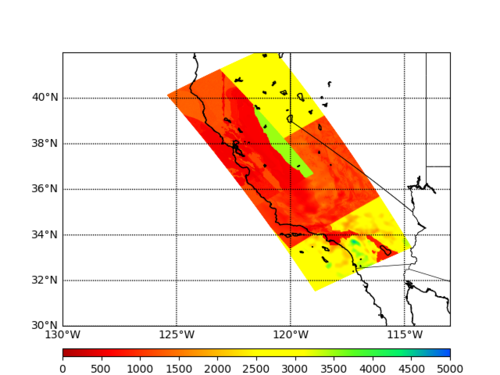
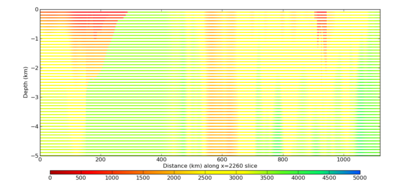
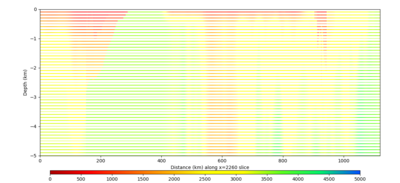
We would like to select a subset of sites and calculate hazard at 1 Hz and minimum Vs=250 m/s. Below are velocity plots with this lower Vs cutoff.
Verification
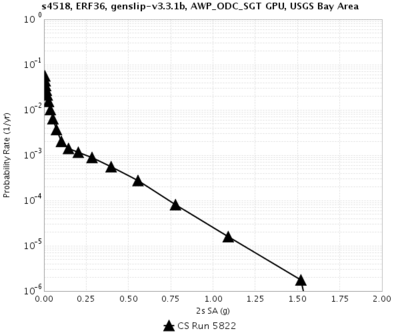
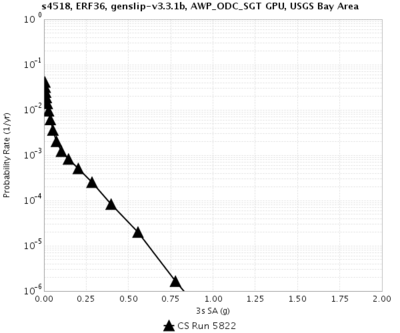
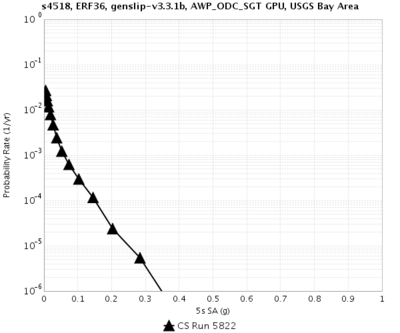
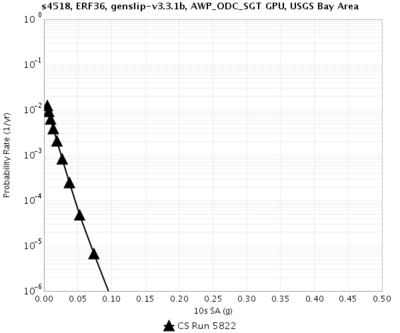
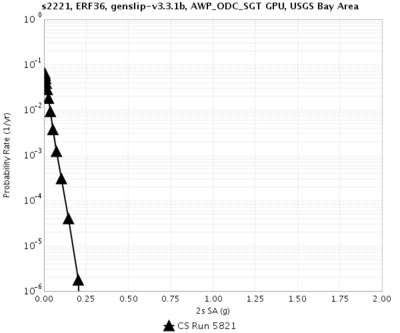
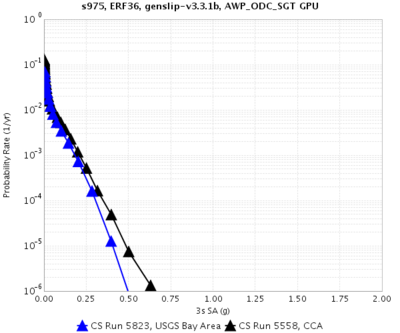
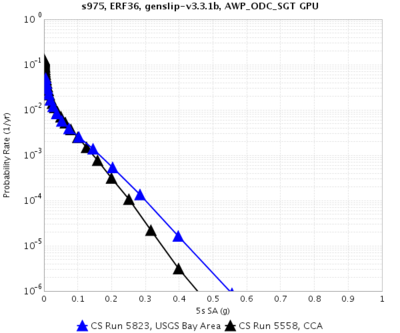
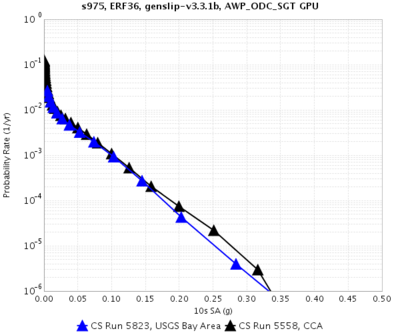
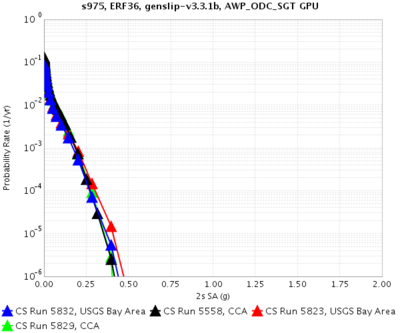
We have selected the following 4 sites for verification, one from each corner of the box:
- s4518
- s975
- s2189
- s2221
We will run s975 at both 50 km depth, ND=50 and 80 km depth, ND=80.
We will run s4518 and s2221 on both Blue Waters and Titan.
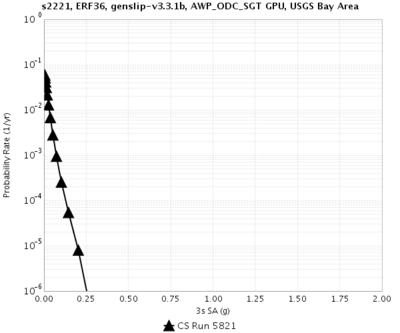
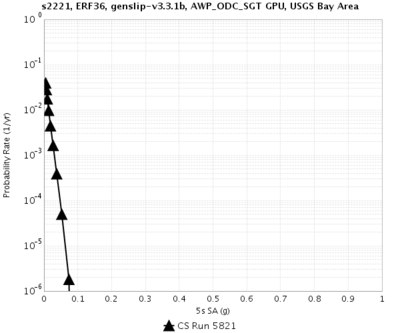
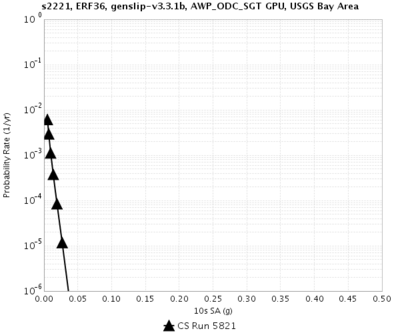
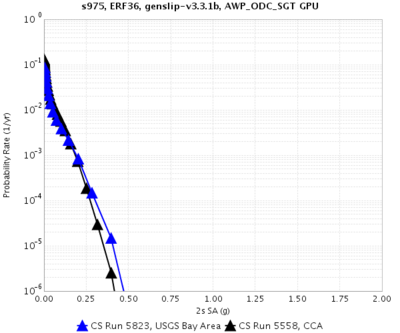
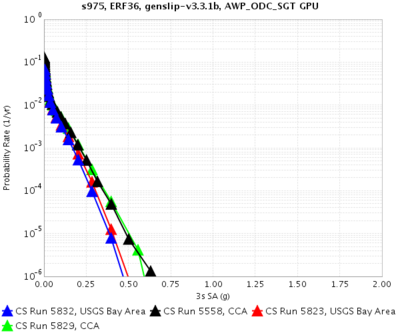
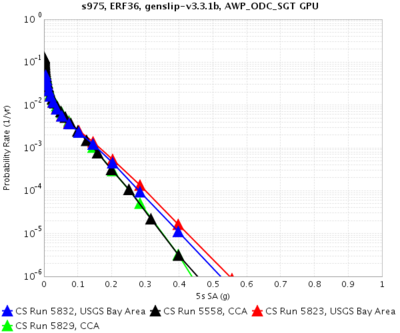
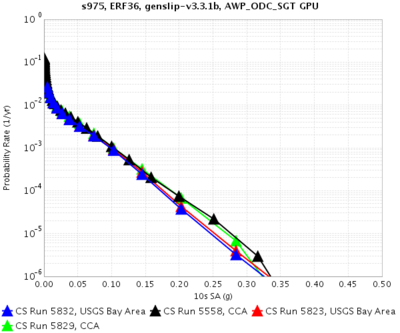
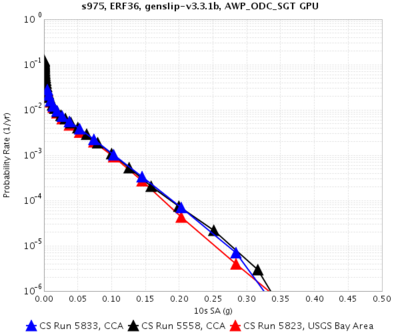
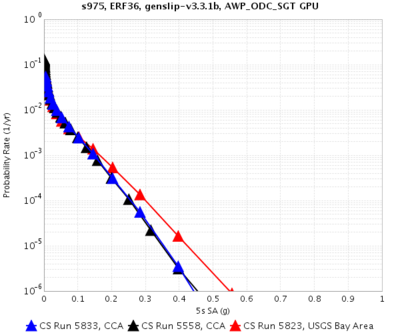
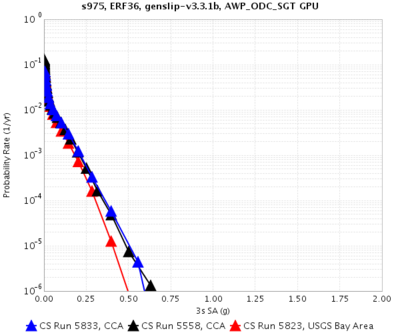
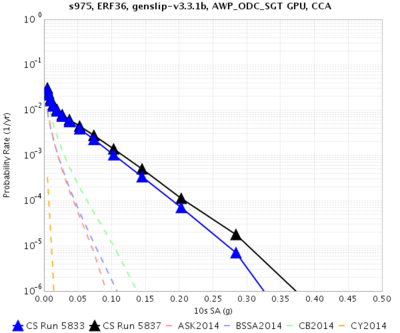
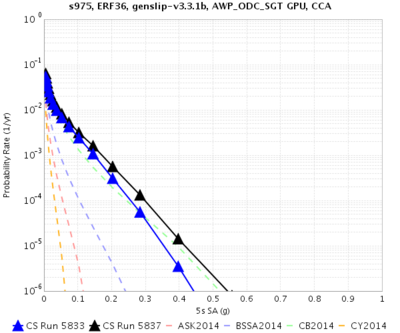
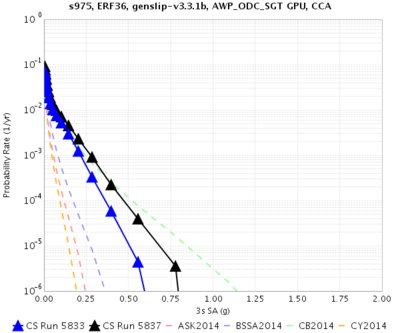
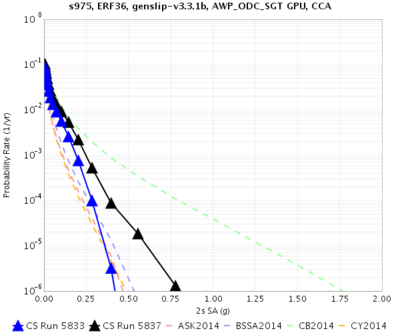
Hazard Curves
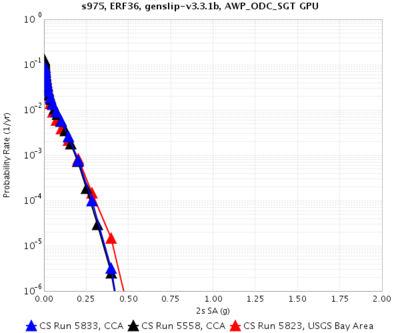
| Site | 2 sec RotD50 | 3 sec RotD50 | 5 sec RotD50 | 10 sec RotD50 |
|---|---|---|---|---|
| s4518 (south corner) | ||||
| s2221 (north corner) | ||||
| s975 (east corner) |
Comparisons with Study 17.3
| Site | 2 sec RotD50 | 3 sec RotD50 | 5 sec RotD50 | 10 sec RotD50 |
|---|---|---|---|---|
| s975 (east corner) |
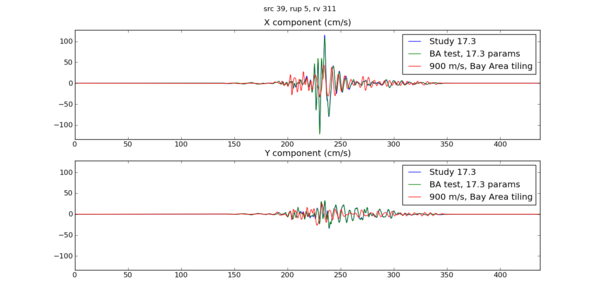
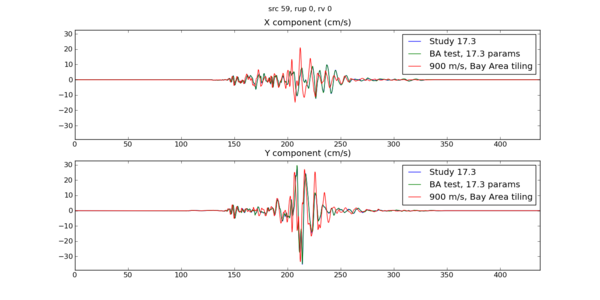
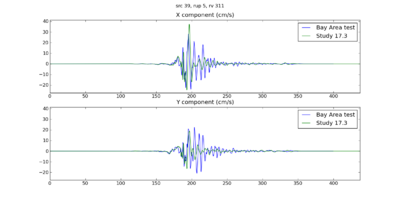
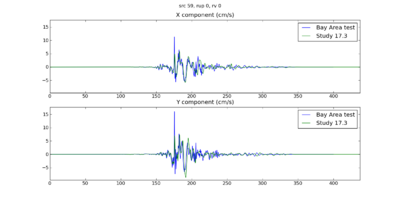
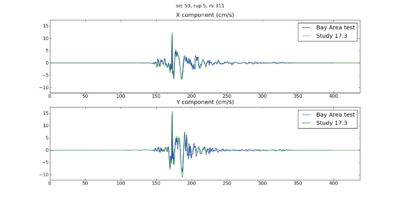
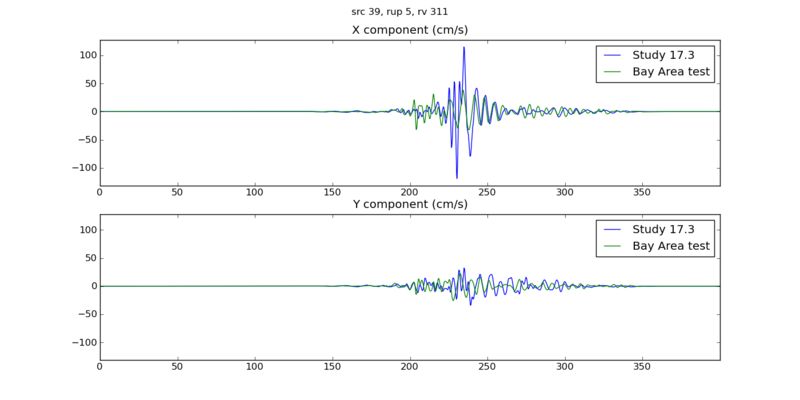
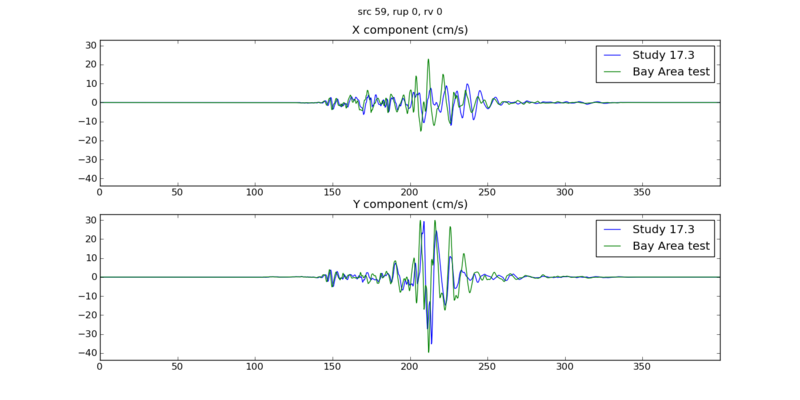
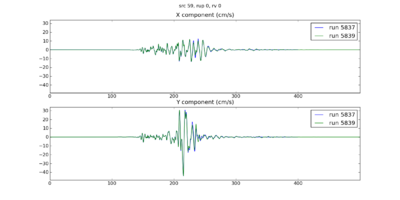
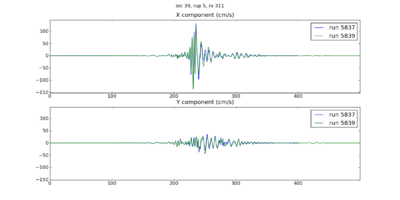
Below are seismograms comparing a northern SAF event (source 39, rupture 5, rupture variation 311, M8.15 with hypocenter just offshore about 60 km south of Eureka) and a southern SAF event (source 59, rupture 0, rupture variation 0, M7.75 with hypocenter near Bombay Beach) between the Bay Area test with Study 17.3 parameters, Study 17.3, and Study 17.3 parameters but Bay Area tiling. The only difference is that the smoothing zone is larger in the Bay Area test + 17.3 parameters (I forgot to change it). Overall, the matches between Study 17.3 and the BA test + 17.3 parameters are excellent. Once the tiling is changed, we start to see differences, especially in the northern CA event.
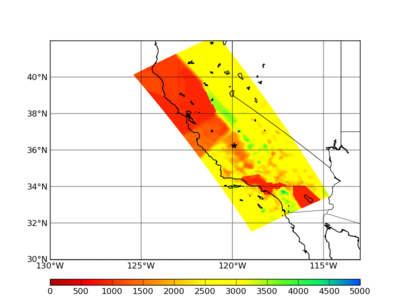
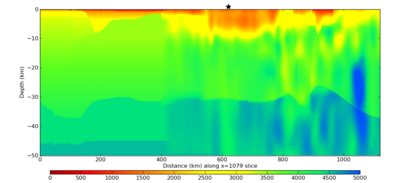
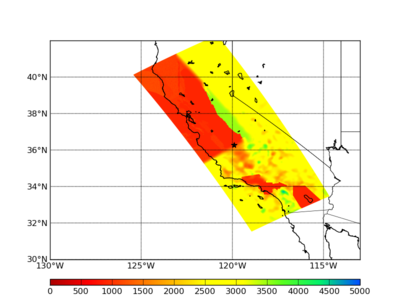
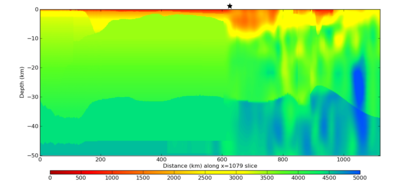
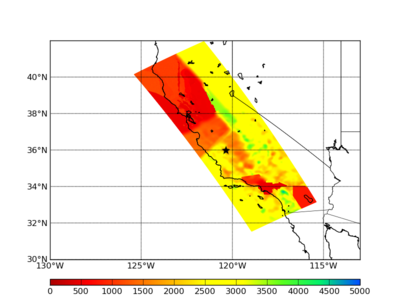
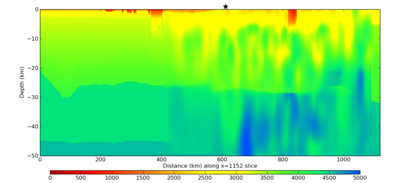
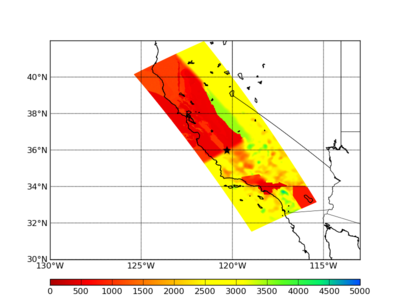
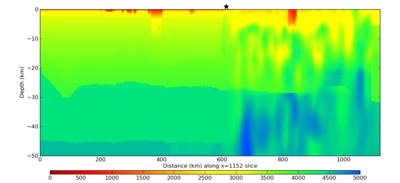
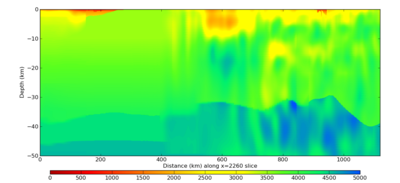
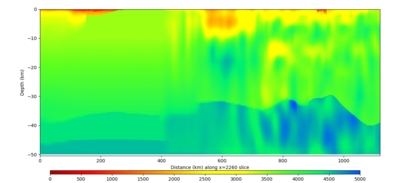
To help illuminate the differences in velocity model, below are surface and vertical plots. The star indicates the location of the s975 site. Both models were created with Vs min = 900 m/s, and no GTL applied to the CCA-06 model.
| Model | Horizontal (depth=0) | Vertical, parallel to box through site |
|---|---|---|
| s975, Study 17.3 tiling: 1)CCA-06, no GTL 2)USGS Bay Area 3)CVM-S4.26.M01 |
||
| s975, Bay Area: 1)USGS Bay Area 2)CCA-06, no GTL 3)CVM-S4.26.M01 |
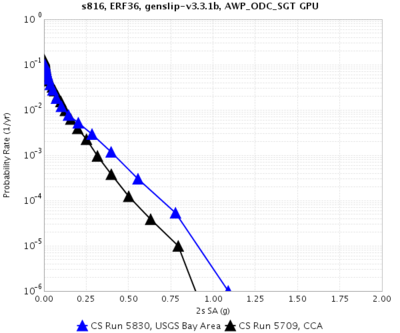
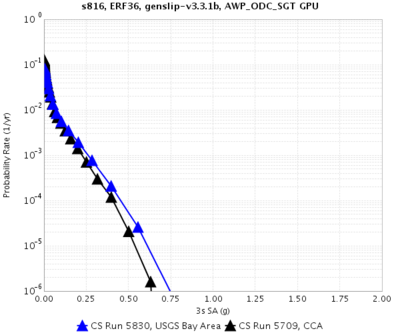
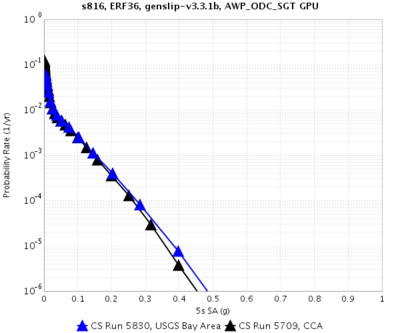
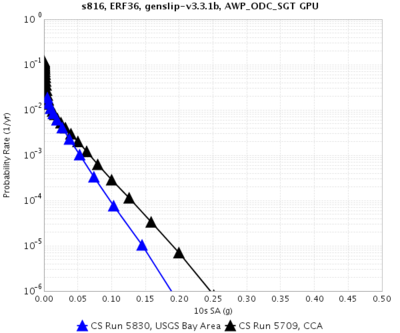
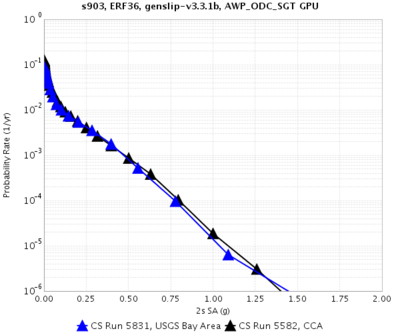
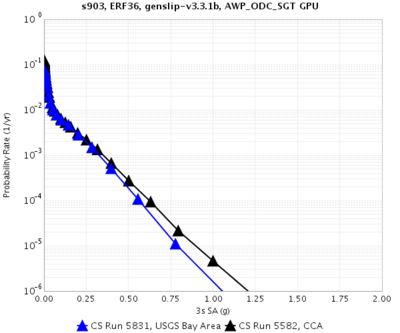
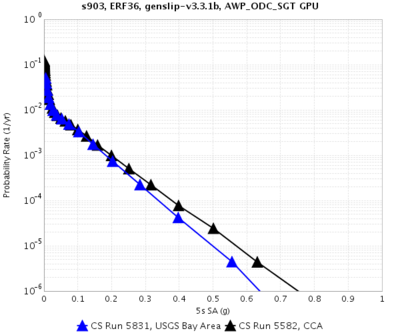
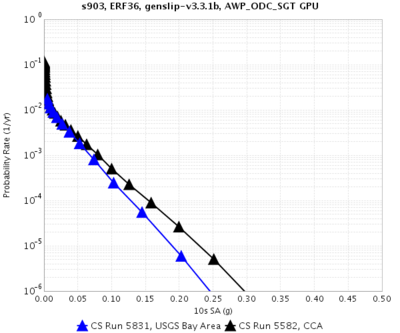
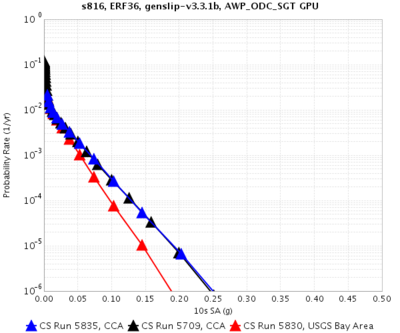
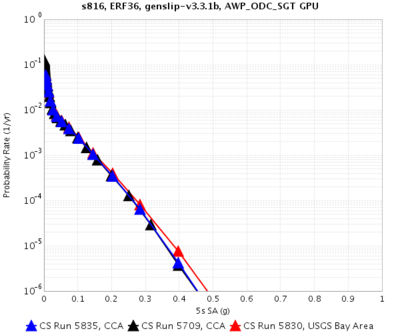
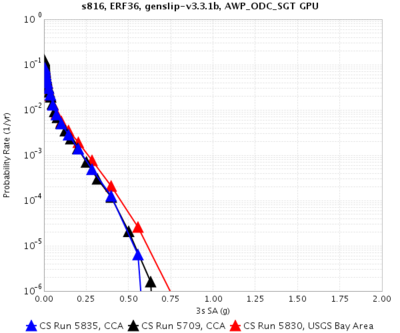
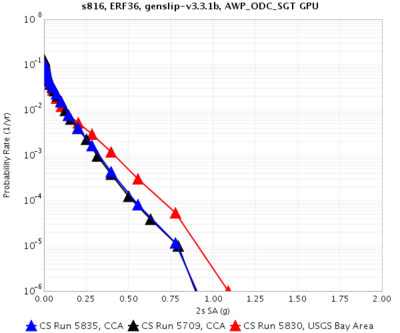
We also calculated curves for 2 overlapping rock sites, s816 and s903. s816 is 22 km from the USGS/CCA model boundary, and outside of the smoothing zone; s903 is 7 km from the boundary.
| Site | 2 sec RotD50 | 3 sec RotD50 | 5 sec RotD50 | 10 sec RotD50 |
|---|---|---|---|---|
| s816 | ||||
| s903 |
Velocity model vertical slides for s816:
| Model | Horizontal (depth=0) | Vertical, parallel to box through site | |
|---|---|---|---|
| s816, Study 17.3 tiling: 1)CCA-06, no GTL 2)USGS Bay Area 3)CVM-S4.26.M01 |
|||
| s816, Bay Area: 1)USGS Bay Area 2)CCA-06, no GTL 3)CVM-S4.26.M01 |
These are seismograms for the same two events (NSAF, src 39 rup 5 rv 311 and SSAF, src 59 rup 0 rv 0). The southern events fit a good deal better than the northern.
| Site | Northern SAF event | Southern SAF event |
|---|---|---|
| s816 | ||
| s903 |
Configuration for this study
Based on these results, we've decided to use the Study 17.3 tiling order for the velocity models:
- CCA-06 with Ely GTL
- USGS Bay Area model
- CVM-S4.26.M01
All models will use minimum Vs=500 m/s.
Here are comparison curves *without* the GTL, comparing Study 17.3 results, USGS Bay Area/CCA-06-GTL/CVM-S4.26.M01, and CCA-06-GTL/USGS Bay Area/CVM-S4.26.M01 .
| Site | 10 sec RotD50 | 5 sec RotD50 | 3 sec RotD50 | 2 sec RotD50 |
|---|---|---|---|---|
| s975 | ||||
| s816 |
GTL
Here are comparison curves between CCA-06-GTL/USGS Bay Area/CVM-S4.26.M01 and CCA-06+GTL/USGS Bay Area/CVM-S4.26.M01, showing the impact of the GTL.
| Site | 10 sec RotD50 | 5 sec RotD50 | 3 sec RotD50 | 2 sec RotD50 |
|---|---|---|---|---|
| s975 |
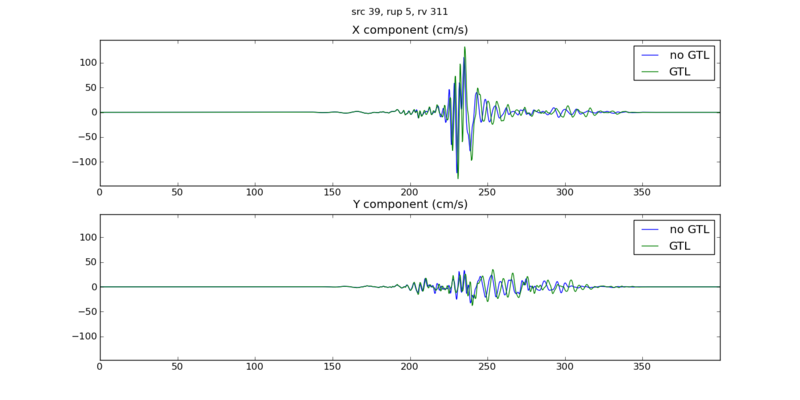
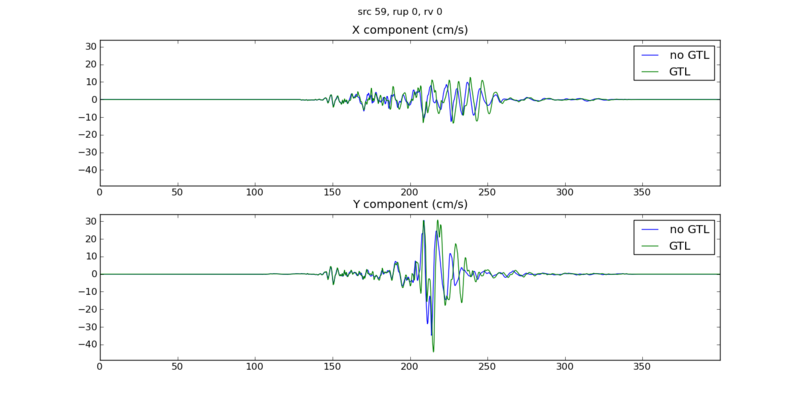
Here are seismogram comparisons for the two San Andreas events with and without the GTL. Adding the GTL slightly amplifies and stretches the seismogram, which makes sense.
Northern event
Southern event
Here are vertical velocity slices through the volume, with NW on the left and SE on the right, both for the entire volume and zoomed in to the top 5 km.
| No GTL | ||
|---|---|---|
| GTL |
Seismograms
We've extracted 2 seismograms for s975, a northern SAF event and a southern, and plotted comparisons of the Bay Area test with the Study 17.3 3D results. Note the following differences between the two runs:
- Minimum vs: 900 m/s for Study 17.3, 500 m/s for the test
- GTL: no GTL in CCA-06 for Study 17.3, a GTL for CCA-06 for the test
- DT: 0.0875 sec for Study 17.3, 0.05 sec for the test
- Velocity model priority: CCA-06, then USGS Bay Area, then CVM-S4.26.M01 for Study 17.3; USGS Bay Area, then CCA-06+GTL, then CVM-S4.26.M01 for the test
Northern Event
This seismogram is from source 39, rupture 5, rupture variation 311, a M8.15 northern San Andreas event with hypocenter just offshore, about 60 km south of Eureka.
Southern Event
This seismogram is from source 59, rupture 0, rupture variation 0, a M7.75 southern San Andreas event with hypocenter near Bombay Beach.
Blue Waters and Titan
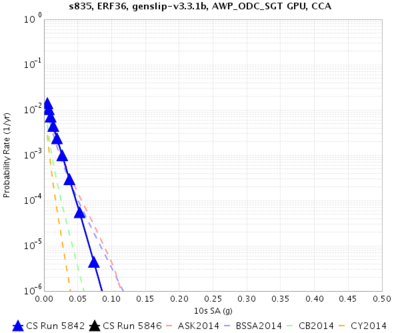
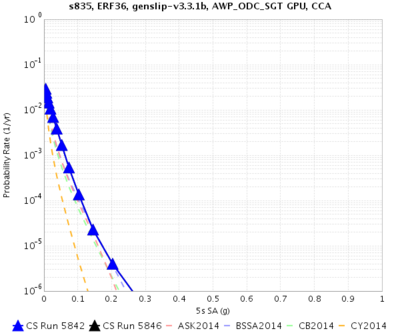
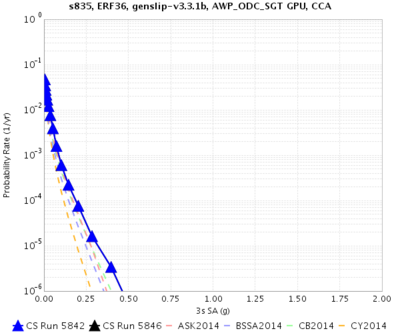
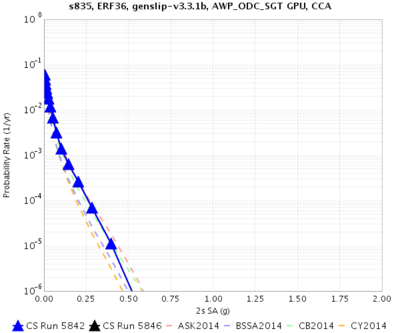
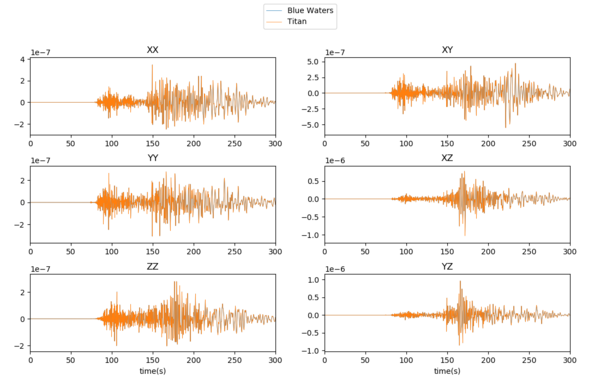
We calculated hazard curves for the same site (s835) on Titan and Blue Waters. The curves overlap.
Background Seismicity
Statewide maps showing the impact of background seismicity are available here: CyberShake Background Seismicity
SGT time length
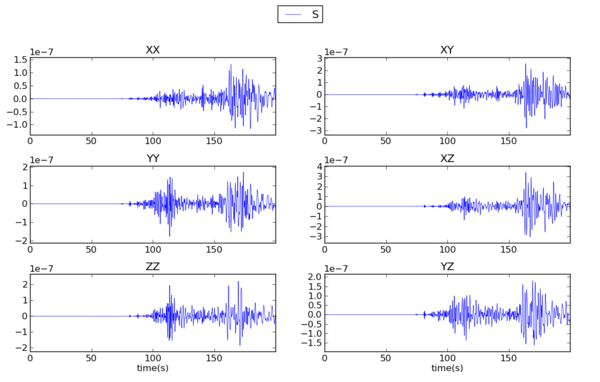
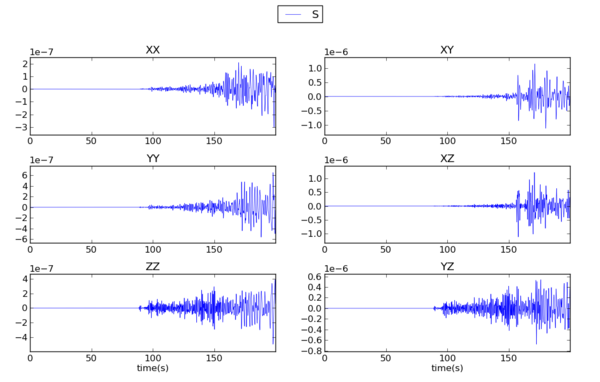
Below are SGT plots for s945. These SGTs are from the southwest and southeast bottom corner of the region, so as far as you can get from this site. It looks like 200 sec isn't long enough for these distant points.
Based on this, we will increase the SGT simulation time to 300 sec for all , and the seismogram duration from 400 to 500 sec.
Longer SGT comparison
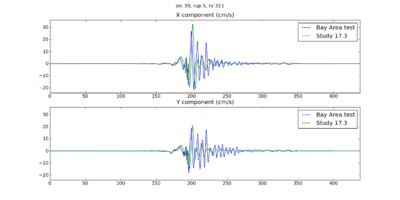
Below is a comparison of seismograms generating using the original length (200 sec SGTs, 400 sec seismograms, in blue) and the new length (300 sec SGTs, 500 sec seismograms, in green). The slight differences in wiggles are due to the shorter ones being generated with Wills 2015, and the longer with 2006. Notice the additional content after about 350 seconds in the green trace.
Southern SAF (src 59, rup 0, rv 0):
Northern SAF (src 39, rup 5, rv 311):
Performance Enhancements (over Study 17.3)
Responses to Study 17.3 Lessons Learned
- Include plots of velocity models as part of readiness review when moving to new regions.
We have constructed many plots, and will include some in the science readiness review.
- Formalize process of creating impulse. Consider creating it as part of the workflow based on nt and dt.
- Many jobs were not picked up by the reservation, and as a result reservation nodes were idle. Work harder to make sure reservation is kept busy.
- Forgot to turn on monitord during workflow, so had to deal with statistics after the workflow was done. Since we're running far fewer jobs, it's fine to run monitord population during the workflow.
We set pegasus.monitord.events = true in all properties files.
- In Study 17.3b, 2 of the runs (5765 and 5743) had a problem with their output, which left 'holes' of lower hazard on the 1D map. Looking closely, we discovered that the SGT X component of run 5765 was about 30 GB smaller than it should have been, likely causing issues when the seismograms were synthesized. We no longer had the SGTs from 5743, so we couldn't verify that the same problem happened here. Moving forward, include checks on SGT file size as part of the nan check.
We added a file size check as part of the NaN check.
Output Data Products
Below is a list of what data products we intend to compute and what we plan to put in the database.
Computational and Data Estimates
Computational Estimates
In producing the computational estimates, we selected the four N/S/E/W extreme sites in the box which 1)within the 200 km cutoff for southern SAF events (381 sites) and 2)were outside the cutoff (488 sites). We produced inside and outside averages and scaled these by the number of inside and outside sites.
We also modified the box to be at an angle of 30 degrees counterclockwise of vertical, which makes the boxes about 15% smaller than with the previously used angle of 55 degrees.
We scaled our results based on the Study 17.3 performance of site s975, a site also in Study 18.3, and the Study 15.4 performance of DBCN, which used a very large volume and 100m spacing.
We also assume that the sites with southern San Andreas events will be run with 300 sec SGTs, and the other sites with 200 sec. All seismograms will be 500 sec long.
| # Grid points | #VMesh gen nodes | Mesh gen runtime | # GPUs | SGT job runtime | Titan SUs | BW node-hrs | |
|---|---|---|---|---|---|---|---|
| Inside cutoff, per site | 23.1 billion | 192 | 0.85 hrs | 800 | 2.03 hrs | 102.1k | 3320 |
| Outside cutoff, per site | 10.2 billion | 192 | 0.37 hrs | 800 | 0.60 hrs | 30.8k | 990 |
| Total | 53.9M | 1.75M |
For the post-processing, we quantified the amount of work by determining the number of individual rupture points to process (summing, over all ruptures, the number of rupture variations for that rupture times the number of rupture surface points) and multiplying that by the number of timesteps. We then scaled based on performance of s975 from Study 17.3, and DBCN in Study 15.4.
Below we list the estimates for Blue Waters or Titan.
| #Points to process | #Nodes (BW) | BW runtime | BW node-hrs | #Nodes (Titan) | Titan runtime | Titan SUs | |
|---|---|---|---|---|---|---|---|
| Inside cutoff, per site | 5.96 billion | 120 | 14.0 hrs | 1680 | 240 | 15.5 hrs | 111.3k |
| Outside cutoff, per site | 2.29 billion | 120 | 3.57 hrs | 430 | 240 | 3.95 hrs | 28.5k |
| Total | 850K | 56.32M |
Our computational plan is to split the SGT calculations 75% BW/25% Titan, and split the PP 75% BW, 25% Titan. With a 20% margin, this would require 33.1M SUs on Titan, and 2.34M node-hrs on Blue Waters.
Currently we have 91.7M SUs available on Titan (expires 12/31/18), and 8.14M node-hrs on Blue Waters (expires 8/31/18). Based on the 2016 PRAC (spread out over 2 years), we budgeted approximately 6.2M node-hours for CyberShake on Blue Waters this year, of which we have used 0.01M.
Data Estimates
SGT size estimates are scaled based on the number of points to process.
| #Grid points | Velocity mesh | SGTs size | Temp data | Output data | |
|---|---|---|---|---|---|
| Inside cutoff, per site | 23.1 billion | 271 GB | 615 GB | 1500 GB | 23.8 GB |
| Outside cutoff, per site | 10.2 billion | 120 GB | 133 GB | 385 GB | 11.6 GB |
| Total | 158 TB | 292 TB | 742 TB | 14.4 TB |
If we split the SGTs and the PP 25% Titan, 75% Blue Waters, we will need:
Titan: 185 TB temp files + 3.6 TB output files = 189 TB
Blue Waters: 557 TB temp files + 185 TB Titan SGTs + 10.8 TB output files = 753 TB
SCEC storage: 1 TB workflow logs + 14.4 TB output data files = 15.4 TB(24 TB free)
Database usage: (4 rows PSA [@ 2, 3, 5, 10 sec] + 12 rows RotD [RotD100 and RotD50 @ 2, 3, 4, 5, 7.5, 10 sec] + 4 rows Duration [X and Y acceleration @ 5-75%, 5-95%])/rupture variation x 225K rupture variations/site x 869 sites = 3.9 billion rows x 125 bytes/row = 455 GB (2.0 TB free on moment.usc.edu disk)
Lessons Learned
- Consider separating SGT and PP workflows in auto-submit tool to better manage the number of each, for improved reservation utilization.
- Create a read-only way to look at the CyberShake Run Manager website.
- Consider reducing levels of the workflow hierarchy, thereby reducing load on shock.
- Establish clear rules and policies about reservation usage.
- Determine advance plan for SGTs for sites which require fewer (200) GPUs.
- Determine advance plan for SGTs for sites which exceed memory on nodes.
- Create new velocity model ID for composite model, capturing metadata.
- Verify all Java processes grab a reasonable amount of memory.
- Clear disk space before study begins to avoid disk contention.
- Add stress test before beginning study, for multiple sites at a time, with cleanup.
Performance Metrics
Usage
Just before starting, we grabbed the following usage numbers from the systems:
Blue Waters
The 'usage' command gives 2792733.80 node-hours used out of 9620000.00 by project baln, and 1014 jobs run.
User scottcal used 77705.03 node-hours on project baln.
Titan
Project usage: 78,304,261 SUs (of 96,000,000) in 2018, 22,784,073 in August 2018.
callag usage: 4,046,501 SUs in 2018, 985,434 in August 2018.
callag usage at hiatus: 50,158,853 SUs in 2018, 5,418,846 in August 2018, 26,119,171 in September, 15,559,769 in October.
Reservations
We started with 1252 XK, 1316 XK, 2 160 XE, 3 164 XE, and 1 168 XE node reservations at noon PDT on 8/18. Because of a misunderstanding regarding the XE node reservations, jobs weren't matched to them and they terminated in 40 minutes.
We lost the XK reservations around 8 am PDT on 8/20, as they were accidentally killed by Blue Waters staff.
We got new XK reservations (1252 and 1316 nodes) at 11 am PDT on 8/22.
Due to underutilization, both XK reservations and all but 1 of the XE reservations were killed between midnight and 8 am PDT on 8/29.
A new set of XK reservations (1252, 1316) started at 7:30 am PDT on 8/31, 4 new XEs (3x164, 1x160) at 9:15 am on 8/31, and 1 more XE (1x168) at 9:45 am on 8/31. They were killed in the morning of 9/4 due to underutilization.
A new set of reservations (same number and sizes) started at 8 am PDT on 9/14.
Events during Study
Until we got our second round of reservations on 8/22, it was difficult to make headway on Blue Waters. Then it became difficult to keep the XE reservations full, so we switched to SGTs-only on Titan.
We finally were granted 8 jobs ready to run and 5 jobs in bin 5 on Titan, which took effect on 8/29.
Early in the morning of 8/29, some kind of network or disk issue decoupled shock and the remote systems. This resulted in a variety of problems, including not enough jobs in the queue on Blue Waters, Condor no longer submitting jobs to grid resources, and the same job being submitted multiple times to Titan. On 8/30, these issues seemed to have worked themselves out.
Titan was down for 8/30-8/31.
The SCEC disks crashed sometime during the night of 8/30-8/31. The disks were restored around 8:30 am PDT on 8/31, but shock required a reboot. A controller was swapped around 3 pm PDT, causing the disks to crash again. They were returned to service at 4 pm, but with extensive I/O errors. The reservations were killed on the morning of 9/4. The I/O issues were resolved in the afternoon of 9/4.
On 9/5 we determined a change made to try to fix the symlink issue (which turned x509userproxy back on for Titan jobs), led to submitting jobs which caused trouble for future jobs being submitted. We changed this back and will throw out runs currently in process on Titan.
On 9/14 we had to restart the rvgahp server on Titan.
On 9/14 at 10 am PDT 2 XK and 6 XE reservations were restarted.
On 9/14 around noon the SCEC disks were unmounted due to an unspecified issue at HPC.
We lost 3 XE reservations on the night of 9/14-9/15. 2 of them were resumed at 10 am on 9/19.
All reservations were terminated in the morning of 9/21 due to a full system job on Blue Waters.
On 9/21 we switched to using bundled SGT jobs on Titan, which increased SGT throughput.
2 XK reservations were restarted 9/23 at 8 am. 3 XE reservations were restarted 9/25 at 7 am, and 2 more XE reservations were started 9/27 at 10:15 am.
The rvgahp server on Titan needed to be restarted on 9/27.
2 of the XK reservations were lost around 4 am on 10/1; there was an issue with a disconnect between shock and Blue Waters, so post-processing jobs didn't clear the queue, so new SGT jobs weren't queued. They were restored on 10/4 at 8:30 am.
In the afternoon of 10/1, we exceeded 125% allocation usage on Titan, and our jobs were heavily penalized. After working this out with the OLCF staff, we returned to normal priority levels early in the morning of 10/4.
2 XE reservations were removed to clear room for additional reservations on 10/4.
1 XK reservation was removed around 4 pm on 10/5; a second was removed around 5 pm on 10/6.
Production Checklist
Install UCVM 18.5.0 on TitanCompute test hazard curves for 4 sites - on both systems for 2 of them.Compute test curves for 2 overlapping sites.Integrate Vs30 calculation and database population into workflowCreate Vs min=250 m/s plots.Spec Vsmin=250 runsCreate XML file describing study for web monitoring tool.Make decision regarding sites with 1D model.Activate Blue Waters and Titan quota cronjobs.Activate Blue Waters and Titan usage cronjobs.Improve parallelism/scalability of smoothing code.Tag code in repositoryCalculate background seismicity impact for most-likely-to-be-impacted sites.(Will defer until after study completion)Verify that Titan and Blue Waters codebases are in sync with each other and the repo.Prepare pending fileGet usage stats from Titan and Blue Waters before beginning study.Hold science and technical readiness reviews.Calls with Blue Waters and Titan staffSwitch to more recent version of Rob's projection code
Presentations, Posters, and Papers
- File:Science Readiness Review.pptx
- File:Technical Readiness Review.pptx
- File:Overview for NCSA.pptx
- File:Overview for OLCF.pptx
