CISN Testing Center
The CISN Testing Center (CTC) consists of scientific analysis software, CISN EEW algorithm performance reports, and earthquake observational data.
CTC Results
Interactive CTC Results are collected on the following entry:
CTC Design Goals
CTC is designed to meet scientific forecast testing goals described in Schorlemmer Gerstenberger (2007):
- Transparency
- Controlled Environment
- Comparability
- Reproducibility
Transparency
For transparency, CTC evaluation summaries are identified with a CTC software version. When a CTC results is presented, all input data sets used in the calculation, all authorized data sets (observational data), and all source code is accessible to researchers. All calculations can be checked.
Controlled Environment
For controlled environment, CTC evaluation summaries are based on EEW forecasts created during earthquake processing and transmitted to the CTC testing center with no human intervention. Performance summaries are produced by CTC testing group, independent of algorithm developers. Observational data used is obtained from approved and authorized data sources (ANSS Catalog and ShakeMap).
Comparability
For comparability, CTC evaluation summaries integrate information from multiple algorithms. CTC processing combines information from multiple algorithms producing comparable performance information for difference algorithms for same earthquakes.
Reproducibility
For reproducibility, CTC results can be reproduced by retrieving the CTC software version used to produced the summaries. The CTC software can be run interactively, which enables any use to reproduce CTC results.
CTC Implementation Approach
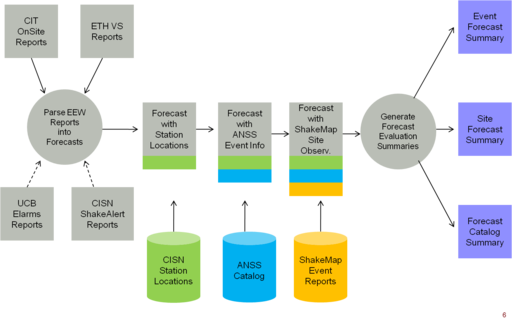
As of 20 June 2011, CTC consists of two elements, (1) an automated data processing framework based on the CSEP software that retrieves observational data for use in evaluations, and (2) processing software that parses CISN Algorithm performance reports and matches the EEW event and site forecast information against ANSS catalog and ShakeMap ground motion observations.
See Also
References
- D. Schorlemmer and M. C. Gerstenberger Seismological Research Letters, Vol. 78, No. 1, 30-36, 2007.


