Moved:CyberShake MCER
For the Utilization Committee meeting on November 3, 2014, we are preparing probabilistic and deterministic MCER results using the CyberShake dataset.
Contents
Study Sites
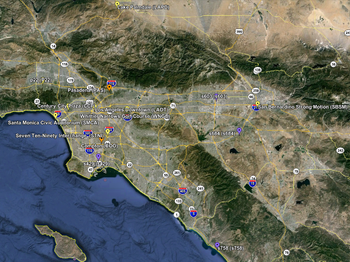
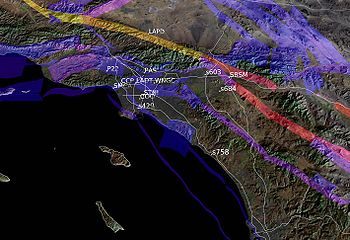
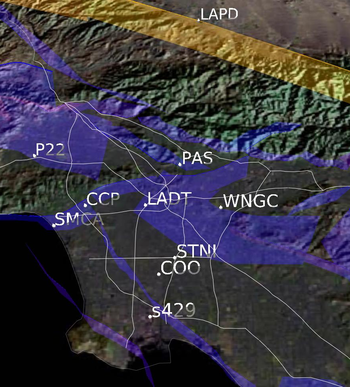
We are calculating MCER results for 14 sites, available in a KML file Image to the right shows the location of the MCER 2014 study sites. These sites can be plotted using the following KML file:
- MCER 2014 Study Sites (Google Earth KML Format). (KML file)
Near surface information about these sites includes Vs30, Z1.0, Z2.5 Values. These values are used in GMPE calculations for these sites. Site names, locations, and near surface values are listed in the following file.
- Site List with Vs30 Information (CSV File)
Probabilistic MCER Results
CyberShake probabilistic MCER results for the 14 sites. This also contains comparable RotD100 results for the 2008 and 2014 NGAs.
- Probabilistic MCER Results. (Excel xlsx file)
This zip file contains pseudo spectral velocity plots for the probabilistic results.
- Probabilistic MCER Plots. (815Kb Zip File containing PNG images)
Metadata for these results include:
- CyberShake Model: Study 14.2
- Velocity Model: CVM-S4.26
- Earthquake Rupture Forecast: UCERF2
- Rupture Generator: GP 2010
- Background Seismicity: None
- RotD100 Software: Modified BBP RotD50
- GMPE 2008 GMRotI50 to RotD100 conversion factors: See spreadsheet
- GMPE 2014 RotD50 to RotD100 conversion factors: See spreadsheet
Deterministic MCER Results
CyberShake deterministic MCER results for the 14 sites, along with comparable results for the 2008 and 2014 NGA models.
- Deterministic MCER Results. (Excel xls file)
This zip file contains pseudo spectral velocity plots for the deterministic results.
- Deterministic MCER Plots. (850Kb zip file containing PNG images)
Metadata for these results include:
- CyberShake Model: Study 14.2
- Velocity Model: CVM-S4.26
- Earthquake Rupture Forecast: UCERF2
- Rupture Generator: GP 2010
- Background Seismicity: None
- RotD100 Software: Modified BBP RotD50
- GMPE 2008 GMRotI50 to RotD100 conversion factors: See probabilistic spreadsheet
- GMPE 2014 RotD50 to RotD100 conversion factors: See probabilistic spreadsheet
Combined MCER Plots
From the probabilistic and deterministic results, we have produced combined MCER plots of two types, both plotting PSV at periods from 1-10 sec, using the probabilistic and deterministic results from
The first type contains 5 curves for each site and are available here: All plots
- average of the probabilistic NGAs (2014) without Idriss. This was attained by averaging the 4 NGA hazard curves, then convolving with the fragility function.
- average of the deterministic NGAs (2014) without Idriss
- probabilistic MCER for Cybershake
- deterministic Cybershake
- ASCE 7-10 Det Lower Limit
The second type contains 3 curves for each site and are available here: MCER plots
- CyberShake: lower of probabilistic MCER and (higher of deterministic and ASCE deterministic lower limit). For CyberShake, the probabilistic is always lower than the deterministic.
- NGA (2014): lower of probabilistic MCER and (higher of deterministic and ASCE deterministic lower limit).
- ASCE 7-10 Ch 11.4


