1D Model Development
From SCECpedia
Jump to navigationJump to search
Contents
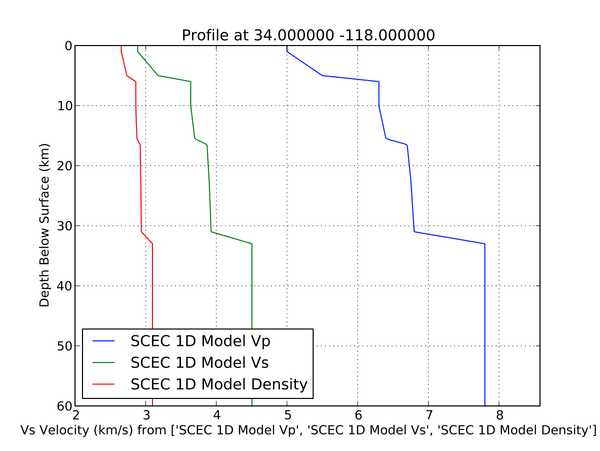
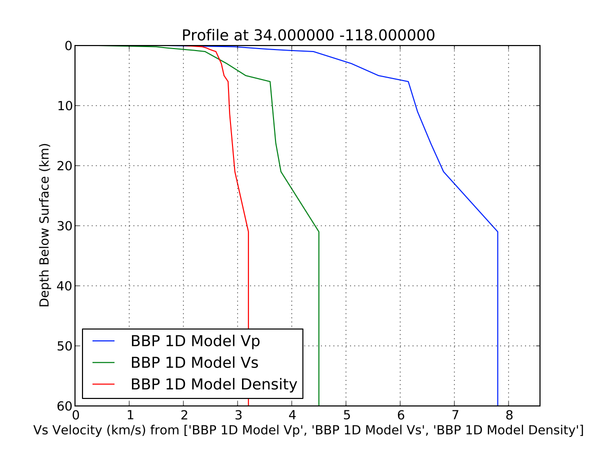
BBP 1D Model for LA Basin
18
  0.0020   1.7000   0.4500   2.0000    45.00    22.50
  0.0040   1.8000   0.6500   2.1000    65.00    32.50
  0.0060   1.8000   0.8500   2.1000    85.00    42.50
  0.0080   1.9000   0.9500   2.1000    95.00    47.50
  0.0100   2.0000   1.1500   2.2000   115.00    57.50
  0.0700   2.4000   1.2000   2.2000   120.00    60.00
  0.2000   2.8000   1.4000   2.3000   140.00    70.00
  0.2000   3.1000   1.6000   2.4000   160.00    80.00
  0.2000   3.4000   1.8000   2.4500   180.00    90.00
  0.3000   3.7000   2.1000   2.5000   210.00   105.00
  2.0000   4.4000   2.4000   2.6000   240.00   120.00
  2.0000   5.1000   2.8000   2.7000   280.00   140.00
  1.0000   5.6000   3.1500   2.7500   315.00   157.50
  5.0000   6.1500   3.6000   2.8250   360.00   180.00
  5.0000   6.3200   3.6500   2.8500   365.00   182.50
  5.0000   6.5500   3.7000   2.9000   370.00   185.00
 10.0000   6.8000   3.8000   2.9500   380.00   190.00
999.0000   7.8000   4.5000   3.2000   450.00   225.00
1D Model Selection for CyberShake
Currently, there are multiple alternative 1D models being evaluated for the next CyberShake run.
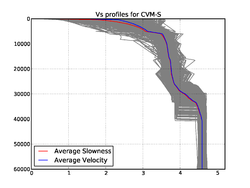
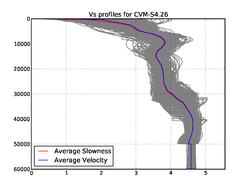
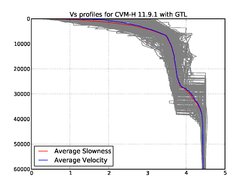
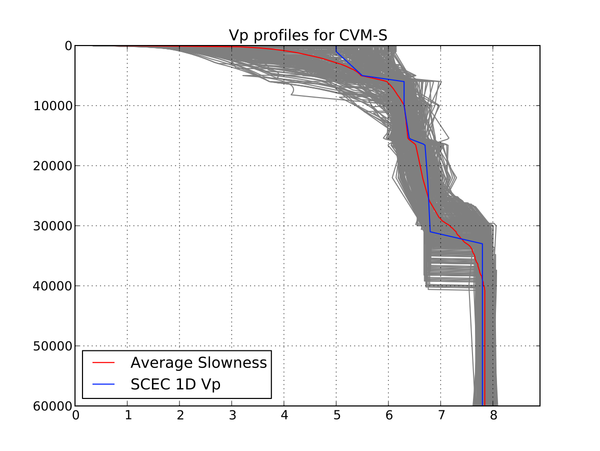
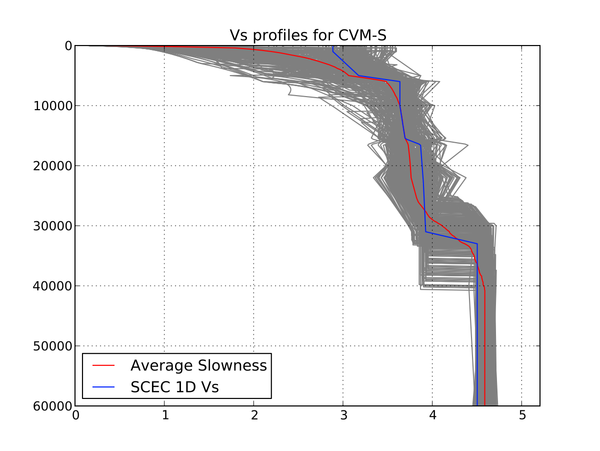
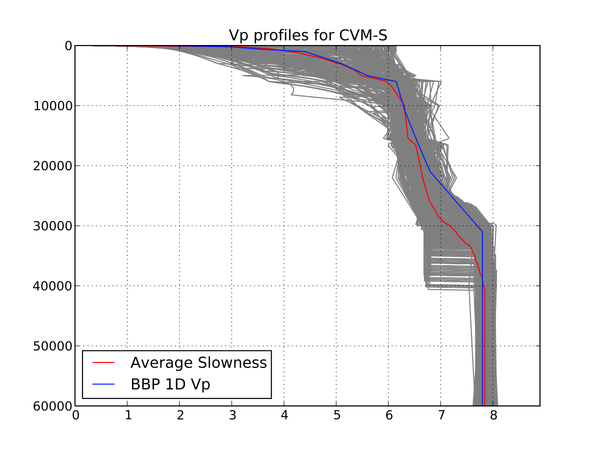
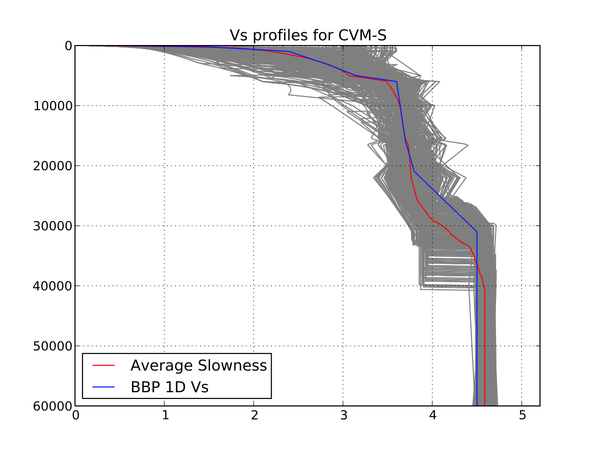
Below are plots averaging each CVM (CVM-S4, CVM-S4.26, and CVM-H 11.9.1 with GTL) over the 286 stations included within the last CyberShake 13.4 study.
CVM-S
Vp average plot
Vs average plot
Rho average plot
CVM-S4.26
Vp average plot
Vs average plot
Rho average plot
CVM-H 11.9.1 with GTL
Vp average plot
Vs average plot
Rho average plot
