CyberShake migration to Summit
This page is being used to gather information on the effort to migrate CyberShake from Titan to Summit.
Contents
Software Status
Initially, we are running each phase on Summit and comparing the output with that on Titan.
- PreCVM: OK
- UCVM: OK
- Smoothing: OK
- PreSGT: OK
- PreAWP: OK
- AWP-GPU-SGT: OK
- Rupture Generator: OK
- DirectSynth: OK
- HazardCurve: OK
The next steps are to run end-to-end workflows and verify the results, for both the TEST site and for s2257.
- End-to-end workflow, TEST: OK
- Point-source test, 1D model:
- End-to-end workflow, s2257: OK
- End-to-end workflow, USC: OK
- End-to-end workflow, s001: OK
- End-to-end workflow, USC, RSQSim (ERF 48):
UCVM
Summit and Titan results agree very well, to floating-point error:
Average absolute difference: 3e-13
Average absolute percentage difference: 6.748571e-15%%
Largest difference: 0.00, at index 6882517392.
Largest percent difference: 0.00%, at index 2816011138
Absolute percentage difference histogram:
   0.0001   0.0010   0.0100   0.1000   0.3000   1.0000   3.0000   10.0000   100.0000   1000.0000
17388000000   0   0   0   0   0   0   0   0   0   0
 100.00%   0.00%   0.00%   0.00%   0.00%   0.00%   0.00%   0.00%   0.00%   0.00%   0.00%
100.00%   100.00%   100.00%   100.00%   100.00%   100.00%   100.00%   100.00%   100.00%   100.00%   100.00%
Smoothing
Summit and Titan results agree closely:
Average absolute difference: 7e-02
Average absolute percentage difference: 1.620595e-03%
Largest difference: 7.58, at index 11054242335.
Largest percent difference: 0.11%, at index 9972096119
Absolute percentage difference histogram:
   0.0001   0.0010   0.0100   0.1000   0.3000   1.0000   3.0000   10.0000   100.0000   1000.0000
16586999210   800953496   47294   0   0   0   0   0   0   0   0
 95.39%   4.61%   0.00%   0.00%   0.00%   0.00%   0.00%   0.00%   0.00%   0.00%   0.00%
95.39%   100.00%   100.00%   100.00%   100.00%   100.00%   100.00%   100.00%   100.00%   100.00%   100.00%
This difference seems to be due to floating-point error. A float is used to accumulate values before averaging, and now that we are using 20 km smoothing with 100 m spacing, enough data is stored that some of the precision is lost.
If we compare Summit using double-precision to Titan using double-precision, we're back to negligible error:
Average absolute difference: 2e-12
Average absolute percentage difference: 4.053278e-14%
Largest difference: 0.00, at index 1287951102.
Largest percent difference: 0.00%, at index 1287951102
Absolute percentage difference histogram:
   0.0001   0.0010   0.0100   0.1000   0.3000   1.0000   3.0000   10.0000   100.0000   1000.0000
17388000000   0   0   0   0   0   0   0   0   0   0
 100.00%   0.00%   0.00%   0.00%   0.00%   0.00%   0.00%   0.00%   0.00%   0.00%   0.00%
100.00%   100.00%   100.00%   100.00%   100.00%   100.00%   100.00%   100.00%   100.00%   100.00%   100.00%
AWP-GPU-SGT
We arbitrarily selected site s2257 and ran the X-component (the AWP X-component, which is the RWG Y-component) on Summit, to compare to the results on Titan.
Numerical comparison
When comparing all SGT points (test-reference), we get:
Average diff = 1.317764e-12, average percent diff = -3.324251%
Largest diff of 0.000150 at float index 1718660606.
Largest percent diff of 5017404928.000000% at float index 8636382051.
When we only consider points greater than 1e-10 (peak SGT values are usually 1e-4 to 1e-3), we get:
Average diff = 1.317764e-12, average percent diff = 0.133713%, average absolute percent diff = 12.979661%
Largest diff of 0.000150 at float index 1718660606.
Largest percent diff of 7148245.500000% at float index 1626932526.
The average percent diff is much less than before, but we included the absolute percent diff, which reveals that many points differ by considerable amounts and there was some canceling going on when looking at the average percent diff.
As a result of this, we decided to more closely investigate what is causing the differences between the two systems.
Initial plots
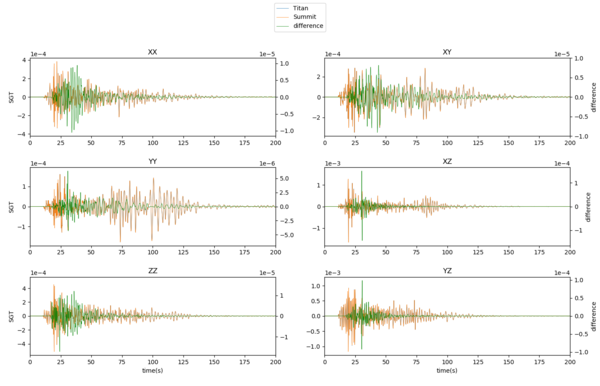
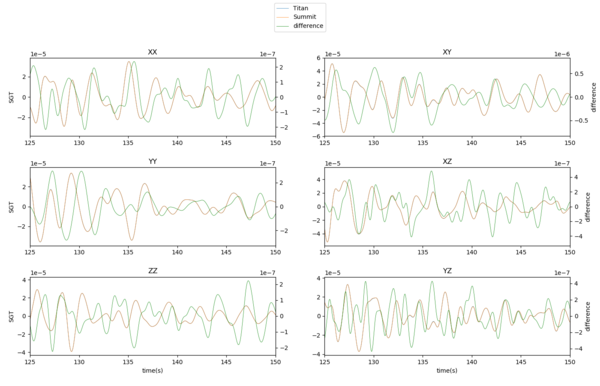
We identified point ID 71610 as the point which contains the largest difference between the test and reference SGTs.
Below are plots of this point, comparing the Titan and Summit results and the difference. The zoomed-in version focuses on the 25 seconds with the largest differences.
CUDA versions
The default version of CUDA on Titan is 9.1.85 and on Summit it's 9.2.148. We tried rebuilding the AWP code on Summit with 9.1.85 and GCC and rerunning. It didn't make much difference:
Average diff = 1.272838e-12, average percent diff = 0.133971%, average absolute percent diff = 12.971045%
Largest diff of 0.000150 at float index 1718660606.
Largest percent diff of 7148275.000000% at float index 1626932526
X and Y-only work distribution
We tried distributing the work only across X (PX=120, PY=1, PZ=1)but got similar differences.
X:
Average diff = 1.317764e-12, average percent diff = 0.133713%, average absolute percent diff = 12.979661%
Largest diff of 0.000150 at float index 1718660606.
Largest percent diff of 7148245.500000% at float index 1626932526.
We also tried it across Y (PX=1, PY=210, PZ=1). This resulted in a memory error:
*** Error in `/gpfs/alpine/proj-shared/geo112/CyberShake/software/AWP-GPU-SGT/bin/pmcl3d': free(): invalid size:
0x0000000040728bc0 ***
======= Backtrace: =========
/lib64/libc.so.6(cfree+0x4a0)[0x2000004f9cd0]
/gpfs/alpine/proj-shared/geo112/CyberShake/software/AWP-GPU-SGT/bin/pmcl3d[0x10008d34]
/gpfs/alpine/proj-shared/geo112/CyberShake/software/AWP-GPU-SGT/bin/pmcl3d[0x10008774]
/lib64/libc.so.6(+0x25100)[0x200000485100]
/lib64/libc.so.6(__libc_start_main+0xc4)[0x2000004852f4]
Smaller SGTs
We tried generating SGTs for the SMALL site, which are about 6% the size of s2257, on both Titan and Summit. We actually saw even larger average differences:
Average diff = 6.027801e-12, average percent diff = -1.673267%, average absolute percent diff = 21.367271%
Largest diff of 0.000067 at float index 175412388.
Largest percent diff of 2091817.000000% at float index 1363132518.
Frequency content
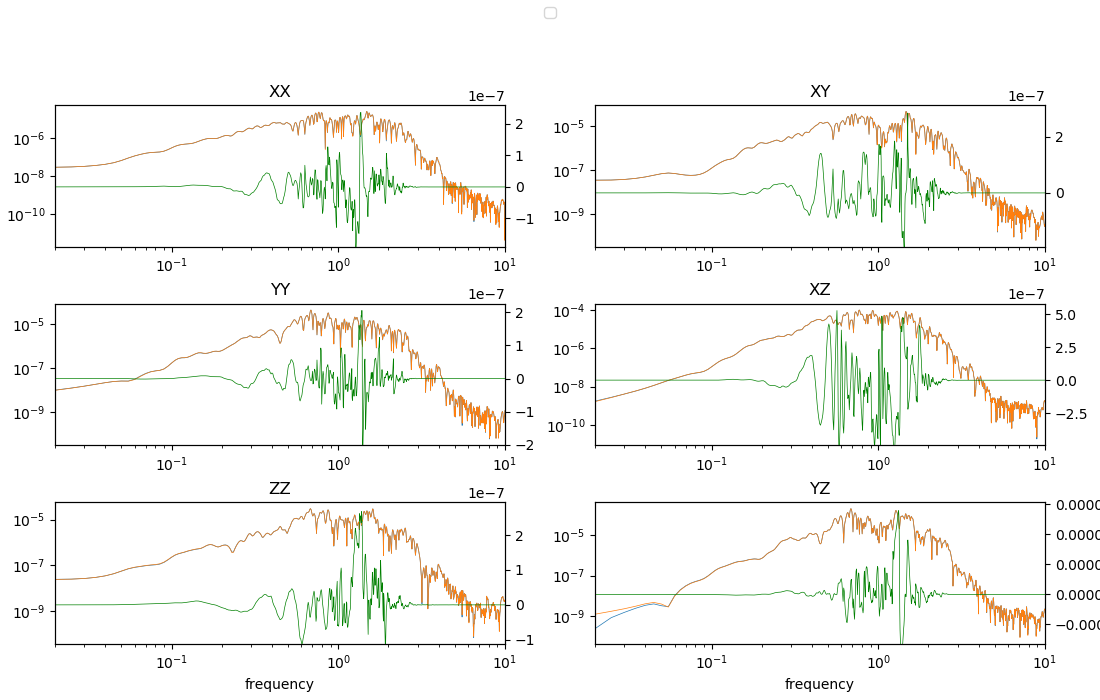
We did a frequency content analysis on the largest difference SGT from the SMALL site:
Ossian's test
Ossian O'Reilly created a simple, single-GPU test here on Github.
Running his test on Titan and Summit, and running his comparison script, I obtained the following agreement:
Difference (titan, x=1, y=1) (summit, x=1, y=1), l2 (abs): 2.050260e-04 l2 (rel) 2.090467e-06 l1 (abs) 1.097141e-01 l1 (rel) 7.702747e-06 linf (abs) 6.659655e-06 linf (rel) 1.872744e-06
Comparing the same two outputs using my scripts, using a cutoff for percent comparisons of 1e-6:
Average diff = 6.023823e-10, average percent diff = -0.026654%, average absolute percent diff = 0.452920%
Largest diff of 0.000007 at float index 128648.
Largest percent diff of 69.524002% at float index 3874621.
Absolute percentage difference histogram:
     0.0001   0.0010   0.0100   0.1000   0.3000   1.0000   3.0000    10.00    100.00    1000.0
138147   187512   179189   202769   122466   110331    57253    27862     7452        0        0
 13.37%   18.15%   17.35%   19.63%   11.86%   10.68%    5.54%    2.70%    0.72%    0.00%    0.00%
 13.37%   31.53%   48.87%   68.50%   80.36%   91.04%   96.58%   99.28%  100.00%  100.00   100.00%
Approximately half the points have a percent difference less than 0.01%, 90% less than 0.3%, and 99% less than 3%.
These two comparisons show us different information: point-to-point comparison can be biased by small values which have little impact on the result. For example, ~80% of the points have values less than 1e-6, but the largest values are greater than 1. L1 comparison can be biased by the largest points, which carry much more weight than points 1 or 2 orders of magnitude lower, which are still important for agreement.
I tried running my code vs Ossian's code on Summit. The difference is how y_rank_F and y_rank_B are handled in Ossian's version. We see differences similar to those above:
Average diff = 3.603304e-09, average percent diff = -0.000870%, average absolute percent diff = 0.585565%
Largest diff of 0.000475 at float index 3272633.
Largest percent diff of 16670.455078% at float index 3272726.
Absolute percentage difference histogram:
  0.0001   0.0010   0.0100   0.1000   0.3000   1.0000   3.0000   10.0000   100.0000   1000.0000
67238   114994   199943   268809   145799   121488   68547   38022     7930         84           1
6.51%   11.13%   19.36%   26.03%   14.12%   11.76%    6.64%   3.68%    0.77%      0.01%       0.00%
6.51%   17.64%   37.00%   63.03%   77.14%   88.91%   95.54%  99.22%   99.99%    100.00%     100.00%
Additional tests
Comparison using Ossian's parameters with CyberShake code on Titan vs Summit, no optimization:
Average diff = 3.000922e-09, average percent diff = 0.013876%, average absolute percent diff = 0.650546%
Largest diff of 0.000475 at float index 3272633.
Largest percent diff of 16670.525391% at float index 3272726.
Absolute percentage difference histogram:
  0.0001   0.0010   0.0100   0.1000   0.3000   1.0000   3.0000   10.0000   100.0000   1000.0000
72818   114632   210094   283026   131370    108666   63794  36609    11761        84           1
 7.05%   11.10%   20.34%   27.40%   12.72%   10.52%   6.18%   3.54%    1.14%     0.01%       0.00%
 7.05%   18.15%   38.49%   65.89%   78.61%   89.13%  95.31%  98.85%   99.99%   100.00%     100.00%
Bug fix
Ossian identified a bug in most versions of AWP, including the SGT code. The bug is in pmcl3d.c, in lines 267 and 268:
   err       = MPI_Cart_shift(MC1, 0,  1,  &x_rank_L, &x_rank_R );
   err       = MPI_Cart_shift(MC1, 1,  1,  &y_rank_F, &y_rank_B );
If the process calling these functions is a boundary process - that is, it has no previous neighbor in the Y-direction, for example - the neighbor variable (y_rank_F, y_rank_B, x_rank_L, x_rank_R) is set to MPI_UNDEFINED. On Titan, MPI_UNDEFINED is -1, but on Summit it is only required to be less than 0.
Later, the kernel to perform data exchange is called if the neighbor variable is not -1. On Titan, this means the kernel is not called when there is no neighbor, but on Summit it is. Additionally, the buffer used in this exchange is uninitialized, so the effect on Summit is that random values are exchanged with the boundary process, leading to errors.
To fix this, Ossian included the following lines of code in pmcl3d.c, line 273:
   // If any neighboring rank is out of bounds, then MPI_Cart_shift sets the
   // destination argument to a negative number. We use the convention that -1
   // denotes ranks out of bounds.
   if (x_rank_L < 0) {
           x_rank_L = -1;
   }
   if (x_rank_R < 0 ) {
           x_rank_R = -1;
   }
   if (y_rank_F < 0) {
           y_rank_F = -1;
   }
   if (y_rank_B < 0) {
           y_rank_B = -1;
   }
This ensures the kernel is not called if there is no neighbor. Additionally, all device memory is now initialized to 0.
Verification tests
Following the implementation of Ossian's bug fix, the results on Titan and Summit came into much better agreement.
For a full-scale SGT calculated at site s2257, we see the following differences (minimum differences at 1e-6):
Average diff = -7.335352e-13, average percent diff = 0.000036%, average absolute percent diff = 0.038536%
Largest diff of 0.000006 at float index 240929422.
Largest percent diff of 338.659698% at float index 41967549362.
Absolute percentage difference histogram:
   0.0001   0.0010   0.0100   0.1000   0.3000   1.0000   3.0000   10.0000   100.0000   1000.0000
478231446   1819753594   2113474276   1241972140   295957433   157813438   27593530   2496656   151869   503   0
 7.79%   29.65%   34.44%   20.24%   4.82%   2.57%   0.45%   0.04%   0.00%   0.00%   0.00%
7.79%   37.44%   71.88%   92.11%   96.94%   99.51%   99.96%   100.00%   100.00%   100.00%   100.00%
Repeating with a cutoff of 1e-10:
19702828989 points used for percent comparison, of 43417008000 total.
Average diff = -7.335352e-13, average percent diff = 0.000288%, average absolute percent diff = 0.491180%
Largest diff of 0.000006 at float index 240929422.
Largest percent diff of 538614.875000% at float index 42529049490.
Absolute percentage difference histogram:
   0.0001   0.0010   0.0100   0.1000   0.3000   1.0000   3.0000   10.0000   100.0000   1000.0000
559826373   2204732859   3735746248   6725999521   3262492383   2066082069   753902072   280090672   106501047   7143593   312152
 2.84%   11.19%   18.96%   34.14%   16.56%   10.49%   3.83%   1.42%   0.54%   0.04%   0.00%
2.84%   14.03%   32.99%   67.13%   83.69%   94.17%   98.00%   99.42%   99.96%   100.00%   100.00%
We also compared Titan before the bugfix to Titan after (cutoff of 1e-10). The results are identical.
19702828989 points used for percent comparison, of 43417008000 total.
Average diff = 0.000000e+00, average percent diff = 0.000000%, average absolute percent diff = 0.000000%
Largest diff of 0.000000 at float index -1.
Largest percent diff of 0.000000% at float index -1.
Absolute percentage difference histogram:
   0.0001   0.0010   0.0100   0.1000   0.3000   1.0000   3.0000   10.0000   100.0000   1000.0000
19702828989   0   0   0   0   0   0   0   0   0   0
 100.00%   0.00%   0.00%   0.00%   0.00%   0.00%   0.00%   0.00%   0.00%   0.00%   0.00%
100.00%   100.00%   100.00%   100.00%   100.00%   100.00%   100.00%   100.00%   100.00%   100.00%   100.00%
DirectSynth
When I first tried running DirectSynth on Summit, I saw seg faults in the workers somewhere in the FFTW package, with both the intel and gcc compilers. Switching from fftw v3.3.8 to fftw v3.3.5 seems to have fixed this issue. I could not replicate this problem when running the TEST site, only a full-sized site (s2257).
In point-to-point comparisons between the timeseries, we see differences. For most rupture variations, these differences are no larger that a few percent, but there are a few source/rupture/RV combinations with much bigger differences, in excess of 100% (for example, 0.803838 compared to -2.545603) and with a clear visual difference at the peaks and valleys.
All these differences can be traced back to small differences in the SRFs, which get amplified by rounding, ceilings, or floors.
itshift
The small differences seem to be the result of different values for itshift in timeshift_sgt(), in jbsim/sgt_subs.c around line 1225:
itshift = (int)(tsh/sgtheadptr->dt + 0.5);
Since a cast to int is involved, the difference comes from this floor: if tsh/sgtheadptr->dt is slightly more or slightly less that *.5, it will cause itshift to differ by 1. tsh comes from:
tsh = t0[ig] + *bt0; (line 1218)
- bt0 is passed into timeshift_sgt() from sum_sgt(), where is is called backt0, and it is defined as:
backt0 = backt0 + *rupt - *tstart; (line 1160)
- rupt is a parameter, tinit, from the SRF, read in get_srfpars(). For one point I examined, on the reference system (Blue Waters), the tinit value is 12.824999. On Summit, it is 12.825000. This slight difference leads Blue Waters to round itshift down, and on Summit it is rounded up. If itshift is different by 1, it shifts the entire timeseries for that single rupture point by 1 timestep. When this is added into the overall seismogram, it leads to differences. , but these differences do not seem to be consequential overall: the RotD values agree to a tolerance of 5e-4, suggesting very little impact on the hazard curves.
tinit times
The larger differences are also related to tinit, but in a different way. We discovered that the tinit values in the SRFs were quite different, so we used source 127, rupture 399, rv 1 to investigate.
In most of the genslip code, the tinit value is tracked as the pointsource.rupt value (and copied over to the srf structure at the end). pointsource.rupt is modified by a scale factor in genslip-v3.3.1.c, about line 1345. This scale factor (sf) is computed a few lines previously and involves a call to _gaus_rand() with a seed.
This seed is used many times previously in genslip (and every time it is used, it changes). In particular, it is used in the _load_slip_srf_dd2() function in srf_subs.c, in line 1124, in a call to _gaus_rand(). However, this call is only executed if the if statement in line 1094 (sabs > MINSLIP) is true. sabs is the absolute value of the slip at this point, and MINSLIP is 0.01. For the reference code, sabs for one point (#20868) is just greater than MINSLIP (0.010027), whereas for the Summit test the value was just below MINSLIP (0.009997). This means that in the reference code, _gaus_rand() is called one additional time, changing the seed so the seeds are totally different moving forward.
Why are these slips different? These slips are initially set in scale_slip_fftw() function, in line 277:
ps[i + j*nx].slip = fac*cs[i + (j+nys)*nx].re
cs.re is slightly different between the two systems: 4.860749e-05 on the reference system, 4.846116e-05 on Summit.
The cs.re values are set in genslip-v3.3.1.c, line 978:
cslip[ip].re = sigfac*(cslip[ip].re - sum) + sum;
For the reference code the values are:
sigfac=1.327176, cslip.re before=1.198164e-01, sum=0.485882
For the test code on Summit the values are:
sigfac=1.327176, cslip.re before=1.198163e-01, sum=0.485882
Since sigfac*(cslip[ip].re - sum) is very close to sum, the resulting value is very small (~4e-5), and mostly filled with floating-point noise, as all 3 parameters are type float. This means that differences in the 6th decimal place in cslip.re lead to an issue.
This could just be considered system noise, but it turns out that turning off optimizations changes the Summit results slightly so that sabs is no longer less than MINSLIP. This means that _gaus_rand() is called the same number of times, the seed starts in the same place when the scale factors for tinit are generated, and the resulting tinits are very similar.
I was able to pinpoint the specific GNU compiler optimization that causes the difference, -fexpensive-optimizations, which is part of the default for O2. This is likely because -fexpensive-optimizations turns on fused multiply-add in architectures which support it (including the AMD Interlagos processors with Bulldozer cores in the XE6/XK7 nodes on Blue Waters and Titan, and also the IBM POWER9s on Summit), and this leads to differences in precision than if the calculations are performed separately. A discussion of this is available in this MySQL bug report. An alternative may be to set -ffp-contract=off, which would preserve some of the other optimizations enabled by -fexpensive-optimizations.
So, in summary:
- A compiler optimization, -fexpensive-optimizations, changes the math slightly on Summit.
- This very slightly changes the values in cslip.re (which originally come from a FFT).
- This has an impact when the modified cslip.re in line 978 is close to zero, as the importance of the 6th and farther decimal points is increased under certain combinations of inputs.
- This, in turn, affects ps.slip in scale_slip_fftw(), and causes it to be slightly under MINSLIP instead of over.
- When this value is checked against MINSLIP in _load_slip_srf_dd2(), line 1094, the if statement is executed on the reference system, but not on Summit.
- This causes _gaus_rand() to be called an additional time on the reference system.
- This causes the seed on the reference system and Summit to get out of sync.
- When the seed is used to construct tinit values, the reference and Summit values are very different.
- This leads to differences in how the contribution from each point-source is time-shifted before being combined, yielding different seismograms.
Turning off the compiler optimization leads to much better agreement for this rupture. The biggest difference is ~10%. Below are differences by bin:
0.000100 <= reference amplitude < 0.010000:
	avg diff=0.000026, avg percent diff=1.247424%
0.010000 <= reference amplitude < 0.100000:
	avg diff=0.000035, avg percent diff=0.116100%
0.100000 <= reference amplitude < 1.000000:
	avg diff=0.000073, avg percent diff=0.027272%
1.000000 <= reference amplitude < 10.000000:
	avg diff=0.000482, avg percent diff=0.015734%
10.000000 <= reference amplitude < 100.000000:
	avg diff=0.000891, avg percent diff=0.004810%
100.000000 <= reference amplitude < 1000.000000:
	avg diff=0.041534, avg percent diff=0.041420%
1000.000000 <= reference amplitude < 10000.000000:
The largest RotD50 difference is 7e-4 and is unlikely to impact the curves much.
Possible solutions
- Since tinit is supposed to have a random component anyway, accept that this random component will be different now for some events, but that does not make the new seismograms less correct.
- Turn off the specific compiler optimization. This fixes issue #2, but does not affect issue #1, so we will still see seismograms with individual differences up to ~10%. However, this does bring the RotD values into agreement with a less than 1% difference.
- Modify the code to use higher-precision variables in certain places. It's not clear which way these values will be impacted.
- Don't worry about backwards consistency, but modify how the seed is used so that the seed being used more times in one function doesn't impact the seed in other functions.
Likely, this will not impact future hazard maps, as our plan is to migrate to a more recent version of the rupture generator.
After discussion, we decided to go with option 2. After making this change, we performed the verification seen below.
Verification
After disabling expensive-optimizations, we found that the average differences between the reference and test seismograms were typically less than 1%, and got smaller as the seismogram values increased.
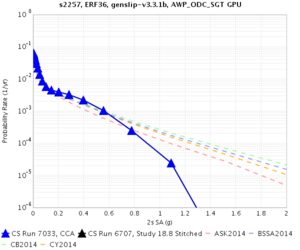
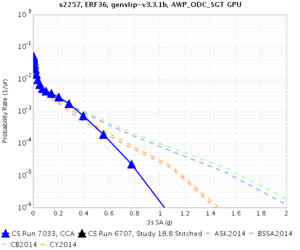
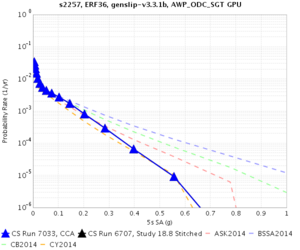
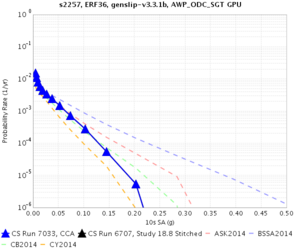
Next we completed a hazard curve, using post-processing results from Summit, and compared the results to those from Study 18.8.
| 2 sec RotD50 | 3 sec RotD50 | 5 sec RotD50 | 10 sec RotD50 |
|---|---|---|---|
These are the raw values for the 3 sec hazard curve.
| X-Value | Study 18.8 Y-value | Summit Y-value | Difference | Percent difference |
|---|---|---|---|---|
| 0.005 | 0.0499733 | 0.0499663 | -7e-6 | -0.014% |
| 0.007 | 0.0428514 | 0.0428439 | -7.5e-6 | -0.018% |
| 0.0098 | 0.0354694 | 0.0354768 | 7.4e-6 | 0.021% |
| 0.0137 | 0.0273952 | 0.0273892 | -6e-6 | -0.022% |
| 0.0192 | 0.0197914 | 0.0197876 | -3.8e-6 | -0.019% |
| 0.0269 | 0.0137105 | 0.0137083 | -2.2e-6 | -0.016% |
| 0.0376 | 0.00932649 | 0.00932644 | -5e-8 | -0.001% |
| 0.0527 | 0.00654698 | 0.00654668 | -3e-7 | -0.005% |
| 0.0738 | 0.00492863 | 0.0049287 | 7e-8 | 0.001% |
| 0.103 | 0.00411309 | 0.00411313 | 4e-8 | 0.001% |
| 0.145 | 0.00350308 | 0.00350329 | 2.1e-7 | 0.006% |
| 0.203 | 0.00271325 | 0.00271217 | -1.1e-6 | -0.040% |
| 0.284 | 0.00168385 | 0.0016837 | -1.5e-7 | -0.009% |
| 0.397 | 0.000704924 | 0.000704895 | -2.9e-8 | -0.004% |
| 0.556 | 0.000186071 | 0.000186079 | 8e-9 | 0.004% |
| 0.778 | 2.20794E-05 | 2.20742E-05 | -5.2e-9 | -0.024% |
| 1.09 | 5.29456E-07 | 5.29375E-07 | -8.1e-11 | -0.015% |
| 1.52 | 1.79678E-08 | 1.79623E-08 | -5.5e-12 | -0.031% |
| 2.13 | 0 | 0 | 0 |
End-to-end workflow tests
TEST site
Using rvGAHP, we ran an end-to-end workflow for the TEST site at 0.5 Hz entirely on Summit, and compared the results to the TEST site run entirely on Blue Waters:
| X-Value | Reference value | Test value | Difference | % Difference |
|---|---|---|---|---|
| 0.005 | 0.00669446 | 0.00669446 | 0 | 0.000% |
| 0.007 | 0.00669446 | 0.00669446 | 0 | 0.000% |
| 0.0098 | 0.00668038 | 0.00668038 | 0 | 0.000% |
| 0.0137 | 0.0066521 | 0.0066521 | 0 | 0.000% |
| 0.0192 | 0.00651746 | 0.00651746 | 0 | 0.000% |
| 0.0269 | 0.00630684 | 0.00630684 | 0 | 0.000% |
| 0.0376 | 0.00576566 | 0.00576571 | -5E-08 | -0.001% |
| 0.0527 | 0.00510256 | 0.00510258 | -2E-08 | 0.000% |
| 0.0738 | 0.00416448 | 0.0041645 | -2E-08 | 0.000% |
| 0.103 | 0.00281056 | 0.00281057 | -1E-08 | 0.000% |
| 0.145 | 0.00166928 | 0.00166928 | 0 | 0.000% |
| 0.203 | 0.000838862 | 0.000838864 | -2E-09 | 0.000% |
| 0.284 | 0.000364661 | 0.000364561 | 1E-07 | 0.027% |
| 0.397 | 0.000127364 | 0.000127364 | 0 | 0.000% |
| 0.556 | 2.73214E-05 | 2.73221E-05 | -7E-10 | -0.003% |
| 0.778 | 4.68939E-06 | 4.68916E-06 | 2.3E-10 | 0.005% |
| 1.09 | 1.89423E-07 | 1.89488E-07 | -6.5E-11 | -0.034% |
| 1.52 | 0 | 0 | 0 | |
| 2.13 | 0 | 0 | 0 |
s2257
Here are the results for end-to-end with s2257 (run ID 7036), compared to Study 18.8 results.
| X-Value | Study 18.8 Y-value | Summit Y-value | Difference | Percent difference |
|---|---|---|---|---|
| 0.005 | 0.0499733 | 0.0499658 | 7.5E-06 | 0.015% |
| 0.007 | 0.0428514 | 0.0428439 | 7.5E-06 | 0.018% |
| 0.0098 | 0.0354694 | 0.0354769 | -7.5E-06 | -0.021% |
| 0.0137 | 0.0273952 | 0.0273894 | 5.8E-06 | 0.021% |
| 0.0192 | 0.0197914 | 0.0197876 | 3.8E-06 | 0.019% |
| 0.0269 | 0.0137105 | 0.0137083 | 2.2E-06 | 0.016% |
| 0.0376 | 0.00932649 | 0.0093265 | -1E-08 | 0.000% |
| 0.0527 | 0.00654698 | 0.00654666 | 3.2E-07 | 0.005% |
| 0.0738 | 0.00492863 | 0.0049287 | -7E-08 | -0.001% |
| 0.103 | 0.00411309 | 0.00411314 | -5E-08 | -0.001% |
| 0.145 | 0.00350308 | 0.00350329 | -2E-07 | -0.006% |
| 0.203 | 0.00271325 | 0.00271217 | 1.08E-06 | 0.040% |
| 0.284 | 0.00168385 | 0.0016837 | 1.5E-07 | 0.009% |
| 0.397 | 0.000704924 | 0.000704895 | 2.9E-08 | 0.004% |
| 0.556 | 0.000186071 | 0.000186078 | -7E-09 | -0.004% |
| 0.778 | 2.20794E-05 | 2.20742E-05 | 5.2E-09 | 0.024% |
| 1.09 | 5.29456E-07 | 5.29375E-07 | 8.1E-11 | 0.015% |
| 1.52 | 1.79678E-08 | 1.79623E-08 | 5.5E-12 | 0.031% |
| 2.13 | 0 | 0 | 0 |
s001
Here are the results for the 3 second RotD50 hazard curves for s001, comparing the Summit results (run 7048) to Study 17.3 (run 4762). We initially had issues getting good agreement. We eventually tracked this down to the wrong dt being used in the post-processing.
| X-Value | Study 17.3 Y-value | Summit Y-value | Difference | Percent difference |
|---|---|---|---|---|
| 0.0001 | 0.112881 | 0.112881 | 0 | 0.000% |
| 0.00013 | 0.112757 | 0.112757 | 0 | 0.000% |
| 0.00016 | 0.112518 | 0.112518 | 0 | 0.000% |
| 0.0002 | 0.112318 | 0.112318 | 0 | 0.000% |
| 0.00025 | 0.111814 | 0.111814 | 0 | 0.000% |
| 0.00032 | 0.111203 | 0.111203 | 0 | 0.000% |
| 0.0004 | 0.110539 | 0.110538 | -1E-06 | -0.001% |
| 0.0005 | 0.109372 | 0.10937 | -2E-06 | -0.002% |
| 0.00063 | 0.107371 | 0.107371 | 0 | 0.000% |
| 0.00079 | 0.106133 | 0.106133 | 0 | 0.000% |
| 0.001 | 0.103842 | 0.103841 | -1E-06 | -0.001% |
| 0.00126 | 0.101112 | 0.101113 | 1E-06 | 0.001% |
| 0.00158 | 0.0982986 | 0.0983003 | 1.7E-06 | 0.002% |
| 0.002 | 0.0947908 | 0.0947913 | 5E-07 | 0.001% |
| 0.00251 | 0.0916154 | 0.0916168 | 1.4E-06 | 0.002% |
| 0.00316 | 0.088142 | 0.088144 | 2E-06 | 0.002% |
| 0.00398 | 0.0852933 | 0.0852982 | 4.9E-06 | 0.006% |
| 0.00501 | 0.0827283 | 0.0827292 | 9E-07 | 0.001% |
| 0.00631 | 0.0799135 | 0.0799142 | 7E-07 | 0.001% |
| 0.00794 | 0.0770707 | 0.0770722 | 1.5E-06 | 0.002% |
| 0.01 | 0.0732673 | 0.0732634 | -3.9E-06 | -0.005% |
| 0.01259 | 0.0690995 | 0.0691017 | 2.2E-06 | 0.003% |
| 0.01585 | 0.0640356 | 0.0640367 | 1.1E-06 | 0.002% |
| 0.01995 | 0.0583633 | 0.0583619 | -1.4E-06 | -0.002% |
| 0.02512 | 0.0525668 | 0.0525664 | -4E-07 | -0.001% |
| 0.03162 | 0.0466174 | 0.0466178 | 4E-07 | 0.001% |
| 0.03981 | 0.0404638 | 0.040466 | 2.2E-06 | 0.005% |
| 0.05012 | 0.0342944 | 0.0342936 | -8E-07 | -0.002% |
| 0.0631 | 0.028332 | 0.0283329 | 9E-07 | 0.003% |
| 0.07943 | 0.022688 | 0.0226883 | 3E-07 | 0.001% |
| 0.1 | 0.0171757 | 0.0171756 | -1E-07 | -0.001% |
| 0.12589 | 0.0121139 | 0.0121138 | -1E-07 | -0.001% |
| 0.15849 | 0.00767736 | 0.00767789 | 5.3E-07 | 0.007% |
| 0.19953 | 0.00429292 | 0.00429199 | -9.3E-07 | -0.022% |
| 0.25119 | 0.00210135 | 0.00210123 | -1.2E-07 | -0.006% |
| 0.31623 | 0.000865743 | 0.000865871 | 1.28E-07 | 0.015% |
| 0.39811 | 0.00032284 | 0.000322808 | -3.2E-08 | -0.010% |
| 0.50119 | 9.69045E-05 | 9.68901E-05 | -1.44E-08 | -0.015% |
| 0.63096 | 2.2125E-05 | 2.21322E-05 | 7.2E-09 | 0.033% |
| 0.79433 | 4.55471E-06 | 4.55399E-06 | -7.2E-10 | -0.016% |
| 1 | 2.57488E-07 | 2.5762E-07 | 1.32E-10 | 0.051% |
| 1.25893 | 1.86001E-08 | 1.8589E-08 | -1.11E-11 | -0.060% |
| 1.58489 | 0 | 0 | 0 | |
| 1.99526 | 0 | 0 | 0 | |
| 2.51189 | 0 | 0 | 0 | |
| 3.16228 | 0 | 0 | 0 | |
| 3.98107 | 0 | 0 | 0 | |
| 5.01187 | 0 | 0 | 0 | |
| 6.30957 | 0 | 0 | 0 | |
| 7.94328 | 0 | 0 | 0 | |
| 10 | 0 | 0 | 0 |
USC
Here are the results for the 3 second RotD50 hazard curves for USC, comparing the Summit results (run 7052) to Study 15.4 (run 3970).
| X-Value | Study 15.4 Y-value | Summit Y-value | Difference | Percent difference |
|---|---|---|---|---|
| 0.0001 | 0.0972944 | 0.0972944 | 0 | 0.000% |
| 0.00013 | 0.0972944 | 0.0972944 | 0 | 0.000% |
| 0.00016 | 0.0972944 | 0.0972944 | 0 | 0.000% |
| 0.0002 | 0.0972944 | 0.0972944 | 0 | 0.000% |
| 0.00025 | 0.0972944 | 0.0972944 | 0 | 0.000% |
| 0.00032 | 0.0972944 | 0.0972944 | 0 | 0.000% |
| 0.0004 | 0.0972944 | 0.0972944 | 0 | 0.000% |
| 0.0005 | 0.0972944 | 0.0972944 | 0 | 0.000% |
| 0.00063 | 0.0972944 | 0.0972944 | 0 | 0.000% |
| 0.00079 | 0.0972944 | 0.0972944 | 0 | 0.000% |
| 0.001 | 0.0972944 | 0.0972944 | 0 | 0.000% |
| 0.00126 | 0.0972939 | 0.0972939 | 0 | 0.000% |
| 0.00158 | 0.0972864 | 0.0972864 | 0 | 0.000% |
| 0.002 | 0.097224 | 0.0972233 | -7E-07 | -0.001% |
| 0.00251 | 0.0971004 | 0.0971003 | -1E-07 | 0.000% |
| 0.00316 | 0.0966669 | 0.096667 | 1E-07 | 0.000% |
| 0.00398 | 0.0960548 | 0.0960547 | -1E-07 | 0.000% |
| 0.00501 | 0.0948471 | 0.094847 | -1E-07 | 0.000% |
| 0.00631 | 0.0926376 | 0.09264 | 2.4E-06 | 0.003% |
| 0.00794 | 0.0898532 | 0.0898516 | -1.6E-06 | -0.002% |
| 0.01 | 0.085206 | 0.0851937 | -1.23E-05 | -0.014% |
| 0.01259 | 0.0792625 | 0.0792617 | -8E-07 | -0.001% |
| 0.01585 | 0.0727587 | 0.0727468 | -1.19E-05 | -0.016% |
| 0.01995 | 0.0648339 | 0.0648387 | 4.8E-06 | 0.007% |
| 0.02512 | 0.0569029 | 0.0569073 | 4.4E-06 | 0.008% |
| 0.03162 | 0.0489673 | 0.0489677 | 4E-07 | 0.001% |
| 0.03981 | 0.0406924 | 0.0406937 | 1.3E-06 | 0.003% |
| 0.05012 | 0.0328634 | 0.0328641 | 7E-07 | 0.002% |
| 0.0631 | 0.0257157 | 0.025718 | 2.3E-06 | 0.009% |
| 0.07943 | 0.0188606 | 0.0188556 | -5E-06 | -0.027% |
| 0.1 | 0.0130725 | 0.0130714 | -1.1E-06 | -0.008% |
| 0.12589 | 0.00821815 | 0.00821809 | -6E-08 | -0.001% |
| 0.15849 | 0.00474105 | 0.00474154 | 4.9E-07 | 0.010% |
| 0.19953 | 0.00245385 | 0.00245373 | -1.2E-07 | -0.005% |
| 0.25119 | 0.00119648 | 0.00119612 | -3.6E-07 | -0.030% |
| 0.31623 | 0.000516065 | 0.000515599 | -4.66E-07 | -0.090% |
| 0.39811 | 0.000222316 | 0.000222301 | -1.5E-08 | -0.007% |
| 0.50119 | 7.86474E-05 | 7.85415E-05 | -1.06E-07 | -0.135% |
| 0.63096 | 2.42538E-05 | 2.42854E-05 | 3.16E-08 | 0.130% |
| 0.79433 | 7.20191E-06 | 7.19527E-06 | -6.64E-09 | -0.092% |
| 1 | 1.97922E-06 | 1.9786E-06 | -6.2E-10 | -0.031% |
| 1.25893 | 7.93647E-08 | 7.88086E-08 | -5.561E-10 | -0.701% |
| 1.58489 | 0 | 0 | 0 | |
| 1.99526 | 0 | 0 | 0 | |
| 2.51189 | 0 | 0 | 0 | |
| 3.16228 | 0 | 0 | 0 | |
| 3.98107 | 0 | 0 | 0 | |
| 5.01187 | 0 | 0 | 0 | |
| 6.30957 | 0 | 0 | 0 | |
| 7.94328 | 0 | 0 | 0 | |
| 10 | 0 | 0 | 0 |
